
Ocular manifestations of central insulin resistance
2022-09-27 09:45MuneebFaiqTrinaSenguptaMadhuNathThirumurthyVelpandianDamanSalujaRimaDadaTanujDadaKevinChan
中国神经再生研究(英文版) 2023年5期
Muneeb A.Faiq , Trina Sengupta, Madhu Nath, Thirumurthy Velpandian, Daman Saluja, Rima Dada, Tanuj Dada ,Kevin C.Chan
Abstract Central insulin resistance, the diminished cellular sensitivity to insulin in the brain, has been implicated in diabetes mellitus, Alzheimer’s disease and other neurological disorders.However, whether and how central insulin resistance plays a role in the eye remains unclear.Here, we performed intracerebroventricular injection of S961, a potent and specific blocker of insulin receptor in adult Wistar rats to test if central insulin resistance leads to pathological changes in ocular structures.80 mg of S961 was stereotaxically injected into the lateral ventricle of the experimental group twice at 7 days apart, whereas buffer solution was injected to the sham control group.Blood samples, intraocular pressure, trabecular meshwork morphology, ciliary body markers, retinal and optic nerve integrity, and whole genome expression patterns were then evaluated.While neither blood glucose nor serum insulin level was significantly altered in the experimental or control group, we found that injection of S961 but not buffer solution significantly increased intraocular pressure at 14 and 24 days after first injection, along with reduced porosity and aquaporin 4 expression in the trabecular meshwork, and increased tumor necrosis factor α and aquaporin 4 expression in the ciliary body.In the retina, cell density and insulin receptor expression decreased in the retinal ganglion cell layer upon S961 injection.Fundus photography revealed peripapillary atrophy with vascular dysregulation in the experimental group.These retinal changes were accompanied by upregulation of pro-inflammatory and pro-apoptotic genes, downregulation of anti-inflammatory, anti-apoptotic, and neurotrophic genes, as well as dysregulation of genes involved in insulin signaling.Optic nerve histology indicated microglial activation and changes in the expression of glial fibrillary acidic protein, tumor necrosis factor α, and aquaporin 4.Molecular pathway architecture of the retina revealed the three most significant pathways involved being inflammation/cell stress, insulin signaling, and extracellular matrix regulation relevant to neurodegeneration.There was also a multimodal crosstalk between insulin signaling derangement and inflammation-related genes.Taken together, our results indicate that blocking insulin receptor signaling in the central nervous system can lead to trabecular meshwork and ciliary body dysfunction, intraocular pressure elevation, as well as inflammation, glial activation, and apoptosis in the retina and optic nerve.Given that central insulin resistance my lead to neurodegenerative phenotype in the visual system, targeting insulin signaling may hold promise for vision disorders involving the retina and optic nerve.
Key Words: brain; ciliary bodies; gene expression; inflammation; insulin receptor; insulin resistance; intraocular pressure; neurodegeneration; optic nerve;retina; retinal ganglion cells; trabecular meshwork
Introduction
Diabetes can play a major role in the progressive damage to the retina (Bao et al., 2020), yet its mechanisms remain under investigation.Although high blood glucose concentration is thought to be the underlying etiology for diabetic retinopathy, hyperglycemia accounts only for around 11% of variability in the risk of disease development (Bronson et al., 2003; Bao et al., 2020) indicating the possible involvement of other factors for the disease.Insulin resistance is a condition in which the cells of the body become less sensitive to the effects of insulin due to loss and/or insensitivity of insulin receptors (InRs).It is seen in both type 1 and type 2 diabetes (Bao et al., 2020), whereby IR cells of the body have built up a tolerance to insulin, making the hormone less effective.While peripheral insulin resistance can lead to hyperglycemia, insulin resistance without hyperglycemia has been reported along with retinal lesions that are characteristic of diabetic retinopathy (Bronson et al., 2003; Rajagopal et al., 2016; Bao et al., 2020), indicating that insulin sensitizers may offer therapeutic options to certain conditions in the eye without hyperglycemia.However, recent attempts to examine the effects of insulin signaling on the retina involve systemic administration of insulin, insulin agonists, or insulin sensitizers, which can lower blood glucose levels and cannot tease out the effects of blood glucose from those of insulin signaling networks in contributing to diabetes and other ocular diseases.There is an unmet need of a more specific model of insulin resistance on the retina independent of hyperglycemia in order to understand how such conditions can affect the eye.
Since the eyes are an extension of the brain with similarities in terms of embryology, histology, tissue organization, and cerebrospinal fluid circulation(Barishak, 1992; Cvekl and Tamm, 2004; Lamb et al., 2007; Langenberg etal., 2008; Faiq et al., 2014, 2016), it is plausible that insulin resistance in the central nervous system can involve pathological expressions in the optic nerve, retina, and other ocular structures (Galvis et al., 2016; Liu et al.,2017; Zarei et al., 2017; Bao et al., 2020).Apart from diabetes, metabolic and cognitive disorders such as Alzheimer’s disease may also involve central insulin resistance (Talbot, 2014; Arnold et al., 2018).Recent studies have used intracerebral streptozotocin injection to establish insulin failure in the brain (Grieb, 2016; Moreira-Silva et al., 2019).However, these studies have pertinent drawbacks including non-specificity of free radical damage by streptozotocin.To test the hypothesis that blocking insulin signaling in the central nervous system leads to neurodegenerative phenotype in ocular structures without remarkable alterations in blood glucose or serum insulin, it is, therefore, important to inhibit specifically the InRs in the central nervous system.To achieve this goal, this study used a specific InR blocker S961 to establish central insulin resistance in an experimental rat model.We evaluated its effects on the intraocular pressure, the integrity of anterior and posterior segments in the eye, and gene and protein expression in the retina and optic nerve.
Methods
Animals
Twenty-four healthy male Charles River Wistar rats with no previous experimental or drug exposure (5–6 months old, 200–250 g, procured,bred and single-housed at the animal facility of All India Institute of Medical Sciences, New Delhi, India) were randomly divided into two groups:experimental S961 (n
= 12) and sham control (n
= 12) using the sealed envelope method.All animals were housed under standard conditions of a 12-hour light-dark cycle, 24 ± 1°C temperature and 62 ± 5% humidity.The rats were provided with standard chow and waterad libitum
.All animals received surgery for cannula implantation into the lateral ventricle.One week later, six animals from the experimental group were randomly selected to receive intracerebroventricular injection of the S961 solution while another six animals from the sham control group received intracerebroventricular injection of the buffer solution.Afterin vivo
assessments for about 3 weeks, these animals were then sacrificed for histology at 24 days after intracerebroventricular injection.The other six animals in each group were sacrificed for tissue collections at baseline after cannula implantation but without S961 or buffer solution injection.The study was approved by the Institutional Animal Ethics Committee at All India Institute of Medical Sciences, New Delhi, India (approval No.794/IAEC/14, approval date: August 12, 2014) and the Institutional Animal Care and Use Committee at New York University Grossman School of Medicine (approval No.IA17-00370).All experiments were performed in accordance with the guidelines of the Association for Research in Vision and Ophthalmology (ARVO) for the Use of Animals in Ophthalmic and Vision Research.An overview of the experimental paradigm is depicted in Figure 1A.Surgery
Under anesthesia by intraperitoneal injection of sodium pentobarbital (25 mg/mL concentration, 40 mg/kg body weight), a 24 gauge, 15 mm long guide cannula with an indwelling stylet was stereotaxically implanted in either the left or right lateral ventricle chosen randomly through a burr hole in the skull at 0.5 mm posterior to the coronal suture, 2 mm lateral to the sagittal suture and 3 mm below the dura mater with reference to the De Groot atlas (Seyer et al., 2016; Figure 1B and C).The cannula was held in place by dental cement.All the surgical procedures were carried out following the 3R(replacement, reduction, and refinement) rule of aseptic technique (Ferry and Gervasoni, 2021).After a 7-day post-surgical recovery period, 1 mg/μL of S961 (CAS# 1083433, Sigma-Aldrich, St.Louis, MO, USA) solution or buffer solution (1× phosphate buffered saline) was injected at the rate of 1 μL/min over 80 minutes into the lateral ventricle of a subset of animals (experimental group:n
= 6; control group:n
= 6) twice at 7 days apart.Post-surgical care was performed by monitoring the animals for any complications, change in behavior or infections.No antibiotic prophylaxis was used in post-surgical care.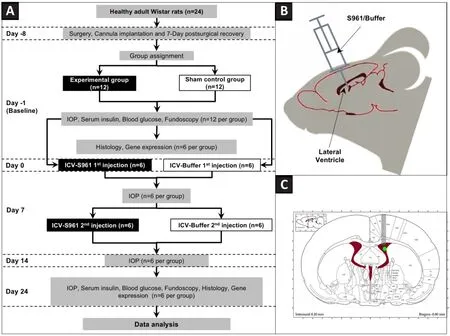
Figure 1|Overall experimental paradigm.
Blood glucose and serum insulin levels
Blood samples were collected by venipuncture at the tail base using 21–23 gauge needles at baseline and/or at 24 days for all living animals before sacrifice, and the serum was isolated and stored at –80°C until further use.Blood glucose levels were estimated using ACCU-CHEK Compact Plus (Roche Diagnostics, Kagaku Kenkyusho, Japan; sensitivity 81%, Kermani et al., 2017)calibrated for plasma glucose levels and the results were expressed as mg/dL.Serum insulin levels were quantified using AccuLite CLIA Microwells kit (Cat#2425-300, Monobind Inc.Lake Forest, CA, USA; sensitivity 0.182 μIU/mL) and the results were expressed as mU/L (Patel et al., 2016).
Tonometry
Intraocular pressure was assessed with TonoPen XL (Reichert Technologies, Inc, Depew, NY, USA) over 24 days at the same time of the day to avoid any diurnal variations.The intraocular pressure was recorded within the first 3 minutes after induction of anesthesia by inhaled isoflurane (Henry Schein Inc., Melville, NY, USA; 3%induction and 1–1.5% maintenance with a flow rate of 0.4–0.8 L/min)under 0.5% proparacaine topical eye drops.The average of five readings were taken for each eye at each time point, and the average value of both eyes was then obtained for each animal for comparisons over time and between groups.
Color fundus photography
Fundoscopy of the rat eyes was acquiredin vivo
after taking IOP measurements using the Micron III retinal imaging system (Phoenix Research Labs, Pleasanton, CA, USA) under anesthesia with 1–1.5% isoflurane with body temperature maintained at 37°C on a heating pad.The pupils were dilated with topical administration of tropicamide (IndiaMart, Delhi, India; 5 mg/mL), and the camera was adjusted to focus on the optic nerve head.We waited 8 hours after tropicamide exprosure and fundoscopy before sacrificing the animals for tissue harvest at baseline or 24 days.Tissue collection
After sacrificing the animals, the eyes and optic nerves were harvested.The tissues from one eye and both optic nerves were first fixed with solutions containing 2% formaldehyde and 2.5% glutaraldehyde at a 3:1 ratio.They then underwent paraffin embedding and cryotome/microtome sectioning in various planes (VT 1000 S, Leica, Wetzlar, Germany) at 5 μm thickness for histology (including H&E staining, retinal ganglion cell labeling and immunofluorescence) and at 1 μm thickness for electron microscopy.The prepared tissue sections were stored at 4°C until further analyses.Thetissues from the other eye were used for gene expression studies (including microarray and polymerase chain reaction analyses of the retina).
Hematoxylin and eosin staining of the retina
The prepared 5 μm-thick tissue sections were brought to room temperature and deparaffinized.The tissue sections were then stained with hematoxylin(Bio Lab Diagnostics, Mumbai, India) for 15 minutes and counterstained with 1% eosin (Bio Lab Diagnostics) for another 15 minutes.After dehydration by treating with ethanol at 50% concentrations for 2 minutes, 65% for 2 minutes,85% for 2 minutes, 90% for 2 minutes, 100% for 10 minutes, xylene: ethanol(1:1) for 6 minutes and xylene for 6 minutes, sections were observed at 400×magnification under a light microscope (Olympus BX51TF microscope with DP70 color camera, Olympus, Tokyo, Japan).The cell density of the retina was evaluated by counting the number of neuronal cells per 0.1 mmarea using the Cell Counter plugin of ImageJ v1.47 (Rasband, W.S., National Institutes of Health, Bethesda, MD, USA).
Retinal ganglion cell labeling
Retrograde labeling of the retinal ganglion cells was done by direct stereotaxic injection of biotinylated rhodamine-dextran (Cat# D7135, ThermoFisher Scientific, Waltham, MA, USA) (4 μL) by unilateral direct stereotaxic injection into the optic nerve (Nadal-Nicolas et al., 2015) followed by a 3-day wait.Visualization was done with epifluorescent illumination using a fluorescence microscope (Nikon eclipse Ti fluorescence microscope, Nikon, Tokyo, Japan).With the plane of focus in the ganglion cell layer, a 400 μm × 400 μm field of retinal ganglion cells were captured.The cells were illuminated using a 20×objective and with the partially closed epilluminator aperture.
Immunofluorescence of the trabecular meshwork, ciliary body, retina, and optic nerve
Slides prepared from tissue sections were brought to room temperature,deparaffinized, and rehydrated by treating with xylene for 6 minutes,xylene:ethanol (1:1) for another 6 minutes, ethanol at 100% concentrations for 2 minutes, 85% for 2 minutes, 65% for 2 minutes, 50% for 2 minutes and phosphate-buffered saline (PBS) twice for 5 minutes.The sections were then permeabilized with 0.1% Triton X-100 solution (Cat# 388858, Sigma)at 25°C for 10 minutes, washed with PBS twice for 5 minutes, blocked with 3–5% BSA (prepared with PBST; phosphate-buffered saline tween) for 45minutes at 37°C, and then incubated for 12 hours at 4°C with the primary antibody for InR (SC-711, rabbit polyclonal, Santa Cruz Biotechnology, Inc.RRID:AB_631835), aquaporin 4 (AQP4; a marker for water channel) (SC-20812, rabbit polyclonal, Santa Cruz Biotechnology, Inc, RRID: AB-2274338),tumor necrosis factor α (TNFα; a marker for inflammation) (SC-8301, rabbit polyclonal, Santa Cruz Biotechnology, Inc.RRID: AB_2303410), and optic atrophy protein 1 (OPA1; a marker for optic neuropathy) (NB110-55290,rabbit polyclonal, Novus Biologicals, RRID: AB-829789).After washing with PBS and PBST, sections were incubated for 1 hour at room temperature with the corresponding HRP-conjugated goat anti-rabbit IgG secondary antibody(SC-2004; Santa Cruz Biotechnology, Inc.RRID: AB-631746).The sections were then observed under a fluorescence microscope (Nikon eclipse Ti fluorescence microscope, Nikon).The relative expression was measured based on the fluorescence intensity using ImageJ v1.47 (National Institutes of Health, Bethesda, MD, USA; Schneider et al., 2012).
Electron microscopy of the trabecular meshwork and optic nerve
After harvesting the eyes, tissues were excised near the limbus at the trabecular meshwork and at the optic nerve head.They were then mounted on metal stubs, sputter-coated with 20 nm thick colloidal gold (CAS#7440-57-5, Sigma), and examined under a scanning electron microscope(Leo 435 VP system, Oberkochen, Germany) and a transmission electron microscope (Philips, Model CM 10, Eindhoven, the Netherlands).Using the secondary electron mode, direct three-dimensional images were captured at the magnification of 200×, 500×, 3000×, and 4000×.The pore size of the trabecular meshwork was estimated by thresholding and binarization using the ImageJ v1.47 software.Only the diameter of the pore but not the pore volume was assessed due to the lack of depth measurements along the z-axis.
Microarray analysis of the retina
RNA was isolated by homogenizing individual retinas in 1 mL Trizol (Ambion,Austin, Texas, USA) and 200 μL chloroform (Merck, Steinheim, Germany)followed by the collection of 500 μL aqueous phase and treatment with 500 μL of isopropanol (CAS# 67-63-0, Merck) (Wohlfart et al., 2014).RNA pellets were obtained by centrifugation at 16,000 ×g
, washed with 80%ethanol three times, and stored in 30 μL of diethyl pyrocarbonate (CAS#1609-47-8, Merck).Whole genome expression profiling was performed using arrays of RaGene-1_0-st-v1-type from Affymetrix (Santa Clara, CA, USA)(Okoniewski et al., 2007; Lee et al., 2009; Pohl et al., 2009).Biotinylated antisense cRNA was then prepared byin vitro
transcription reaction with BioArrayTMHighYieldTMRNA Transcript Labeling Kit (ENZO Life Science,Lausen, Switzerland, Cat# ENZ-42655; Boothroyd et al., 2007) followed by hybridization, dyeing with a fluidics station, scanning, and analysis using the Agilent Genespring 13.1.1 software (http://www.agilent.com/en/product/software-informatics/genomics-software-informatics/gene-exoression/genespring-gx).MetaCore analysis (https://portal.genego.com/) was employed to identify differentially expressed genes using unpaired t-tests and Benjamin Hochberg correction with a false discovery rate ofP
< 0.01.Network analysis was performed on selected genes with a fold change of >1.5 using the same MetaCore analysis software.Real-time polymerase chain reaction analysis of the retina
To further validate the results obtained from microarray analysis, quantitative analysis of gene expression after S961 or buffer injection was performed by the CFX96 Real Time System (Bio-Rad, Hercules, CA, USA) using SsoFastTMEvaGreenSupermix (Bio-Rad, Cat# 172-5200).Primers were designed using the Gene runner software 64-Bit version 6.5.52 (http://www.generunner.net/).Similar to the network analysis, the selected genes were determined based on a fold change cut-off of > 1.5 differentially expressed genes with unpaired t-tests and Benjamin Hochberg corrections with a false discovery rate ofP
< 0.05.Amplification reactions were performed in a 20 μL final volume containing 10 μL SsoFastTMEvaGreensupermix, 1 μL primer, and 4 μL cDNA.The quantitative reverse transcription-polymerase chain reaction conditions were as follows: incubation at 55°C for 20 minutes, followed by PCR cycling which included initial denaturation at 95°C for 3 minutes, followed by 35 cycles at 95°C for 15 seconds and 60°C for 48 seconds.Selected genes were amplified using the primer sets listed in Table 1.To normalize the amount of expressed mRNA, the internal housekeeping gene 36B4 was used and each cDNA product was tested in triplicate.The relative quantification of target genes was normalized to β-actin and expressed as ΔCt and fold change(2-ΔΔCt) using volcano plots in the gene expression and network analyses(Livak and Schmittgen, 2001).
Table 1 |Sequence of the primers used for real time polymerase chain reaction (PCR)of genes selected for validation after microarray expression analysis
Statistical analysis
Unless otherwise specified, statistical analyses were performed using twoway analysis of variance followed by Tukey’s honest significant differencepost hoc
test via STATA14 (JMP Statistical Discovery, Houston, TX, USA).Data are presented as the mean ± SEM.Results were considered statistically significant whenP
< 0.05.Results
Blood glucose and serum insulin levels
As shown in Figure 2, no hyperglycemia was observed in either experimental or control group at any time point (allP
> 0.05).No significant difference in the serum insulin level was observed between experimental and control groups,or between 24 days post-injection and baseline (allP
> 0.05).No significant baseline difference in blood glucose or serum insulin level was either observed in animals sacrificed at baselineversus
24 days (allP
> 0.05, data not shown).
Figure 2|Blood glucose and serum insulin levels.
Intraocular pressure and trabecular meshwork morphology
As shown in Figure 3A, two-way analysis of variance (ANOVA) of intraocular pressure revealed a statistically significant interaction between the effects of group and time (F
= 13.28,P
= 0.0017).Tukey’s honestly significant difference (HSD)post hoc
test indicated no significant change in intraocular pressure between groups at baseline or between baseline and 7 days after first intracerebroventricular injection in either group (allP
> 0.05).However,the experimental S961 group but not the buffer control group showed a significant increase in intraocular pressure at 14 (P
< 0.001) and 24 days(P
< 0.001) after the first intracerebroventricular injection, indicating that intraocular pressure elevation did not occur in the experimental group until 2 weeks post-injection and persisted through the end of the experimental period.No significant baseline intraocular pressure difference was observed between animals sacrificed at baseline and animals sacrificed at 24 days(allP
> 0.05).The trabecular meshwork showed narrowing of the pores and thickening of the beams in the experimental group at 24 days relative to the control group.These changes were accompanied by downregulation of AQP4 with no significant change in GFAP expression as shown in Figure 3B.
Figure 3|Changes in intraocular pressure and trabecular meshwork.
Morphological and immunohistochemical changes in the ciliary body,retina, and optic nerve
Histological examination of the retinal cross sections revealed loss of cells in the ganglion cell layer and dystrophic changes in the photoreceptor layer at 24 days after first intracerebroventricular S961 injection (Figure 4).The cell density of the retinal ganglion cell layer decreased significantly in the S961 group at 24 days with a mean difference of 1412 cells/mmcompared with baseline (P
< 0.001), and a mean difference of 1020 cells/mmbetween experimental and control groups at 24 days (P
< 0.001).An apparent increase in the size of nuclei was also observed in the S961 group, indicating apoptosis.No significant difference was observed in the average retinal ganglion cell density between experimental and control eyes at baseline (P
= 0.712).These retinal changes were accompanied by peripapillary atrophy identified as loss of reddish flush and ensuing pallor around the optic nerve head by color fundus photography (Figure 5).The effects of S961 on the expression of InR, GFAP, AQP4, TNFα, and OPA1 were also investigated in the eye and optic nerve (Figures 5–7).In the retina,there was a significant increase in GFAP expression across the retinal layers at 24 days after S961 injection when compared to baseline (P
< 0.001), while no significant change was observed in the control group between baseline and 24 days (Figure 4).The experimental S961 group also showed a significant decrease in InR expression in the retinal ganglion cell layer at 24 days (P
<0.001) but an opposite trend of increased InR expression in the photoreceptor layer (P
< 0.001; Figure 4).In the optic nerve, there was a significant increase in TNFα and OPA1 expression at 24 days after S961 injection compared with baseline (P
< 0.001), while no significant change was observed in the control group between baseline and 24 days (Figure 5B and C).In the ciliary bodies, a significant increase in AQP4 expression was observed in the experimental S961 group (P
< 0.001), but not the control group (P
>0.05) at 24 days after intracerebroventricular injection (Figure 6).In contrast,in the optic nerve, a significant decrease in AQP4 expression was observed in the experimental S961 group at 24 days (P
< 0.001; Figure 7).No significant difference in AQP4 expression was observed in the ciliary bodies or optic nerve of the control group between baseline and 24 days (allP
> 0.05).In the optic nerve, a significant decrease in InR expression was observed at 24 days in the experimental S961 group (P
< 0.001), but not the control group (P
>0.05) after intracerebroventricular injection.Relative to baseline, increased GFAP and TNFα expression in the optic nerve at 24 days (P
< 0.001) were also observed in the S961 group but not the control group (P
> 0.05).Gene expression changes in the retina
Microarray analysis of the experimental S961 group identified 112 genes that were differentially expressed in the retina compared with controls at 24 days after intracerebroventricular injection (Figure 8A).Among these genes, 47 were upregulated and 65 were downregulated significantly.We selected 14 genes involved in neurodegeneration, inflammation, and apoptosis from the list of the significantly dysregulated genes in the microarray analysis for real-time PCR.We observed an upregulation ofIL2
,IL4
,FGFR1
,GSK3a
, andGSK3b
by 1.98, 2.78, 1.53, 1.60, and 1.22 fold changes respectively, together with a downregulation ofIGF2
,MAPK15
,NFKB1A
,PI3K
,NRG1
,BCL2L11
,IGF1
,RARB
,andInR
by 2.35, 1.65, 2.39, 2.07, 2.05, 1.94, 1.55, 2.14, and 3.30 fold changes(allP
< 0.05) respectively (Figure 8B).Networks and pathways involved in the retina
MetaCore analysis of remarkably up/downregulated genes post-S961 injection revealed that the major canonical pathways altered could be mediated throughIL15
,NF-kB
,TREM2-ApoE
, andAkt-PI3K
, which played a role in apoptosis, immune response, microglial activation, andmTOR
regulation respectively (Figure 8C).Moreover, the remarkably up/downregulated genes post-S961 injection were enriched with functions related to selective glutamate receptor activity, cholinergic activity, protein complex assembly in synapse maturation, cell cycle regulation, and stimulus response.Further network analysis revealed that the upregulated genesNGFR
andBNP
interacted withNF-kbA1
throughPPAR-gamma
(Figure 8C).
Figure 4 | Immunohistochemical and cellular alterations in the retina.
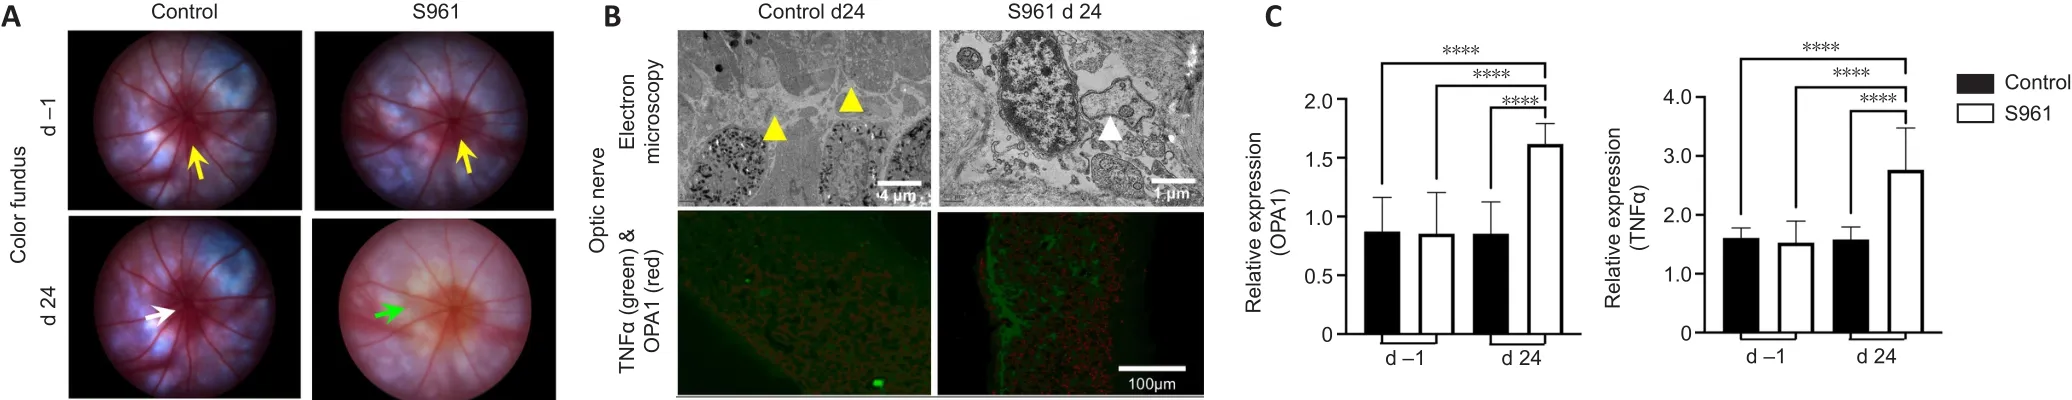
Figure 5| Color fundus photography and electron microscopy of the optic nerve.
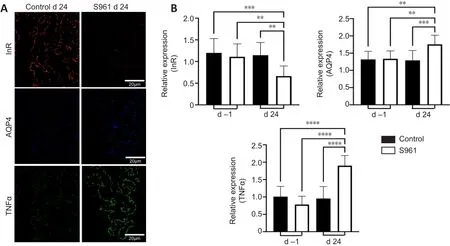
Figure 6| Immunohistochemical changes in the ciliary bodies.
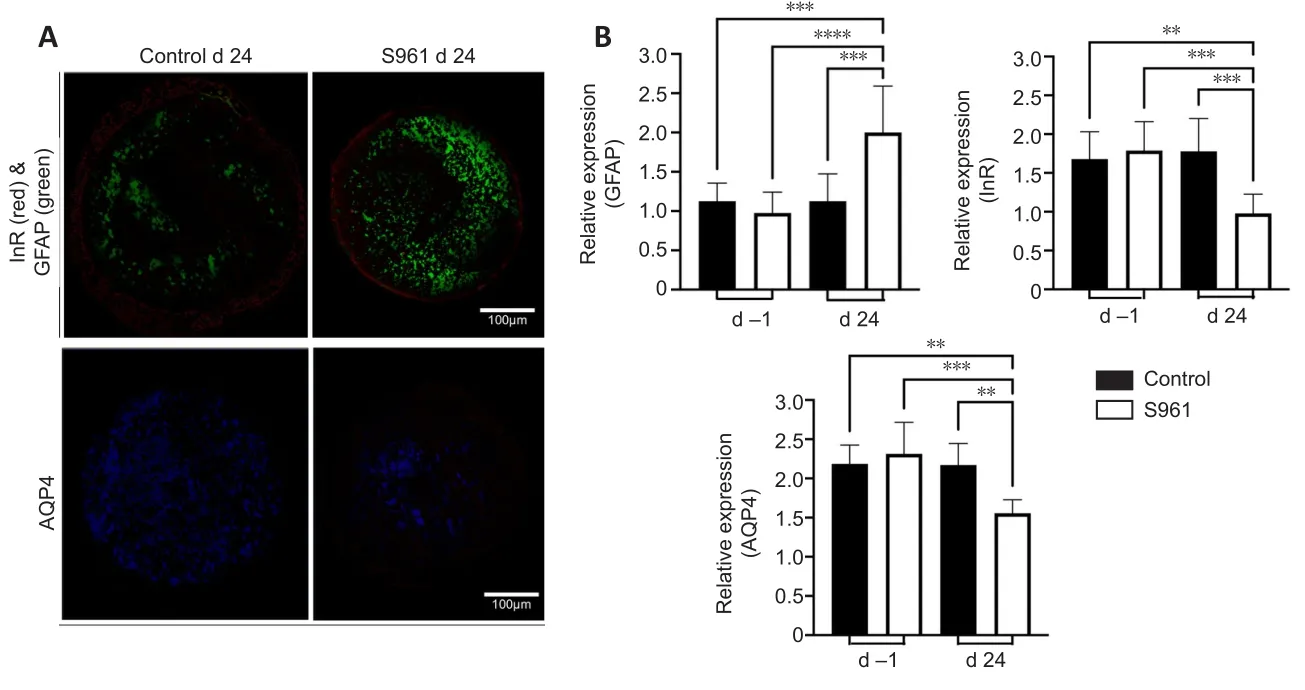
Figure 7| Immunohistochemical changes in the optic nerve.

Figure 8|Gene expression and network analyses.
Discussion
Around 16–47 percent of the world adult population has been estimated to have insulin resistance (Fahed et al., 2020).This condition predisposes to diabetes, neuropathy, nephropathy, dementia, and metabolic syndrome,and compromises the quality of life (Saboya et al., 2016).However, its role in the ocular tissues has largely been understudied.While the role of insulin resistance in neurodegenerative diseases is now being recognized,considering the eye and optic nerve as an extension of the brain, it is possible that central insulin resistance may be involved in the degenerative processes of the retina and optic nerve (Dada, 2017; Faiq and Dada, 2017; Agostinone et al., 2018; Al Hussein Al Awamlh et al., 2021).In this study, we report pathological changes in the anterior segment, retina, and optic nerve upon central insulin resistance by S961 in rodents.S961 is a peptide that binds specifically to InR.Here, intracerebroventricular S961 injection downregulated insulin signaling without systemic disturbance to insulin production or glucose utilization.This isolated insulin resistance in the central nervous system by S961 administration provided a novel animal model to understand its effects on the ocular structures and its subsequent neurodegenerative conditions related to vision, independent of overt diabetes or hyperglycemia.
Owing to the expression of InR in various ocular tissues (Naeser, 1997; Reiter and Gardner, 2003), insulin resistance has been implicated in ocular health(Cheung and Wong, 2007) including intraocular pressure elevation (Oh et al., 2005), optic nerve diseases (Roddy, 2020), glaucoma (Gasser et al.,1999), macular degeneration (Zhang et al., 2016), and diabetic retinopathy(Heidari, 2015).Nevertheless, there is no direct evidence for its causality(Faiq et al., 2014).Since dysfunction of the trabecular meshwork and ciliary body and the consequent disruption of the aqueous humor dynamics can result in intraocular pressure elevation and potentially glaucoma,our results of morphological changes in the trabecular meshwork and immunohistochemical changes in both the trabecular meshwork and ciliary body after S961 administration provide mechanistic insights into how insulin resistance may underpin the causality for intraocular pressure elevation and the consequent glaucomatous damages.Whether the intracerebroventricular injection procedures caused any change in intracranial pressure that led to intraocular pressure elevation is a question that remains to be answered(Ficarrotta and Passaglia, 2020).However, we expect the effects to be small if present, as sham buffer injection did not apparently elevate intraocular pressure at any time points.Our prior dynamic contrast-enhanced magnetic resonance imaging study indicated the entry of the low molecular weight gadolinium contrast agent into the anterior chamber within 30 minutes of intrathecal infusion into healthy adult mice (Faiq et al., 2021a).Given the low molecular weight of S961 at 4804 Da, it is possible that S961 directly reached and influenced the anterior segment of the eye by transporting from the cerebrospinal fluid space to the anterior chamber through the systemic route, whereby the components of peripheral blood enter as a ciliary filtrate into the posterior chamber forming the aqueous humor (Kiel et al., 2011; Ho et al., 2014).S961 might also be transported to the anterior segment through the less recognized subarachnoid trabeculae (Killer et al., 2003; Ohno-Matsui et al., 2011), which presumably connect the optic nerve subarachnoid space to the choroid or suprachoroidal space.The local subarachnoid trabeculae-mediated transport of S961 into the anterior chamber may explain the absence of hyperglycemia or serum insulin change in our experiments, whereas the peripheral blood mediated entry of S961 might play a less dominant role in the ocular changes given its dilution upon systemic circulation.The increase in AQP4 water channel expression in the ciliary bodies and the reduced porosity and AQP4 expression in the trabecular meshwork of the experimental S961 group likely implied increased aqueous inflow and decreased aqueous outflow, respectively (Zhang et al., 2002;Verkman, 2003), that could explain the increase in intraocular pressure after S961 administration.
AQP4 expression can also be found in the rodent optic nerves (Mathieu et al.,2017, 2018; Kimball et al., 2021), while chronic intraocular pressure elevation may not only accompany with altered AQP4 expression (Dibas et al., 2008),but also reduced cerebrospinal fluid entry into the optic nerve (Mathieu et al., 2018; Faiq et al., 2021b).In addition, knocking out AQP4 may reduce amyloid clearance from the optic nerve (Wang et al., 2020).Insulin resistance has been associated with amyloidopathy (Rad et al., 2018), tauopathy (Mullins et al., 2017), glutamate excitotoxicity (Datusalia et al., 2018), inflammation,and neuronal apoptosis in Alzheimer’s disease, glaucoma, and maculopathy(Wostyn et al., 2010; Faiq et al., 2014; Ermilov and Nesterova, 2016; Regland and McCaddon, 2019).However, the underlying mechanisms remain unclear.Our current results of the AQP4 decrease, elevation of the inflammatory marker TNFα, and glial activation from GFAP upregulation in the optic nerve after S961 administration suggested a detrimental role of central insulin resistance in the glymphatic brain waste clearance system, which removes toxic metabolites including amyloid via cerebrospinal fluid-interstitial fluid exchange and AQP4 channels in the glia (Iliff et al., 2012; Kasi et al., 2022).Changes in gene expression involved in insulin signaling, inflammatory markers, and neurodegenerative phenotypes indicate that central insulin resistance may be a cardinal feature of degenerative diseases of vision.Together with the retinal vascular dysregulation, retinal ganglion cell loss,and mitochondrial damage from OPA1 elevation in the optic nerve of the experimental S961 group, our results suggest the need to examine if central insulin resistance may be commonly involved in the upstream mechanisms across different retinopathies, optic neuropathies and other conditions involving vision.
With evidence from physiological, biochemical, molecular, genetic, and histological dimensions, this study supports the role of central insulin resistance in the pathological processes that afflict the visual system.There are, however, important questions that remain to be addressed, such as the gender effects on the severity of insulin resistance given the different body compositions and adipose tissue distributions (Geer and Shen, 2009).It is worth noting that difference between sexes exists in Alzheimer’s disease(Mielke, 2018) while there is a reported spike in the incidence of glaucoma in postmenopausal women (Dewundara et al., 2016).On the other hand,rodents do not have lamina cribrosa and their AQP4 expression in the optic nerve is different from that of humans (Kimball et al., 2021).Thus, cautions are warranted in the context of direct clinical translations of the current results.Apart from intracerebroventricular injection, direct injection of S961 into the eye via intracameral, intravitreal, subretinal or suprachoroidal route could provide additional insights towards understanding the mechanisms of insulin resistance in ocular health and disease.Longitudinal ocular and brain imaging (e.g.optical coherence tomography and magnetic resonance imaging) and behavioral assessments (e.g.optokinetic and optomotor response measurements) could add mechanistic insights into the central insulin resistance-related changes within and beyond the visual system overtime (Yang et al., 2018; van der Merwe et al., 2021; Zhu et al., 2021).Future studies may also consider alternative animal models such as the neuronal InR knockout (NIRKO) mice (Schubert et al., 2004) to determine more specific mechanisms of ocular and vision-related alterations in the absence of InR.
To conclude, our study indicates that insulin resistance in the central nervous system can exist independent of systemic insulin resistance or overt diabetes.We also provide evidence that central insulin resistance may play a role in aqueous humor dynamics, intraocular pressure elevation, inflammation,vascular dysregulation, mitochondrial dysfunction, and retinal and optic nerve damages.Since insulin resistance is on rise and a significant percentage of the world population is suffering from this condition, it becomes important to determine its impact on neurodegenerative conditions through genetic and biochemical pathways.Taken together, our results suggested central insulin resistance a possible underlying condition for diseases of vision and urge the need to explore novel insulin-based treatment options, given the initial evidence that insulin plays an anti-inflammatory role in the central nervous system (Ferreira et al., 2014; Rodriguez-Casado et al., 2017) with intrinsic capacity to regenerate dendrites and synapses after injury (Agostinone et al., 2018).The role of neuroprotective agents, insulin sensitizing agents,and ocular hypotensives in isolation or combination could be considered for additional therapeutic advantage to relevant disorders of the visual system(Downs et al., 2022; Sanchez-Cruz et al., 2022; Wareham et al., 2022).Future studies may also determine if other novel therapeutics such as mindfulness meditation may alleviate insulin resistance along with other major risk factors in neurodegenerative diseases of the visual system including glaucoma (Dada et al., 2018; Sabel et al., 2018).
Acknowledgments:
We would like to thank Dr.Lauge Schäffer of Novo Nordisk for providing S961.We also thank Prof.Hruda Nanda Mallick and Dr.Javed Ahsan Quadri of All India Institute of Medical Sciences (AIIMS), New Delhi for technical support.
Author contributions:
Study design and implementation: MAF, TS, MN, TV,TD, KCC; data analysis and interpretation: MAF, TS, MN, DS, RD, TD, KCC;manuscript writing: MAF, TS, MN, TD, KCC.All authors read and approved the final manuscript.
Conflicts of interest:
None declared.Editor note: KCC is an Editorial Board member of Neural Regeneration Research.He was blinded from reviewing or making decisions on the manuscript.The article was subject to the journal’s standard procedures, with peer review handled independently of this Editorial Board member and their research groups.
Open access statement:
This is an open access journal, and articles are distributed under the terms of the Creative Commons AttributionNonCommercial-ShareAlike 4.0 License, which allows others to remix, tweak, and build upon the work non-commercially, as long as appropriate credit is given and the new creations are licensed under the identical terms.
- 中国神经再生研究(英文版)的其它文章
- Patient-specific monocyte-derived microglia as a screening tool for neurodegenerative diseases
- Molecular hallmarks of long non-coding RNAs in aging and its significant effect on aging-associated diseases
- Inflammation in diabetic retinopathy: possible roles in pathogenesis and potential implications for therapy
- Targeting the nitric oxide/cGMP signaling pathway to treat chronic pain
- Neurosteroids as stress modulators and neurotherapeutics: lessons from the retina
- Myelinosome organelles in pathological retinas:ubiquitous presence and dual role in ocular proteostasis maintenance