
Experimental investigation of typical surface treatment effect on velocity fluctuations in turbulent flow around an airfoil
2023-11-10 02:15BkELHAMIMojtDEHGHANMANSHADIAliAkrDEHGHAN
CHINESE JOURNAL OF AERONAUTICS 2023年10期
Bk ELHAMI,Mojt DEHGHAN MANSHADI,*,Ali Akr DEHGHAN
a Faculty of Mechanical Engineering, Malek Ashtar University of Technology, Isfahan 177415875, Iran
b Mechanical Engineering Faculty, Yazd University, Yazd 8915818411, Iran
KEYWORDS
Abstract Noise reduction of different airfoils is important because these sections are used in wind turbines,propellers,and aircraft wings.Several methods are used for passive noise reduction of sections.One of these methods is the use of surface treatment.In this research,the effect of the typical surface treatment element (finlets) on the vortex structure at different frequencies in the turbulent flow created on the NACA2412 section is investigated.For this purpose,one-dimensional hot wire probe is used.The used surface treatment in this research has a special geometry and the distance between two consecutive finlets is 6 mm (S=6 mm).This study shows that this surface treatment element can be used for noise reduction in high frequencies.Another result of this research is the suggestion of the most suitable position to install this special surface treatment element to reduce vortex energy in all frequency ranges.This installation location is determined based on a dimensionless parameter (Xaft/h).
1.Introduction
In the past decades,a lot of studies on trailing edge noise have been done in analytical,numerical,and experimental research.This is due to the importance of trailing edge noise in a wide range of applications, such as aircraft, submarines, wind turbines, fans, etc.Oerlemans et al.conducted noise reduction research on a standard blade, a blade with trailing edge serrations,and a blade with an optimized airfoil shape used in wind turbines.1Both modified blades show a significant trailing edge noise reduction at low frequencies but the serrated blade showed more noise reduction.On the average, overall noise reduction of 3.2 dB is observed for the serrated blade.
The reason for the wide frequency range of the trailing edge noise of the turbulent boundary layer is the presence of vortices with different sizes in this area.When the vortices create in the turbulent boundary layer near the trailing edge,pressure fluctuations in different frequency spectra occur due to the different sizes of the vortices, which causes the production of acoustic waves in the wide frequency spectrum.The physical process of creating trailing edge noise in a turbulent boundary layer was explained by Roger and Moreau.2They derived a correction and further extensions of Amit’s trailing edge noise model.
As mentioned, the transient pressure field in the turbulent boundary layer near the trailing edge is one of the main causes of airfoil noise.Studies in 2008 showed that a part of the aircraft noise during the landing process was due to the intensity of pressure fluctuations in the turbulent boundary layer near the trailing edge of the wings and flaps.These studies were done by Brouwer and Rienstra.3Knowing the relationship between the velocity field of the turbulent boundary layer and the transient pressure field,and especially the relationship between the strength of the vortices and the pressure gradient on a wall is very important for controlling the flow.Andreopoulos and Agui did this research in 1996.4They used four high-frequency response pressure transducers in their research.Tsuji et al.measured pressure fluctuations in the turbulent boundary layer with a new technique in 2007.5In this technique,mean and pressure fluctuation and stream-wise velocity near the wall have been measured simultaneously in the turbulent boundary layer.In 2012, Ghaemi et al.conducted a transient three-dimensional velocity field measurement by employing a laser graphic imaging method in order to obtain the pressure field in the turbulent boundary layer.6In this experiment, the pressure field near the wall was also measured by capacitive microphones.The comparison showed agreement between the two pressure signals obtained from the tomo-PIV and the microphones with a cross correlation coefficient of 0.6 while their PSDs overlap up to 3 kHz.In 2013,Ghaemi and Scarano repeated the experiment on a flat plate with a new laser imaging technique.7The accuracy of experiments based on velocity field measurement within the turbulent boundary layer is more than pressure field measurement.Its reason is the lack of robust pressure measurement techniques in this area.They investigated the positive and negative high amplitude pressure peaks in a turbulent boundary layer.This research showed the positive high amplitude pressure peaks to the shear layer structures formed by an upstream sweep of high speed flow opposing a downstream ejection event.The hairpin category of vortices causes the ejection of near wall formation.It initiates the sweep event in the outer layer.The negative high amplitude pressure peaks are linked to both the span-wise and quasi-stream-wise vortices.
With the growth of the aviation industry in the early 1990 s and the development of wind turbines, research on the use of passive noise reduction methods increased.These methods include airfoil trailing edge serrations,8–11trailing edge brushes,12,13porous trailing edge,14–16airfoil shape optimization,17equipping the surface with a 3D surface treatment element18–26and installing a vortex generator.
Gstrein et al.investigated the effect of surface treatment with typical finlet spacing (4 mm) on a flat plate in 2020.20In this research, the Reynolds number was about 9.9 × 10⁵near the trailing edge and the angle of attack was 0°.They suggested the best installing position of this surface treatment for reducing overall pressure PSD near the trailing edge.In 2021,Gstrein et al.investigated the effect of biologically inspired finlets on the reduction of trailing edge noise of a NACA0012 airfoil at Reynolds number of 400000.21They observed noise reduction of about 6 dB in the frequency range from 1000 Hz to 4000 Hz.In 2022, Fiscalleti et al.investigated the effect of stream-wise fences with different spacing on far-field noise experimentally.22When increasing the spacing between the fences from 2 mm to 4 mm, they observed a lower noise reduction at high frequencies and a higher noise reduction at low frequencies.Afshari et al.investigated the effect of the novel three-dimensional surface treatments on trailing edge noise reduction in 2019.26They showed that their aeroacoustic performance is better than the standard two-dimensional surface treatments.
In the present study,the effect of the surface treatment with S=6 mm(finlet spacing)on velocity fluctuations in turbulent boundary layer is investigated.The effect of noise manipulation with the surface treatment with S = 6 mm has received less attention in previous researches.This element is installed slightly upstream of the trailing edge of the airfoil NACA2412 section so that the velocity field downstream of the finlets can be analyzed.Velocity fluctuations in turbulent boundary layer are measured by a hot wire sensor.In previous researches, it has been shown that if the surface treatment element is installed at the end of the trailing edge, the noise at high frequencies can be reduced; however, it will be shown that it is possible to find a mounting location on the airfoil that reduces the energy of the vortices in all frequency ranges near the trailing edge.Obviously, this mounting location depends on the characteristics of the surface treatment element, especially S(finlet spacing) and free stream conditions.
2.Experimental equipment
The tests were performed in a closed-circuit wind tunnel with an opened test section (Fig.1).The test section is a cylinder whose diameter is about 500 mm.Data acquisition in the velocity field was done by a one-dimensional hot wire sensor.In this sensor, a tungsten wire with a diameter of 5 μm and a length of 1.25 mm is used.
The used model in the experiments is the NACA2412 section(Fig.2).Its chord is 430 mm and its span is 150 mm.Both sides of the model are confined by flat surfaces made of Plexiglas for preventing vortex shading (Fig.3).
3.Test conditions
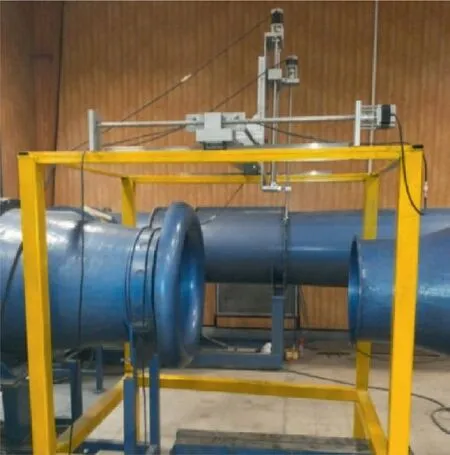
Fig.1 Photo of wind tunnel.
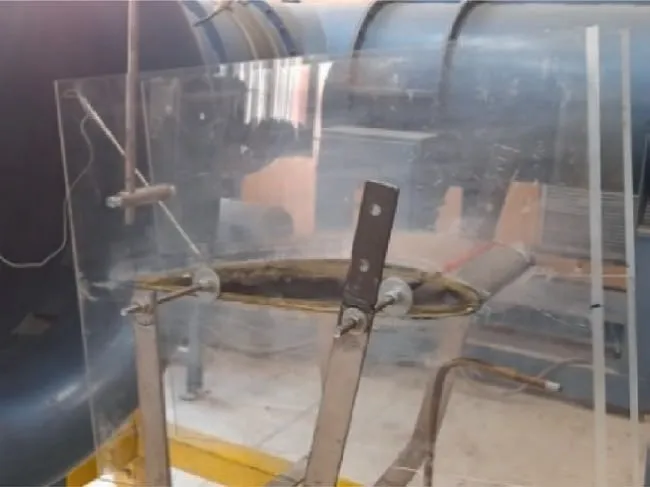
Fig.2 Model of NACA2412 section installed in test section of wind tunnel.

Fig.3 Top view of model and installed trip and their dimensions.
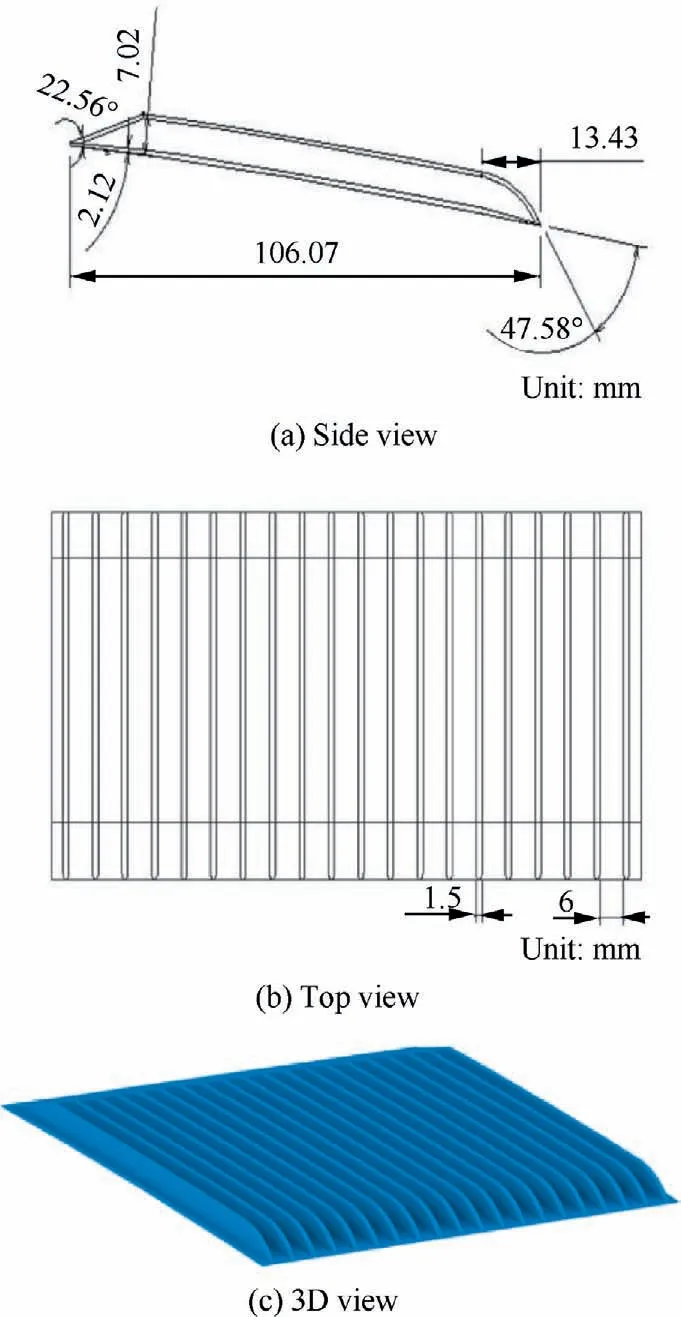
Fig.4 Views and dimensions of used surface treatment element.
In all the tests, the free stream velocity in the test section is 30 m/s.Based on the free stream velocity and the model’s chord, the Reynolds number near the trailing edge is about 850000.The experiments were performed at three angles of attack(0°,4°,and 8°).At the highest angle of attack,the tunnel blockage ratio is less than 2%.At all angles of attack,the section was tested both without the surface treatment element and with its presence, so that the results could be compared.The hot wire anemometry was calibrated before each test.The frequency of data acquisition by the hot wire anemometry was 20 kHz and the data acquisition duration was 10 s.Therefore,200,000 data were saved at each point.The cutting frequency in most experiments was about 17 kHz.The maximum free stream Mach number was about 0.09 based on the lowest temperature of the test conditions.Therefore, the flow in the test section was incompressible.The surface treatment element must be used in the incompressible flow regime.A trip was installed near the leading edge of the airfoil (0.05C–0.1C) to ensure turbulent flow creation.The height of the used trip is 1 mm and its length is 6 mm.The end of the trip is located at 0.1C.
4.Surface treatment geometry and its installation location
The views of the used surface treatment element in this experiment are shown in Fig.4.In Fig.4, the dimensions of the designed element are specified.The length of this element in the x direction is 106.07 mm, and the height of each finlet is 7.02 mm.The total width of the surface treatment element is 150 mm.The distance between two consecutive finlets (finlet spacing) is 6 mm (S = 6 mm).The thickness of each finlet is 1.5 mm.The bottom of the constructed element has a slight curvature, which is determined by the installation location of the surface treatment on the NACA2412 section.
The installation location of the surface treatment on the NACA2412 section is shown as follows.The beginning of the surface treatment element is located at x = 249 mm(x/C = 0.579) and the end of it is located at x = 355.07 mm (x/C = 0.826).The reason for installing the surface treatment element in this location is that the downstream area of the finlets can be investigated by a hot wire sensor.
5.Data acquisition points
Fig.5 shows the top view of the data acquisition point’s location which is near the wall in the z-direction(about 0.05 mm).The distance between two consecutive points in width is 1 mm.Points 0, 7, 14, 15, 16, 17, 28, and 34 are along the middle of two consecutive finlets, and Points 3,4,10,11,20,21,37,and 38 are located along behind the finlet approximately.Meanwhile, from 3 mm after the surface treatment element, exactly from the middle of two consecutive finlets,data were acquired in each 0.5 mm in the z-direction (perpendicular to the flow).
6.Velocity field investigation
At first, it should be noted that all experiments were repeated three times at different ambient temperatures and the obtained results were identical approximately.
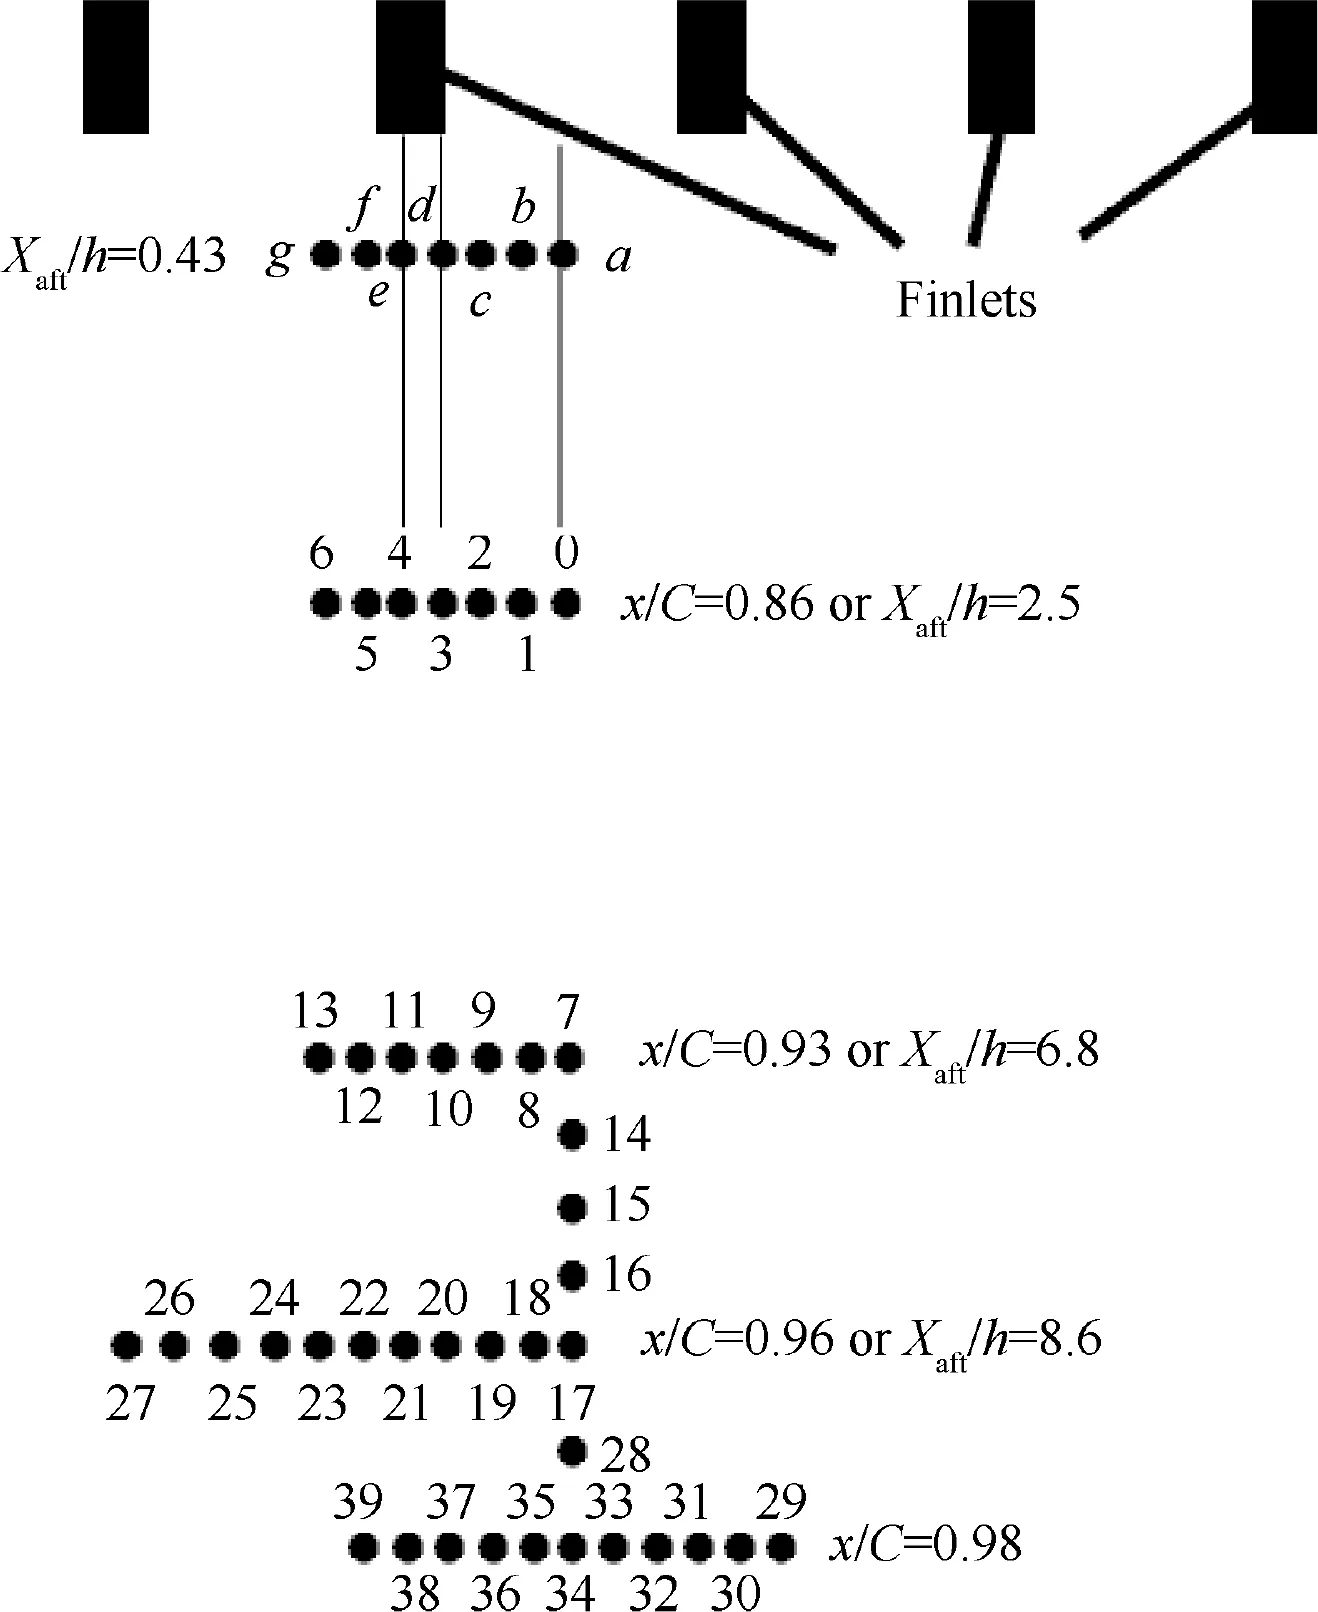
Fig.5 Top view of data acquisition points downstream of surface treatment element.
Meanwhile,at Point 0(at x=37 cm or x/C=0.86),without the presence of the surface treatment element, the boundary layer thickness was measured at α = 0° and its value was about 18 mm.Considering that the height of the surface treatment element is 7.02 mm,after installing on its location on the NACA2412 section, it stayed on turbulent flow in all the angles of attack completely (as mentioned in the previous sections, a trip is used about 0.05C-0.1C for turbulent flow creation).Meanwhile, the Reynolds number is about 730300 at this Point 0.
The velocity profiles were compared at three different points,with and without the presence of the surface treatment element.Meanwhile,these were compared to the results of the experiment that was done by Afshari et al.27They investigated the effect of two surface treatment elements in the turbulent flow installed on the flat plate at α=0°.In one of the surface treatment elements used by them,the distance between the two consecutive finlets is 2 mm(S=2 mm),and in the other 8 mm(S = 8 mm).Velocity profile diagrams have been dimensionless to allow comparison between the results of the presented study and Afshari et al.In these diagrams, obtained mean velocity profiles are validated by the 1/7 power law turbulent boundary layer profile in the absence of the surface treatment element.The small difference between the mean velocity and 1/7 power law profiles shows that the turbulent boundary layer has occurred at Xaft/h=2.5,Xaft/h=6.8,and Xaft/h=8.6.In these diagrams,Xaftis the distance from the end of the surface treatment element to the data acquisition points in the xdirection (stream-wise) and h is the height of the finlets.According to Fig.6, the smallest S creates the lowest momentum after the surface treatment element near the wall.In this case, there is a possibility of flow separation.It was reported by Afshari et al.27The momentum reduction by S = 6 mm is between S = 2 mm and S = 8 mm.It shows that the aerodynamic behavior of the surface treatment elements depends on their characteristics, especially S (finlet spacing).However,Afshari et al.showed that by changing the finlet spacing, the aeroacoustic behavior of the surface treatment element also changes.
In this research, the energy of vortices in different frequencies at data acquisition points has also been investigated.For this purpose, the velocity Power Spectral Density (PSD)parameter has been measured at different points.To obtain the velocity PSD,first,velocity fluctuations relative to the time that are acquired by the hot wire sensor must transmit to the frequency domain.It is done by the Fourier transform.
where U(ω,T) is the Fourier transform of u′(t).Then, velocity PSD can be calculated by28
In the above relation,U*(ω,T)is a complex conjugation of U(ω,T) and E is the expected value that is a discrete random variable.To compare the energy of vortices in different frequencies, the following equation has been used in both cases,with and without the surface treatment element.In other words, ΔLØ(f-C)is the logarithmic velocity PSD difference between the cases with and without the surface treatment element at one point.
To amplify the above value, it is multiplied by 10.The above relation is a logarithmic velocity PSD difference.In this research, this equation is used to compare the energy of vortices at different frequencies in turbulent flow when the surface treatment element presents to that when it absents.
Fig.7 shows the energy of vortices at different frequencies with the presence of surface treatment relative to that without it, at Points a, b, c, d, e, f, and g which are located at Xaft/h=0.43 and three angles of attack(0°,4°,and 8°).This figure indicates that the energy of high-frequency small vortices reduces by the surface treatment.But at α=0°,4°,the surface treatment increases the energy of vortices at low and intermediate frequencies,exactly after it(between two consecutive finlets).The reason for this phenomenon is presented in the next section.At these angles of attack,when points are close to the wall of the finlet, the energy of low-frequency large vortices increases strongly because the turbulent boundary layer of the finlet interacts downstream of its flow.At α = 8°, lowfrequency large vortex energy reduces.The energy of vortices in all frequency ranges is reduced at points located behind the finlet at all angles of attack because this area is a lowenergy region.A phenomenon happens similar to cavitation behind the finlet.
Fig.8 shows the energy of vortices at different frequencies with the presence of surface treatment relative to that without it, at Points 0, 1, 2, 3, 4, 5, and 6 which are located at x/C = 0.86 or Xaft/h = 2.5.This figure is drawn at three angles of attack (0°, 4°, and 8°).This figure indicates that the surface treatment with S = 6 mm has reduced the energy of highfrequency small vortices.This reduces the intensity of highfrequency pressure fluctuations near the wall and also decreases the Sound Pressure Level (SPL) in far-field at high frequencies.Of course,at these points,the energy of large vortices with low frequency is almost under control and has not changed much.Meanwhile, the surface treatment with S = 6 mm reduces the vortex energy at intermediate frequencies approximately.The cause of these phenomena is presented in the next section.Generally, at Xaft/h = 2.5, the energy of vortices is decreased at high and intermediate frequencies by the surface treatment element with S = 6 mm and is almost controlled at low frequencies.

Fig.6 Velocity profiles at α = 0° and different Xaft/h.
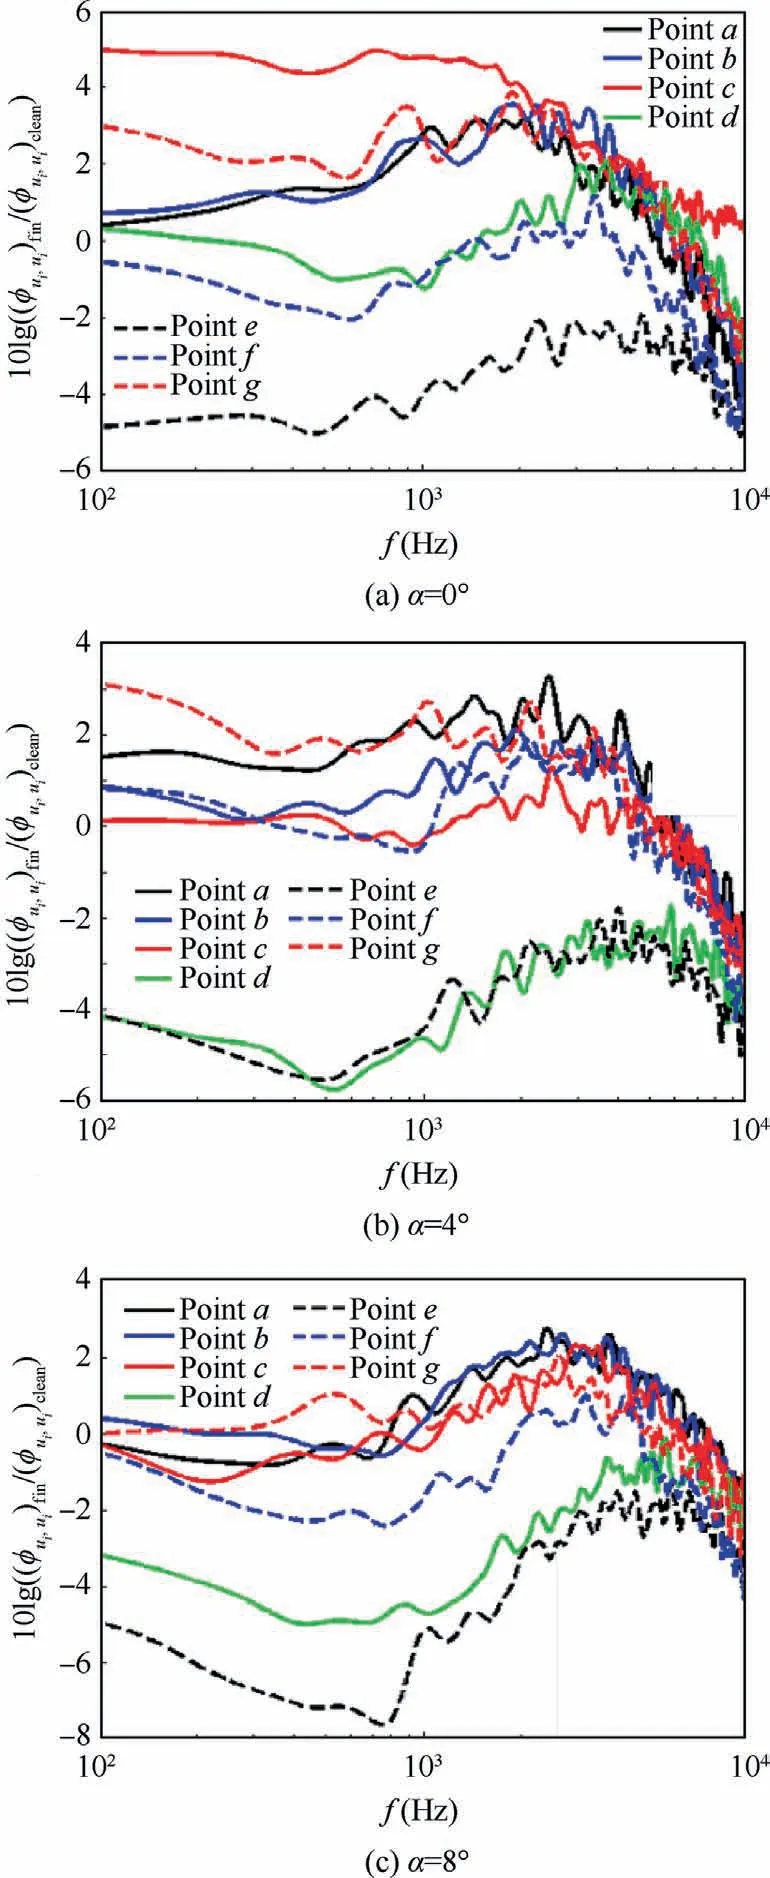
Fig.7 10 × ΔLØ(f-C) at Points a, b, c, d, e, f and g at Xaft/h = 0.43.
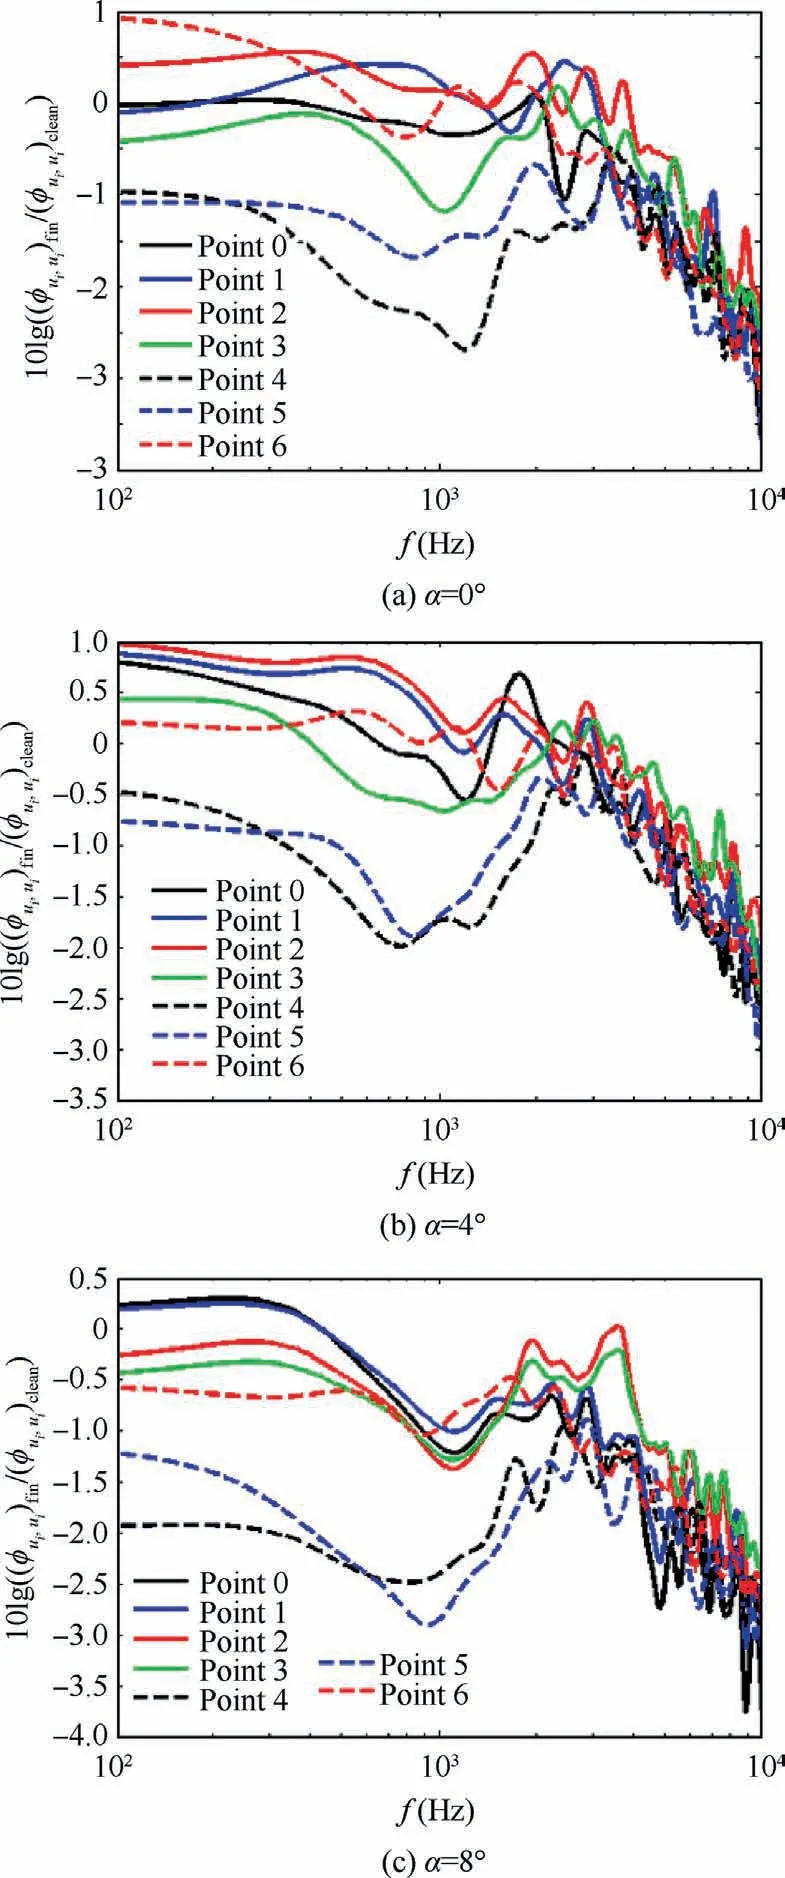
Fig.8 10 × ΔLØ(f-C) at Points 0, 1, 2, 3, 4, 5 and 6 at Xaft/h = 2.5.
Fig.9 (Xaft/h = 6.8), Fig.10 (Xaft/h = 8.6), and Fig.11(Xaft/h=10.11)show that the energy of the vortices is increased at low and intermediate frequencies by the surface treatment element relative to points that are located at Xaft/h=2.5.The cause of this phenomenon is presented in the next section.Of course,in all of these diagrams, the reduction of high-frequency vortex energy can be seen at all angles of attack.Of course, there are exceptions at some points.At Xaft/h = 6.8 and α = 0°, Points 11 and 12 (these points are along behind the finlet approximately),at Xaft/h=6.8 and α=0°,Points 20 and 21(these points are along behind the finlet approximately),at Xaft/h=10.11 and α=0°,Points 33 and 34(these points are along the middle of two consecutive finlets),the energy of vortices does not change and remains constant at low and intermediate frequencies near the wall compared to the state that there is no surface treatment element approximately.

Fig.9 10 × ΔLØ(f-C) at Points 7, 8, 9, 10, 11, 12 and 13 at Xaft/h = 6.8.
Fig.12 shows the energy of vortices at different frequencies near the wall, with the presence of the surface treatment element, relative to its absence, at points that are along the middle of two consecutive finlets.These graphs are also drawn at three angles of attack (0°, 4°, and 8°).Figs.13 and 14 show the energy of vortices at different frequencies near the wall, with the presence of the surface treatment element, relative to its absence, at points that are along behind the finlet approximately.In Figs.12–14, it is observed that the lowest energy of vortices in all frequency ranges occurs at Xaft/h = 2.5 by the surface treatment element with S = 6 mm.
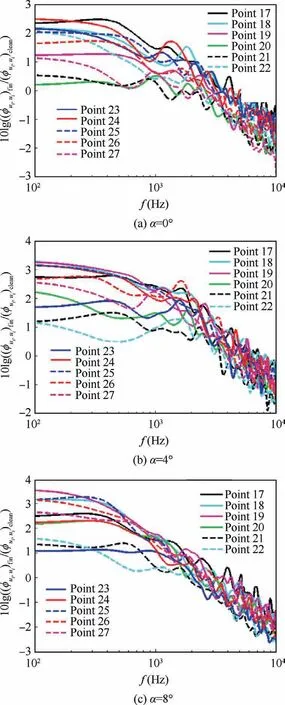
Fig.10 10×ΔLØ(f-C)at Points 17,18,19,20,21,22,23,24,25,26 and 27 at Xaft/h = 8.6.
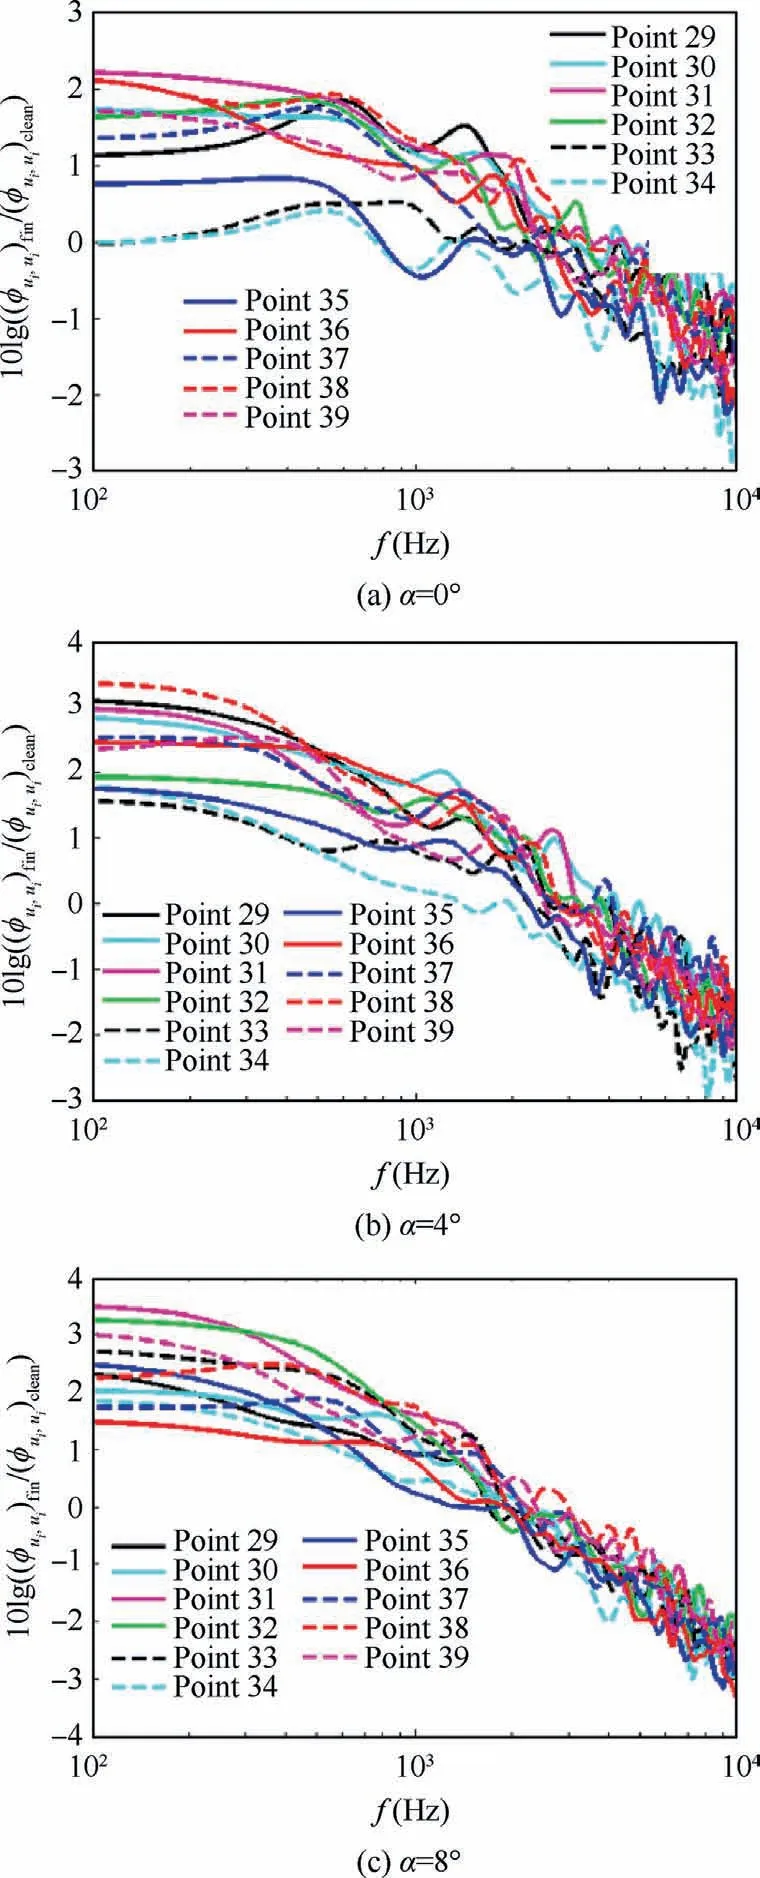
Fig.11 10×ΔLØ(f-C)at Points 29,30,31,32,33,34,35,36,37,38 and 39 at Xaft/h = 10.11.
The following equation has been used to better determine which points have the least vortex energy in all frequency ranges with the presence of the surface treatment element with S=6 mm.ΔLØfin(P2-P1)compares the energy of the vortices in all frequency spectra between two points, while the surface treatment element is the installation.To amplify the bellow value, it is multiplied by 10 in figures.
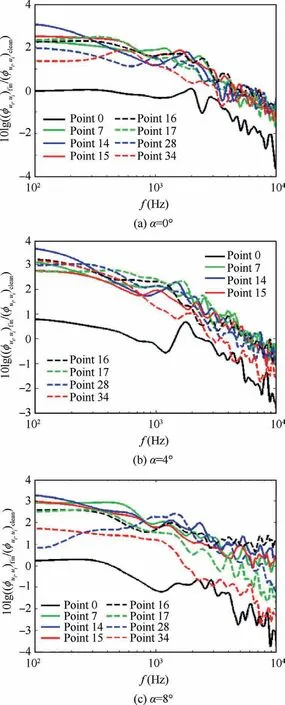
Fig.12 10 × ΔLØ(f-C) at points along the middle of two consecutive finlets.
Fig.15 compares the energy of vortices, at different frequencies, of points located at Xaft/h = 2.5 to that of points at Xaft/h = 0.43.This figure shows that the energy of vortices in all frequency spectra is reduced by the surface treatment with S = 6 mm at Xaft/h = 2.5 relative to Xaft/h = 0.43 approximately.Of course, some exceptions are seen.Since the cavitation occurs behind the finlet approximately,this area is a low-energy region.This causes the vortex energy of some points at Xaft/h = 2.5 to be more than that of the points located behind the finlet.This is shown in Fig.15, with black dashed and green plots.Fig.16 also compares the energy of vortices, at different frequencies, of points located at Xaft/h = 6.8 to that of points at Xaft/h = 2.5.These comparisons are done at three angles of attack(0°,4°,and 8°).In this figure,it is seen clearly that the surface treatment with S = 6 mm increases the energy of vortices in all frequency ranges at Xaft/h = 6.8 relative to points located at Xaft/h = 2.5.Therefore, the least vortex energy in all frequency spectra happens close to points located at Xaft/h = 2.5 clearly.
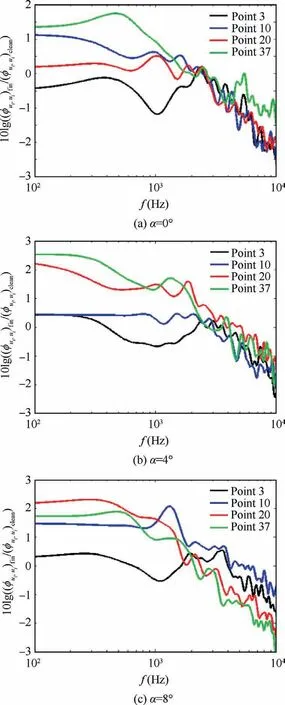
Fig.13 10 × ΔLØ(f-C) at some points along behind finlets at Points 3, 10, 20, 37.
Based on the above, it can be concluded that in order to reduce velocity and pressure PSD in all frequency spectra near the wall, the surface treatment with S = 6 mm should be moved slightly towards the leading edge relative to the end of the trailing edge.This displacement is about a dimensionless distance of Xaft/h = 2.5.Gstrein et al.also reported the accuracy of this information for the surface treatment with S = 4 mm.20Their research was done on a flat plate at α=0°.In this research,the Reynolds number near the trailing edge was about 9.9 × 10⁵.Some results of this research are illustrated in Fig.17.In Fig.17, L, LF, and PFare flat plate length, finlet length, and finlet position, respectively.Gstrein et al.showed that the least overall pressure PSD (in all frequency ranges) occurs at PF= 0.835L by the surface treatment with S = 4 mm.Overall pressure PSD was measured by a microphone installed at x/L = 0.996.
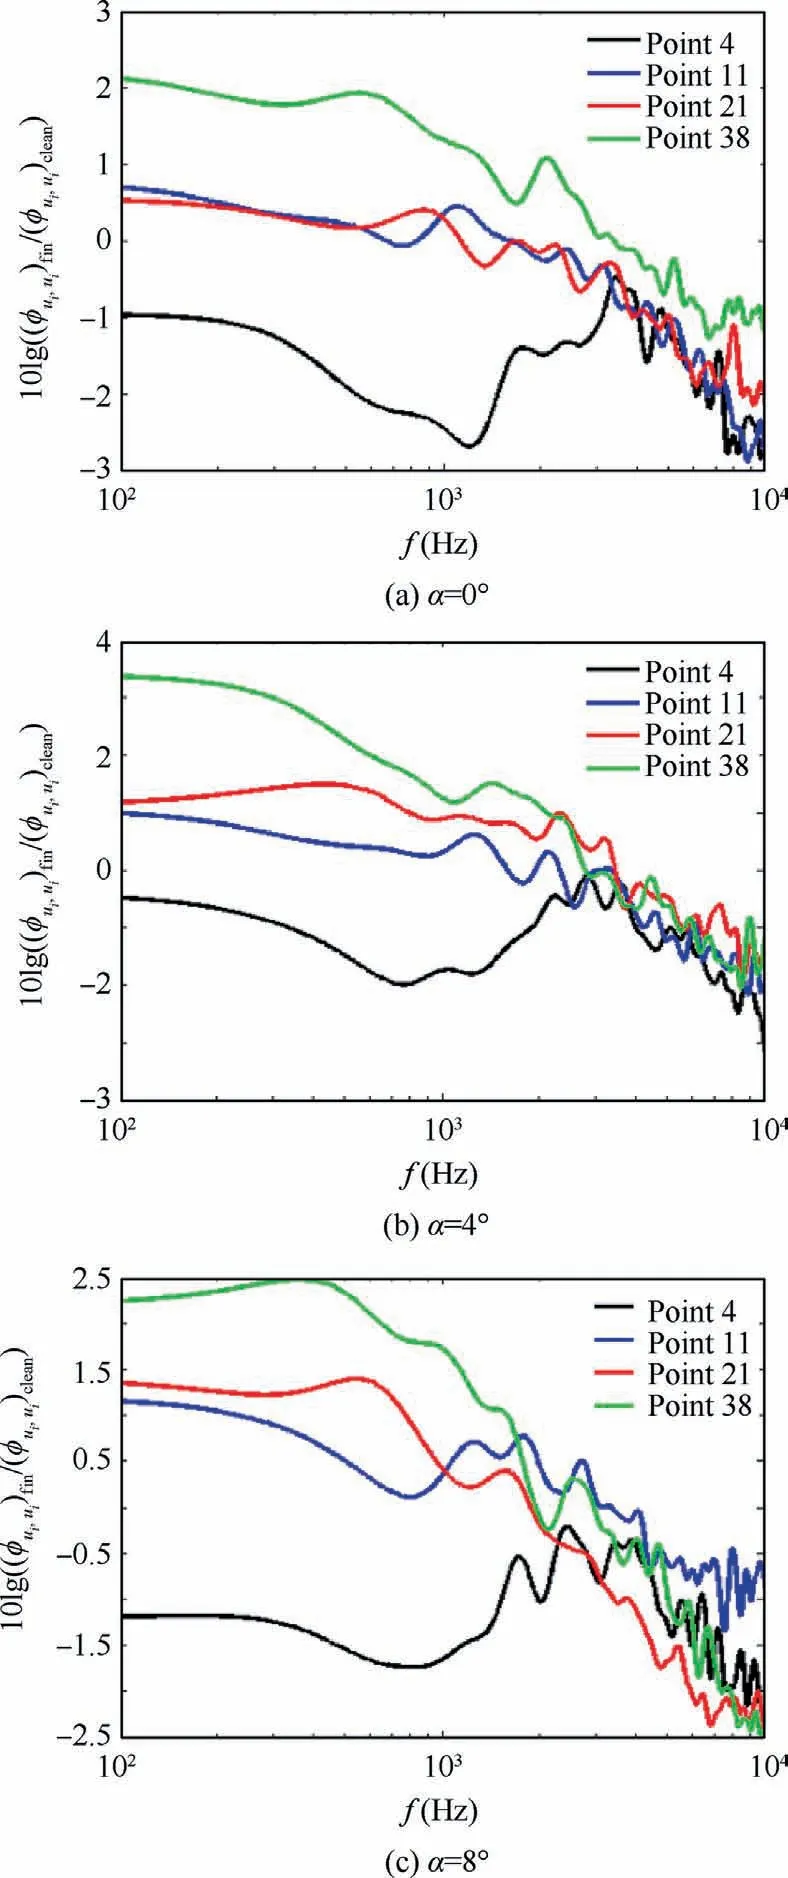
Fig.14 10 × ΔLØ(f-C) at some points along behind finlets at Points 4, 11, 21, 38.
Fig.18 shows the velocity profiles at Point a,with the presence of the surface treatment element.As shown in Fig.18,flow separation does not occur after the surface treatment element with S = 6 mm at all angles of attack (α = 0°, 4°, and 8°).However,according to Afshari’s report27,flow separation occurs after the surface treatment element with S = 2 mm at α = 0°, on the flat plate.
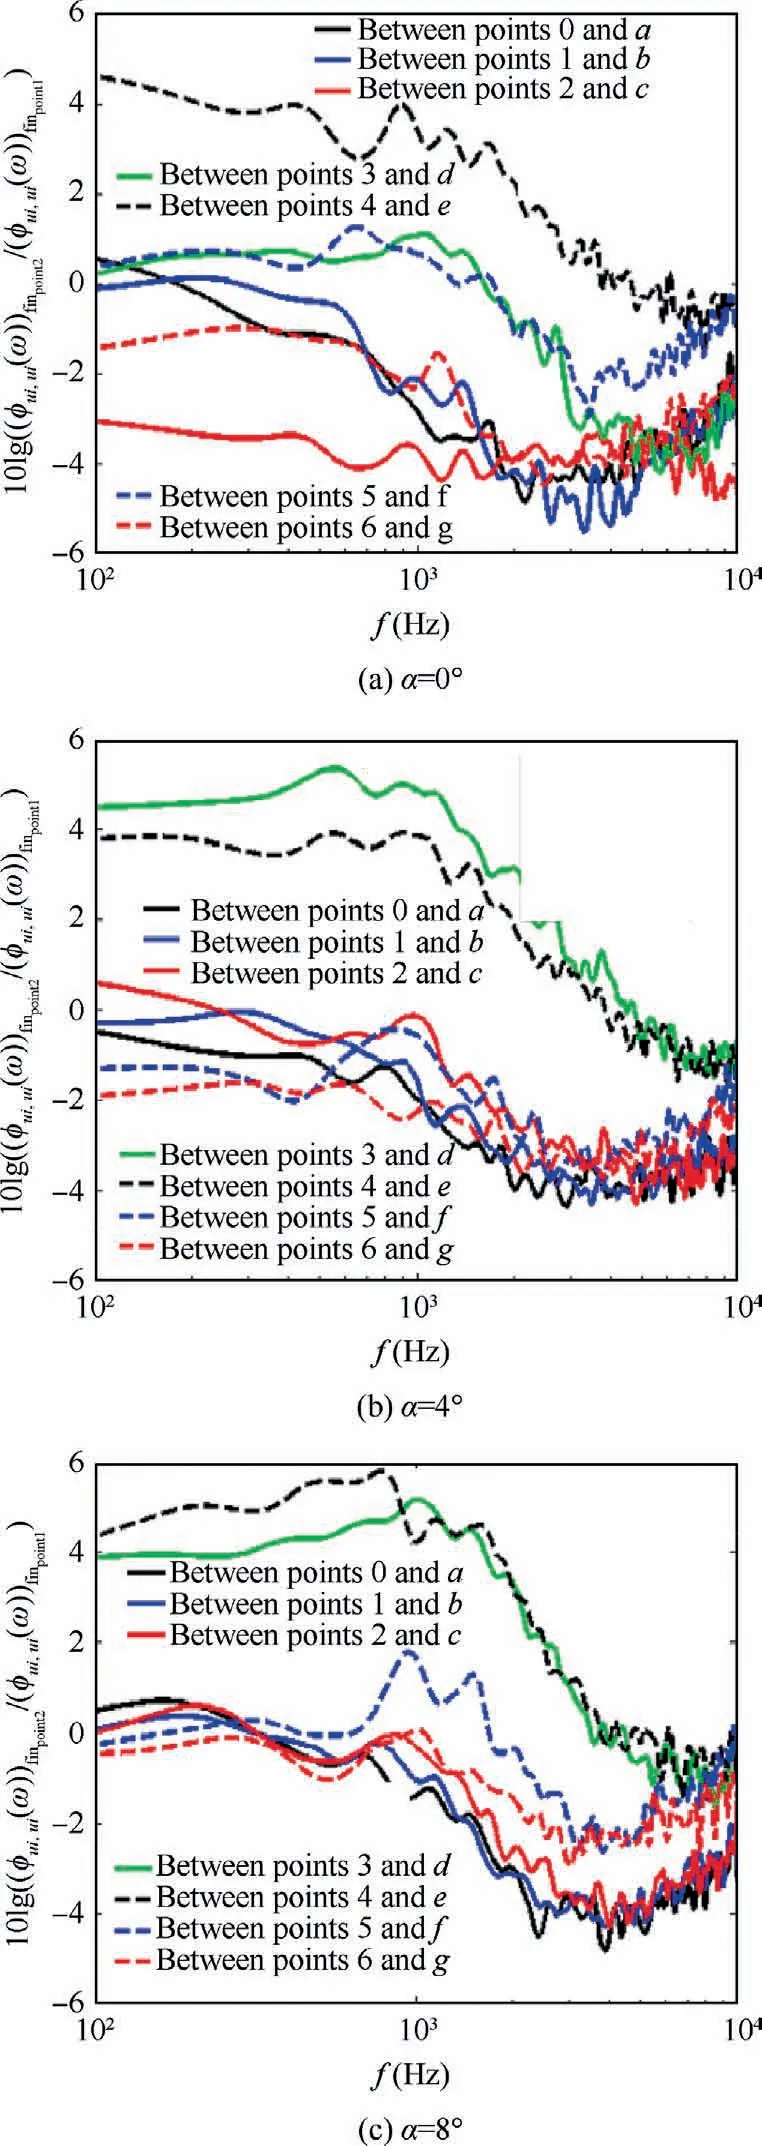
Fig.15 10×ΔLØfin(P2-P1)between Points 0,1,2,3,4,5 and 6 at Xaft/h = 2.5 and Points a, b, c, d, e, f and g at Xaft/h = 0.43.
Data acquisition was taken at Point a in the z-direction,with and without the surface treatment element.The results are shown in Fig.19.According to the presented information in Fig.19,the energy of the vortices is clearly reduced in all frequency spectra by the surface treatment element with S = 6 mm at 0.57 ≤z/h ≤0.855 and at α = 0°, 4°.This decrease happens at low frequencies near the wall at α=8°.In the same way, it is clear that the surface treatment element causes the increase in the vortex energy in all frequency spectra at z/h ≥1 strongly.This increase is greater at intermediate frequencies.Its reason is flow injection from between finlets into the turbulent flow that passes above them.The growth of the boundary layer is caused to reduce in the mass flow rate between two consecutive finlets and flow injection into the stream that passes through the top of the finlets.
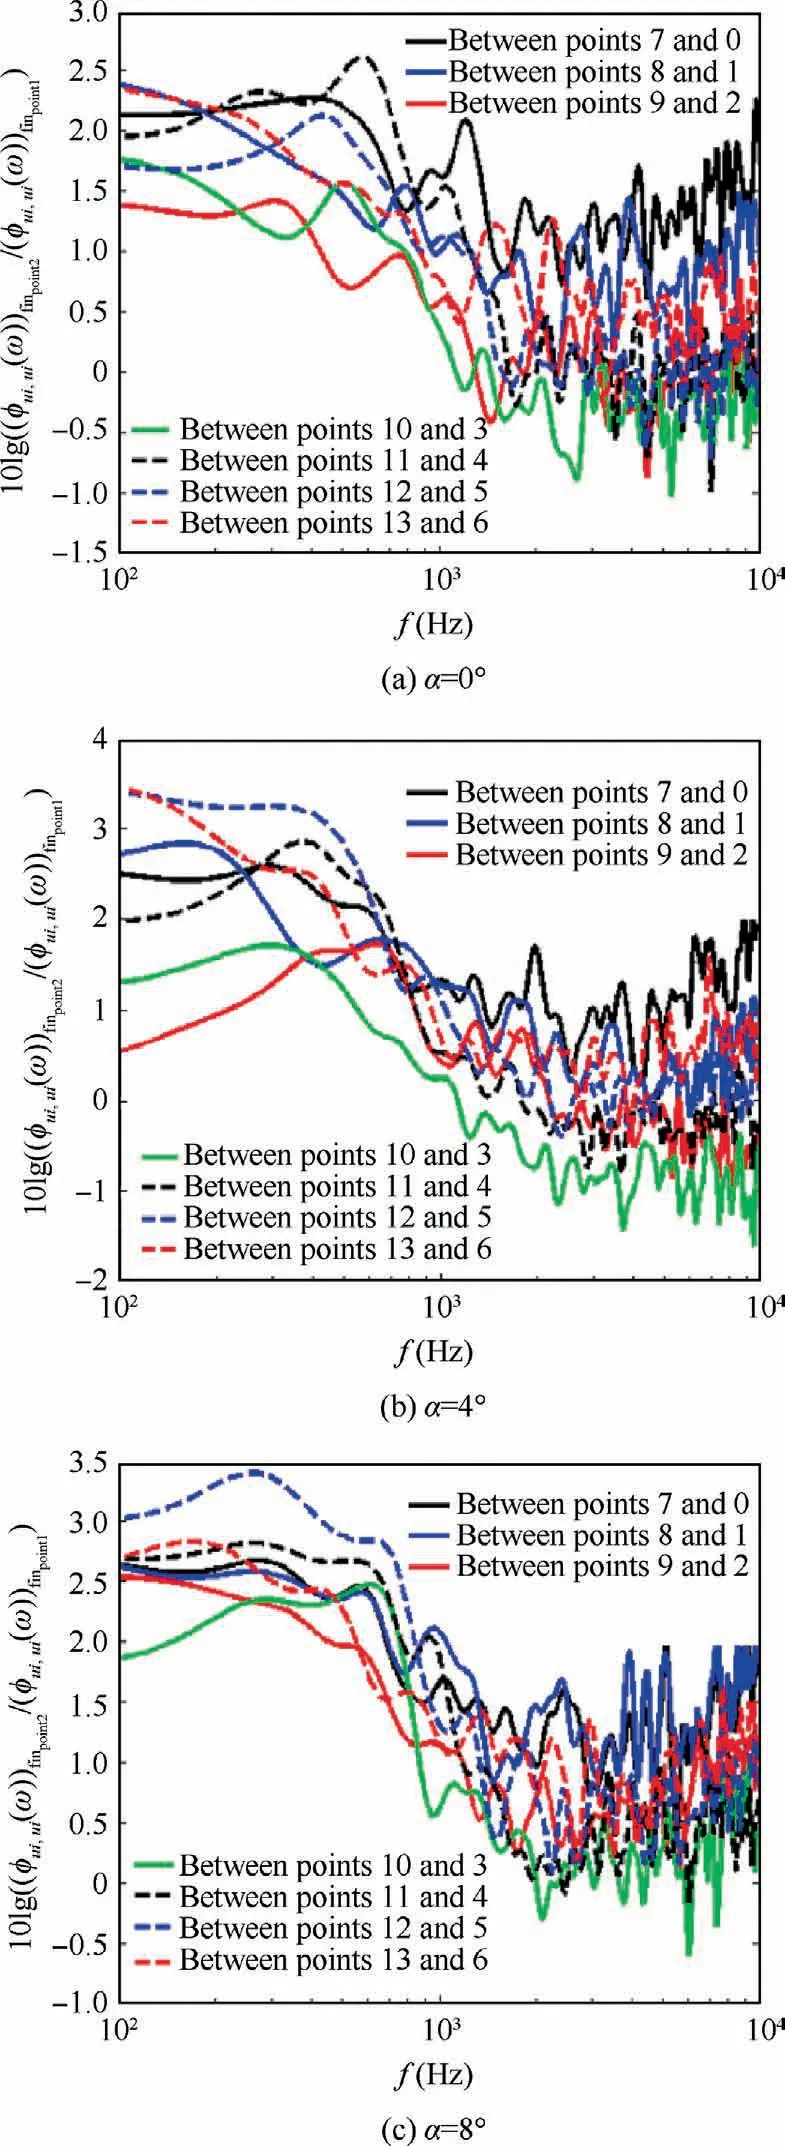
Fig.16 10×ΔLØfin(P2-P1) between Points 7,8, 9,10,11,12 and 13 at Xaft/h=6.8 and Points 0,1,2,3,4,5 and 6 at Xaft/h=2.5.
Finally, it should be noted that the behavior of finlets changes with geometric properties, especially the S parameter.Afshari et al.27and Gstrein et al.20showed this in their researches.Afshari et al.investigated the effect of the surface treatment with various S (finlet spacing) on turbulence intensity profiles at different Xaft/h.According to Afshari’s research,turbulence intensity near the wall is reduced by the surface treatment that has S = 8 mm with Xaft/h increasing.But in the case of the surface treatment with S=2 mm,the opposite is true.However, in this article, it is proved that the surface treatment with S = 6 mm reduces turbulence intensity near the wall until Xaft/h = 2.5 and then increases it after this location.
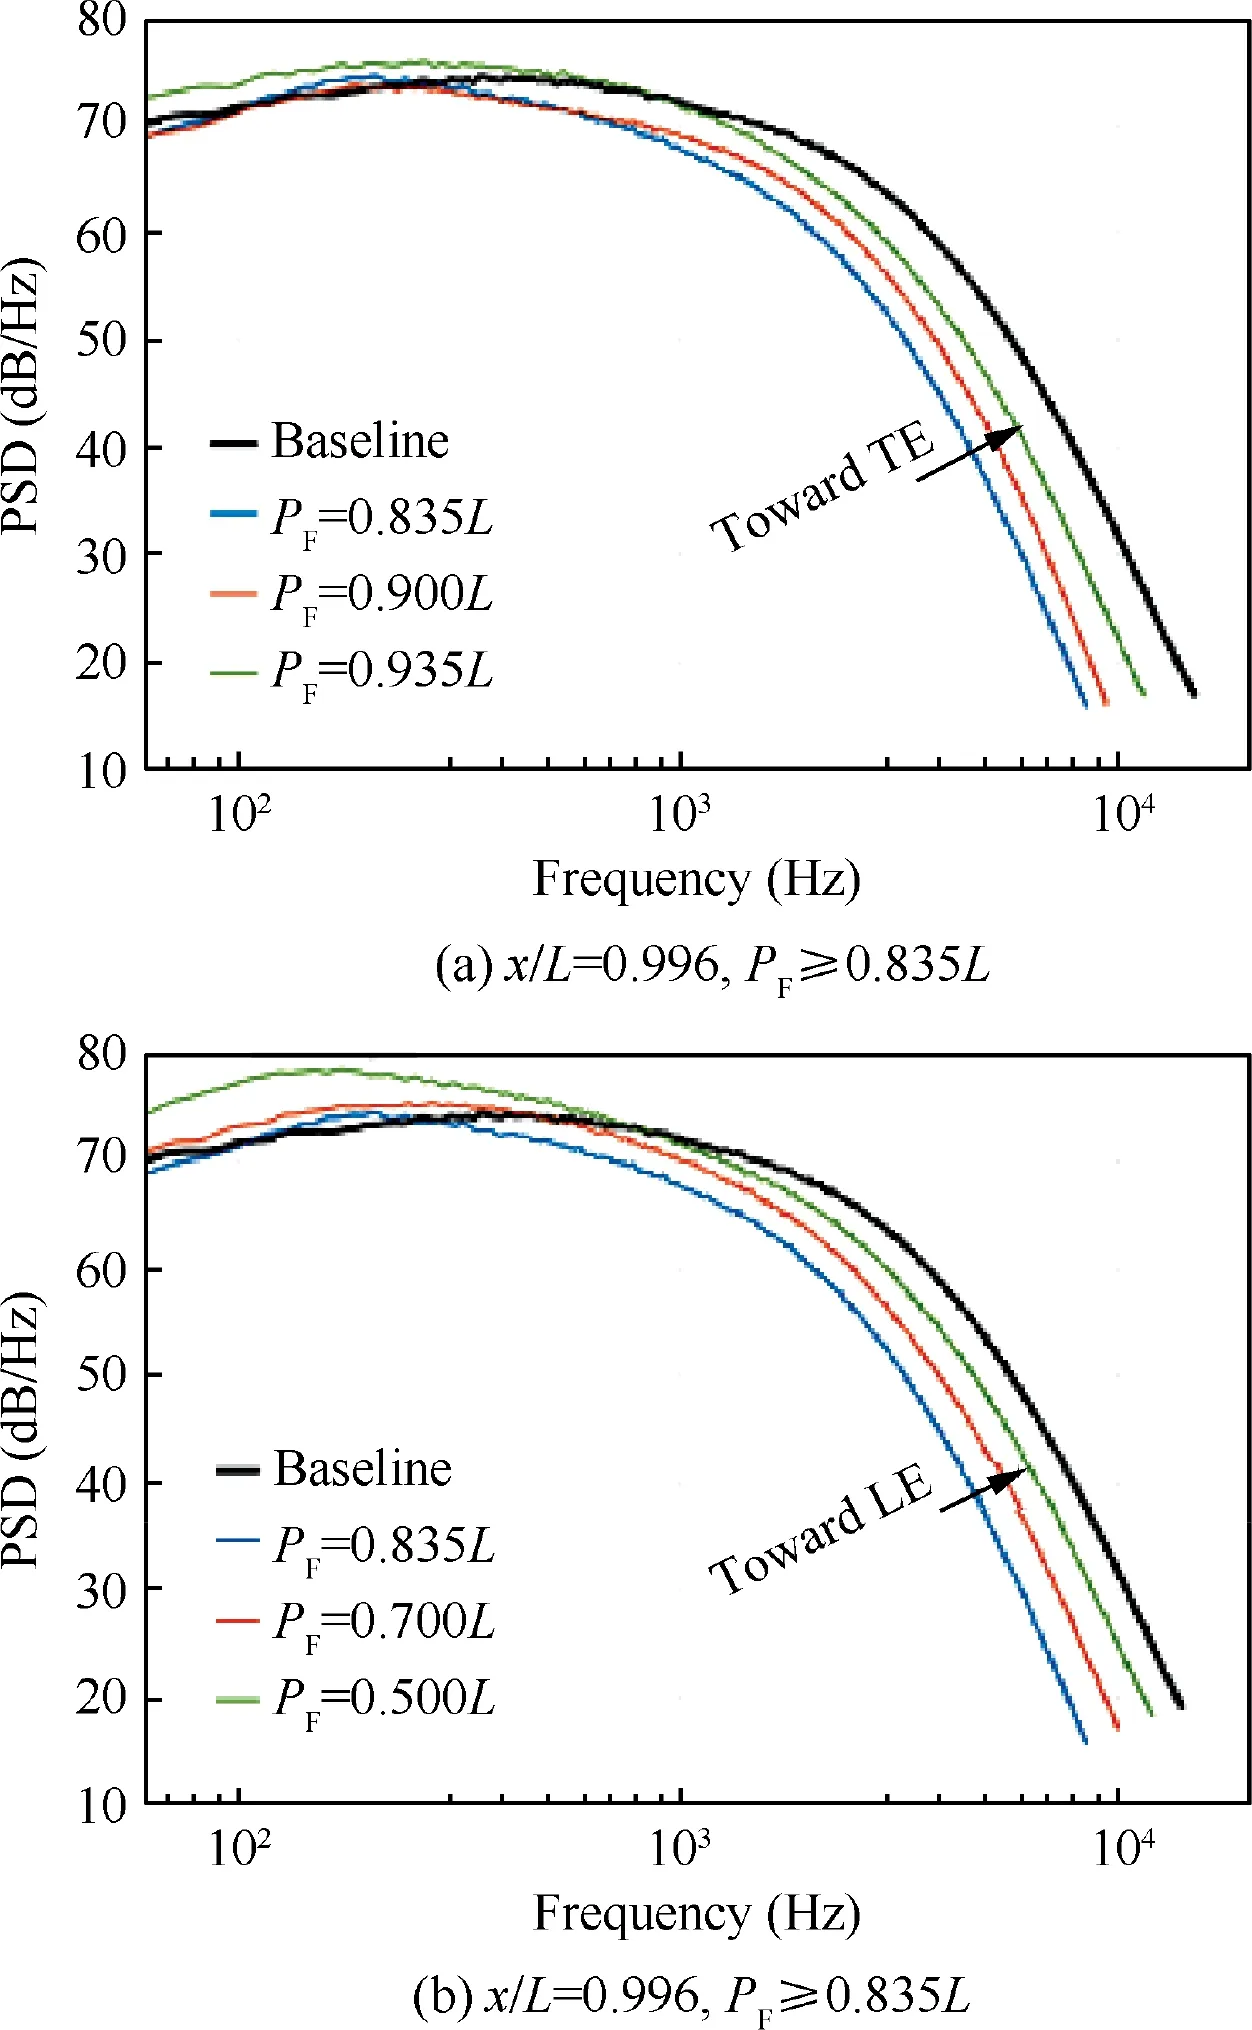
Fig.17 Surface pressure fluctuation PSD for conventional finlets with h=12 mm,S=4 mm and LF=65 mm applied at various positions at ReL = 9.9 × 105.20
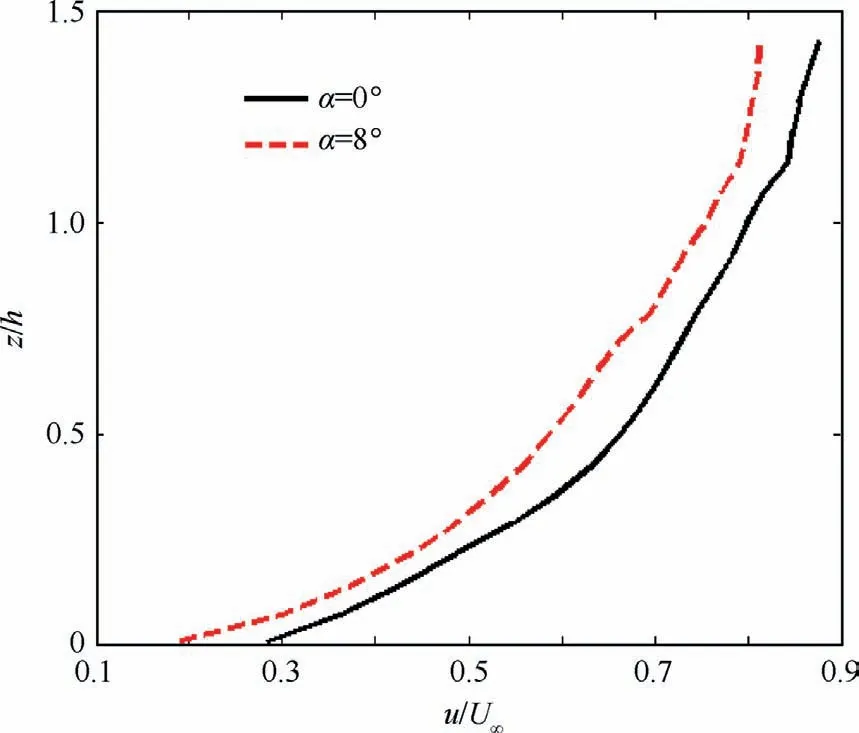
Fig.18 Velocity profiles at 3 mm after surface treatment element with S = 6 mm, exactly between two consecutive finlets.
7.Analysis of some phenomena
In this section, the reasons for some of the phenomena are explained.
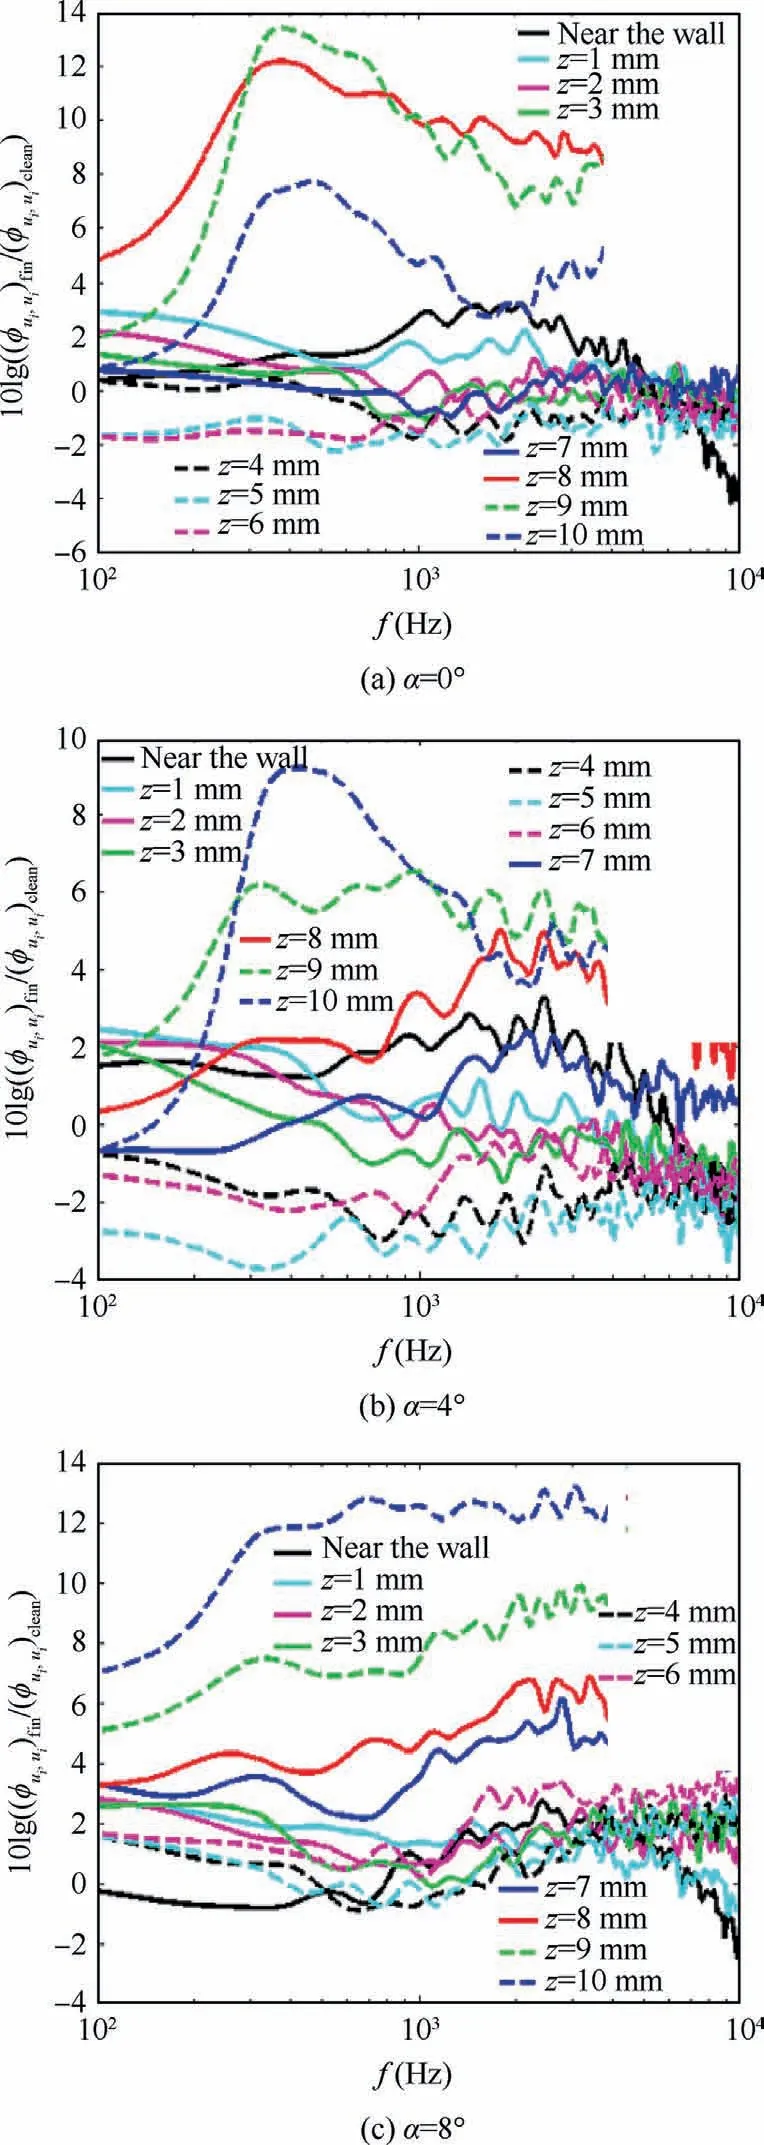
Fig.19 10 × ΔLØ(f-C) at points in z-direction.
On the walls of two consecutive finlets, the growth of the boundary layer occurs.This causes the increase in the kinetic energy of the flow between the finlets at the end of them.It increases the energy of vortices at low and intermediate frequencies at Xaft/h = 0.43 near the wall.Fig.7 confirms the occurrence of this phenomenon.It has also been shown by Afshari et al.27.Their research has been done on a flat plate at α = 0°.Meanwhile, Bodling et al.have also mentioned this phenomenon.29
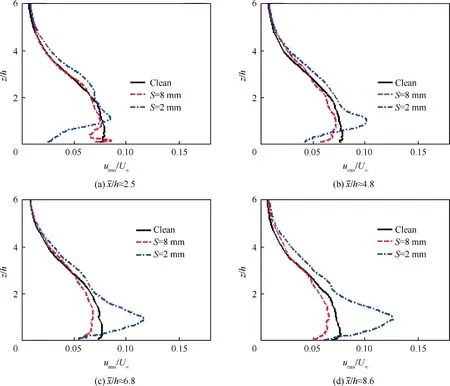
Fig.20 Effect of surface treatment with various S (finlet spacing) on turbulence intensity profile at different Xaft/h.27
After the finlets (after Xaft/h = 0.43), a decrease in kinetic energy occurs in the turbulent flow structure.This causes a decrease in the energy of vortices to be seen in all frequency ranges at Xaft/h = 2.5 near the wall.This is shown in Fig.15.Meanwhile, this phenomenon has been reported by Afshari et al.27and Bodling et al.29
Due to the growth of the boundary layer between the finlets, the mass flow rate decreases in this region.This causes some flow to be injected into the turbulent flow passing through the top of the finlets.By injecting the flow,the energy of vortices increases in all frequency spectra strongly.This phenomenon can be well seen in Fig.19.
Part of the turbulent flow above the finlets hits the wall of the airfoil after Xaft/h=2.5 probably.Vortex shedding on the wall increases the energy of vortices in all frequency ranges after Xaft/h=2.5 near the wall.Figs.9-14 and Fig.16 show it.
Right behind the finlets,low-energy regions are created similar to the cavitation phenomenon.This is well seen in Figs.7 and 15 (black dashed and green plots).
8.Conclusions
Noise reduction of different airfoils is important.Several passive noise reduction methods are used on airfoils.One of these methods is the use of surface treatment.In this research, the effect of the surface treatment element with S = 6 mm on the vortex structure at different frequencies in the turbulent flow that was created on the NACA2412 section has been investigated.Based on the performed experiments, the following results can be presented:
(1) Flow separation does not occur exactly after the surface treatment element with S = 6 mm up to α = 8°.However, Afshari et al.reported that flow separation happens after the surface treatment with S = 2 mm on a flat plate at α = 0°.27It is shown in Fig.18.
(2) A noticeable momentum decrease occurs after the surface treatment element with S = 6 mm, near the wall at Xaft/h=2.5,Xaft/h=6.8,and Xaft/h=8.6.According to Afshari’s research,27the momentum decreasing with the presence of a surface treatment element with S = 6 mm is less than S = 2 mm and more than S=8 mm.According to items 1 and 2 as well as Figs.6 and 20, the performance of the surface treatment element on the flow behind it depends on its characteristics,especially S (finlet spacing).
(3) The energy of the vortices at the intermediate and high frequencies, with the presence of the surface treatment element that has S = 6 mm, decreases more at Xaft/h = 2.5 compared to Xaft/h = 0.43 and remains almost constant at low frequencies.The reason may be the occurrence of a fully developed flow between the finlets, which causes the flow velocity to increase at Xaft/h = 0.43 near the wall.
(4) The energy of vortices in all frequency spectra is increased after Xaft/h=2.5 by the surface treatment element with S=6 mm.It is shown in Fig.16.The reason for that is the injection of flow and vortices on the top of the finlets and then a part of them shedding after Xaft/h = 2.5, at all angles of attack.The increase in the energy of the vortices in all frequency ranges above the finlets is well seen in Fig.19.This phenomenon is explained in Section 7.
(5) The main effective factor of SPL in the far-field is the intensity of pressure fluctuations that occur near the wall at different frequencies.In order to reduce velocity and pressure PSD in all frequency spectra near the wall, the surface treatment with S = 6 mm should be moved slightly towards the leading edge of the NACA2412 airfoil relative to the end of the trailing edge.This displacement is about a dimensionless distance of Xaft/h = 2.5.
(6) Just after the surface treatment element with S=6 mm and at 0.57 ≤z/h ≤0.855, the energy of vortices in all frequency spectra is clearly reduced at α = 0°, 4°.It happens in the middle of two consecutive finlets.It is seen in Fig.19.
(7) Right after the surface treatment element with S = 6 mm and near the wall, the energy of vortices is reduced at low frequencies and α = 8°.It is shown in Fig.19.
(8) At z/h ≥1,the energy of vortices in all frequency ranges is strongly increased, at all angles of attack.This increase is further at intermediate frequencies.The reason may be the injection of flow from between the finlets to their top.
Declaration of Competing Interest
The authors declare that they have no known competing financial interests or personal relationships that could have appeared to influence the work reported in this paper.
 CHINESE JOURNAL OF AERONAUTICS2023年10期
- CHINESE JOURNAL OF AERONAUTICS的其它文章
- Oscillation quenching and physical explanation on freeplay-based aeroelastic airfoil in transonic viscous flow
- Difference analysis in terahertz wave propagation in thermochemical nonequilibrium plasma sheath under different hypersonic vehicle shapes
- Flight control of a flying wing aircraft based on circulation control using synthetic jet actuators
- A parametric design method of nanosatellite close-range formation for on-orbit target inspection
- Bandgap formation and low-frequency structural vibration suppression for stiffened plate-type metastructure with general boundary conditions
- Geometrically compatible integrated design method for conformal rotor and nacelle of distributed propulsion tilt-wing UAV