
Seismicity and seismogenic mechanism of the MS 6.0 Luxian earthquake on September 16, 2021
2024-01-08 06:00KezhenZuoCuipingZhao
Earthquake Research Advances 2023年4期
Kezhen Zuo, Cuiping Zhao
Institute of Earthquake Forecasting, China Earthquake Administration, Beijing, 100036, China
Keywords:
ABSTRACT Based on the seismic data recorded by the China Earthquake Networks Center (CENC) in the Luxian area from January 2009 to October 2021,the 3D VP,VS,VP/VS structures and seismic locations of the area are obtained by joint inversion using the VP/VS model consistency-constrained double-difference tomography method(tomoDDMC).The earthquakes in the study area are mainly concentrated at a depth of 2–6 km, and the focal depth is generally shallow.The MS 6.0 Luxian earthquake occurred at the transition zone of high-and low-velocity anomalies and the aftershock sequence was distributed along the edge of the low-VP zone.A small number of foreshocks occurred on the west side of the MS 6.0 Luxian earthquake, while most of the aftershocks were distributed on the east side of the MS 6.0 Luxian earthquake.The aftershock sequence consisted of three seismic bands with different trends,and the overall distribution was in a NWW direction,which was inconsistent with the spatial distribution of the main active faults nearby.In addition, the spatiotemporal distribution of earthquakes and the variation of b-values are closely related to the industrial water injection activities in the study area,reflecting the activation of pre-existing hidden faults under certain tectonic and stress environments leading to seismic activities in the area.
1.Introduction
On September 16, 2021 Beijing time, theMS6.0 Luxian earthquake occurred in the southern region of the Sichuan Basin (Fig.1).The earthquake is the largest earthquake recorded in the Luxian area,and its highest intensity was degree VIII,causing serious damage to local houses and buildings,and resulting in 3 deaths and more than 100 injuries(Yang et al.,2022).

Fig.1.Distribution of epicenters and stations in the study.
The epicenter of theMS6.0 Luxian earthquake is located in the Yujiasi syncline between the Luoguanshan anticline and the Gufoshan anticline.The closest active fault to the epicenter is the Huayingshan Fault Zone,with a strike of northeast direction and a movement characterized by thrusting and dextral strike-slip (Deng et al., 2003).In the study area(105.10–105.90°E, 28.95–29.65°N), the fault zone is composed of multiple branches (Fig.2), mainly distributed along the anticline axis and characterized by thrust movement(Yi et al.,2021).
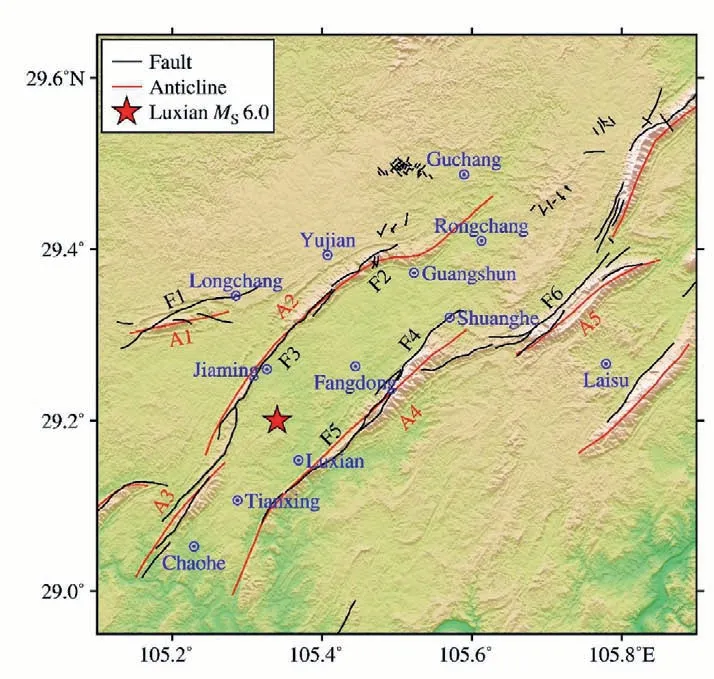
Fig.2.Tectonic background of the study area.
The historical seismicity in the study area was relatively weak, but since the 1980s, the Rongchang area in the northern part of the study area has experienced a significant increase in seismicity due to the injection of wastewater from natural gas fields (Ding and Li, 2004; Lei et al.,2008).After 2013,all wastewater injection wells in the area were closed,but the injected overpressure fluid still led to high seismic activity in the area (Wang et al., 2020).In addition, shale gas extraction has begun in the central and southern regions of the study area in recent years,and hydraulic fracturing can also lead to increased seismic activity.The seismicity in the study area is complex, and further research is needed to understand the seismogenic mechanism.
After theMS6.0 Luxian earthquake, the China Earthquake Administration (CEA) immediately launched a seismic scientific investigation,which conducted a comprehensive study of the earthquake in terms of source parameters, seismogenic environment, sequence characteristics and regional seismic risk, etc.As part of the scientific research on theMS6.0 Luxian earthquake, this study obtained the seismic relocations and 3D crustalVP,VS,VP/VSstructures in the Luxian area by joint inversion.Combined withb-value, focal mechanism solution and industrial water injection, we analyzed the seismicity characteristics and seismogenic mechanism in the Luxian area.
2.Data and method
2.1. Data
We collected the seismic catalog and phase arrival data of the Luxian and surrounding areas from January 1, 2009 to October 31, 2021 and used the tomoDDMC method (Guo et al., 2018) to invert the seismic locations and 3D velocity structures.A total of 5 580 earthquakes were recorded in the study area during this time period, but this included a large number of earthquakes that were recorded by a single station.We select earthquakes recorded by at least 3 stations to invert the seismic locations and velocity structures.The phase arrival data with large deviation was deleted according to the travel time curves (Fig.3).Moreover, at least 6 phase arrival times are required for each earthquake involved in the inversion.After selection,2 133 earthquakes(Fig.4)and 78 stations(Fig.1)are used for inversion.
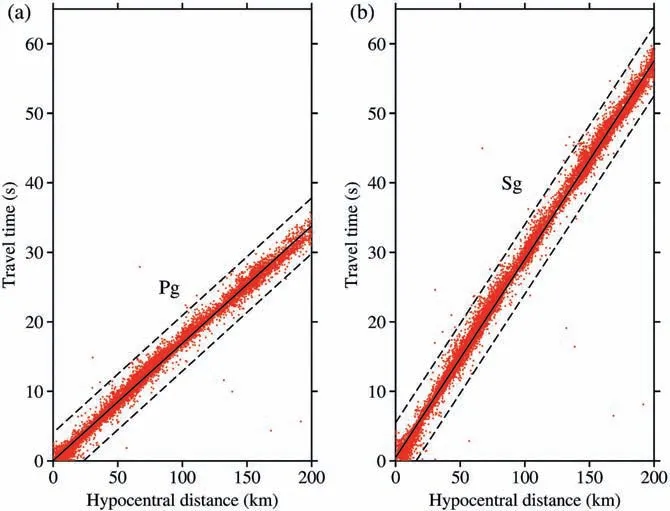
Fig.3.Travel time curves of (a) Pg and (b) Sg.

Fig.4.Distribution of ray paths and inversion grids.
2.2. Method and process
The tomoDDMC method used in this study was developed based on the traditional double-difference tomography method (Zhang and Thurber, 2003; Zhang et al., 2009).In tomography research, theVP/VSmodel is usually obtained by two methods.One method is to use theVPmodel divided by theVSmodel, and the other is to use the S–P data to directly invert theVP/VSmodel.The newly developed method can use both the absolute and differential arrival data of P-wave, S-wave and S–P data to jointly invert the earthquake locations and 3DVP,VSandVP/VSstructures, and in the inversion process, consistency constraints are added to the twoVP/VSmodels to obtain high-resolution and reliableVP/VSmodel(Guo et al.,2018;Zuo et al.,2023).
Relatively accurate initial velocity models and seismic locations are crucial for the reliability of the final results of the joint inversion.Therefore, based on the Crust 1.0 velocity model (Laske et al., 2013) of the study area and the initial seismic locations from CENC, we first perform a preliminary inversion using the traditional double-difference tomography method.Then, the seismic locations and velocity models obtained from the preliminary inversion were used as input, and the tomoDDMC method is used for joint inversion again to obtain more accurate 3DVP,VS,VP/VSmodels and seismic locations.
For the differential times,the interevent distance of event pairs is less than 20 km,and the maximum number of neighbors is 20.Based on the data distribution,we set the horizontal grid spacing within the study area to 5 km,the grid spacing at the periphery to 10 km(Fig.4),and the grid nodes in the depth direction are located at depths of 0,4,7,10,13,16,20,and 30 km,respectively.The optimal damping and smoothing factors used in the inversion were obtained by constructing trade-off curves(Eberhart-Phillips,1986),with values of 300 and 50,respectively.
2.3. Reliability of the inversion results
We used the checkerboard test method (Humphreys and Clayton,1988)to assess the reliability of the 3D velocity models obtained from the inversion.Firstly, the synthetic checkerboard models are created by adding±5%and±10%perturbations to the initialVPandVP/VSmodels at alternating grid nodes, respectively.TheVSmodel is calculated from theVPandVP/VSmodels, so its perturbations are about -4.5% and+5.5% alternately.Then, based on the checkerboard model and the seismic data used in the inversion, we used the pseudo-bending ray--tracing algorithm (Um and Thurber, 1987) to generate a theoretical travel time dataset.Finally, the synthesized dataset was inverted using the same inversion strategy as the real inversion.
The results of the checkerboard test are shown in Fig.5.At depths of 4–13 km,VP,VS,andVP/VSmodels can be well restored in most zones of the study area.At the depth of 0 km,the checkerboard models can be well restored only in the central part of the study area where the earthquakes are more concentrated.At the 16 km depth, the checkerboard models cannot be effectively restored.Therefore, the 3D velocity structures discussed in this study mainly focus on the depths of 0–13 km.
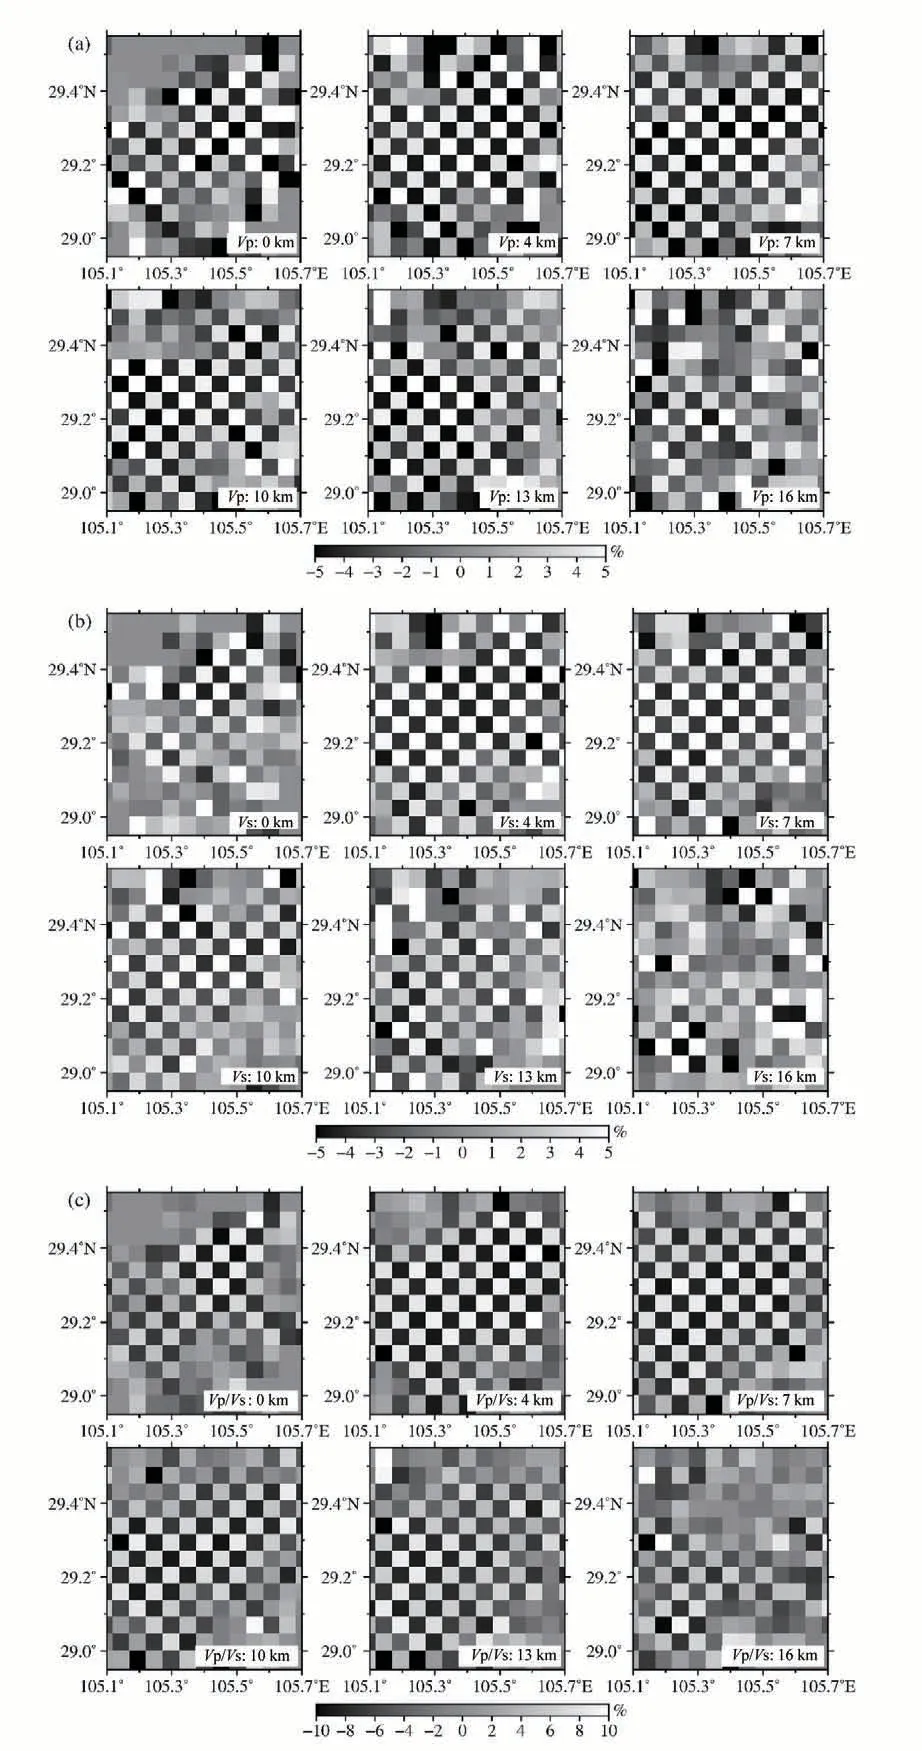
Fig.5.Recovered checkerboard anomalies for (a) VP, (b) VS, and (c) VP/VS.
3.Results and discussion
3.1. Spatiotemporal migration characteristics of earthquakes
After the joint inversion,we obtained the relocation results for 1936 earthquakes, whose epicenter distributions are shown in Fig.6a.Compared to the initial earthquake distribution, the distributions of relocated earthquakes are more tightly clustered.Before 2020, earthquakes mainly occurred near Rongchang County in the northern part of the study area.Wastewater from natural gas extraction has been injected into Permian formations at a depth of ~3 km through several deep wells in this area since 1978, and the earthquakes are spatially concentrated around the wastewater injection wells (Fig.6a).Since 2020, shale gas extraction has begun around Luxian County in the southern part of the study area.Correspondingly, there has been a significant increase in seismicity in the region, which did not occur on main active faults, but were mostly concentrated around shale gas wells.In the depth direction(Fig.6b and c), the predominant depth of earthquakes in this area is 2-6 km, and the focal depths are generally shallow, among which the focal depth ofMS6.0 Luxian earthquake after relocation is about 4 km.
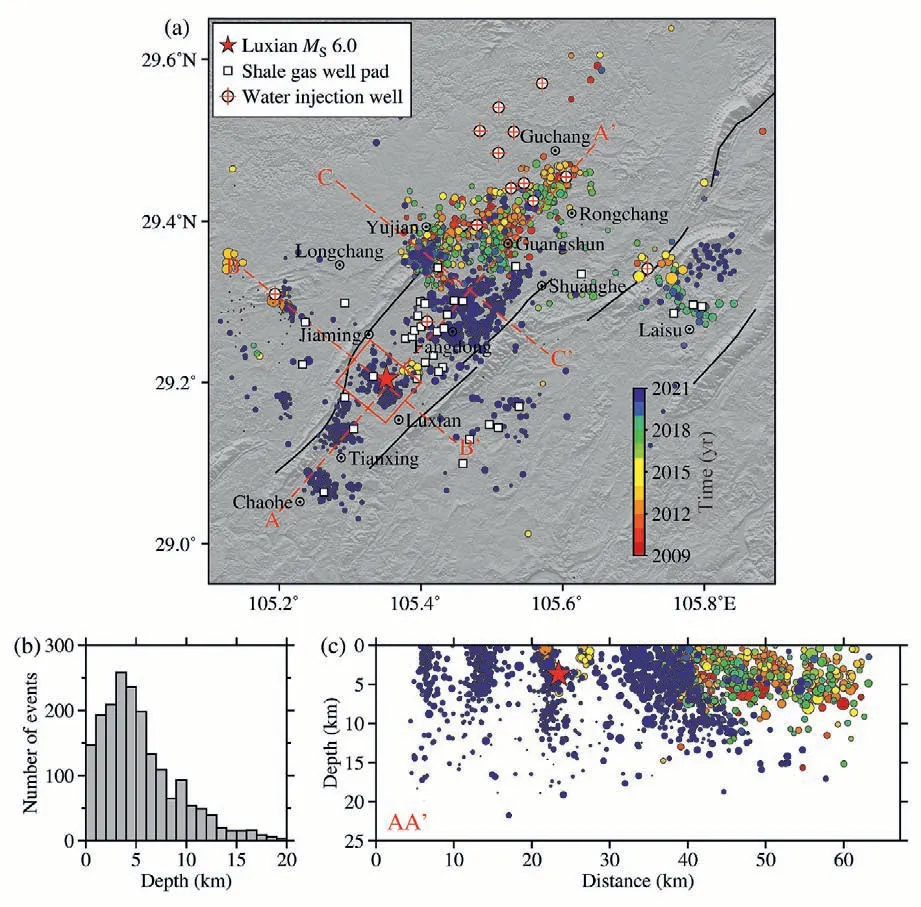
Fig.6.Distribution of epicenters in the study area after relocation
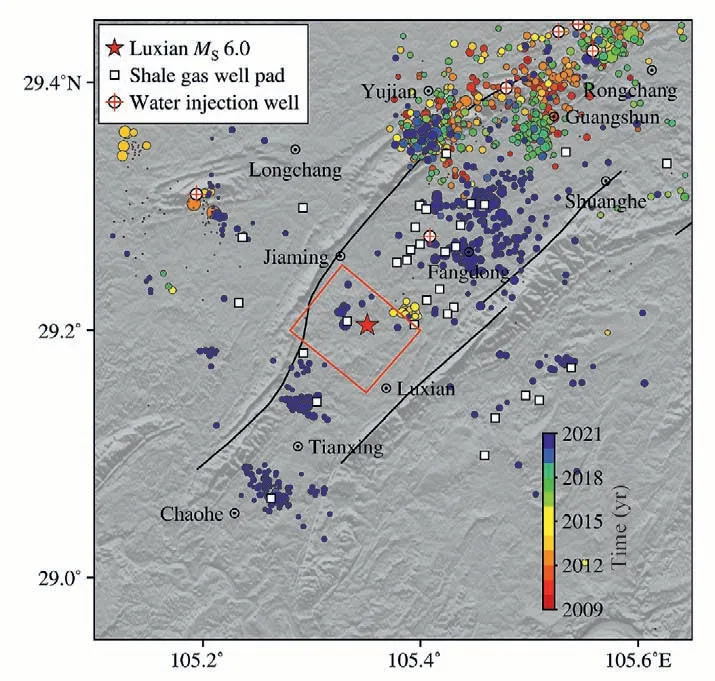
Fig.7.Distribution of earthquakes in the study area before MS 6.0 Luxian earthquake.
Figs.7 and 8 show the distributions of earthquakes in the study area before and after the occurrence of theMS6.0 Luxian earthquake,respectively.Before theMS6.0 Luxian earthquake, there were obvious seismic activities around the shale gas well in the source area.These earthquakes are mainly located on the west side of the shale gas well,including theML2.6 andML3.1 earthquakes that occurred about 3 min before theMS6.0 Luxian earthquake.After theMS6.0 Luxian earthquake,the aftershocks were generally distributed in a NWW direction, consistent with the NWW node plane of the focal mechanism solution of the mainshock (Yi et al., 2021).The distribution length of the aftershock sequence is about 5 km, with more aftershocks concentrated in the eastern end of the sequence and relatively few aftershocks in the western end (Fig.8c).In addition, the relocation results of earthquakes showed that the aftershock sequence formed three branches in different directions, which were near EW, NWW, and NE (white dotted lines in Fig.8a).According to the focal mechanism solution ofMS6.0 Luxian earthquake and the distribution of aftershock sequence, it can be inferred that the seismogenic fault ofMS6.0 Luxian earthquake is not a known active fault in the vicinity (Fig.8).
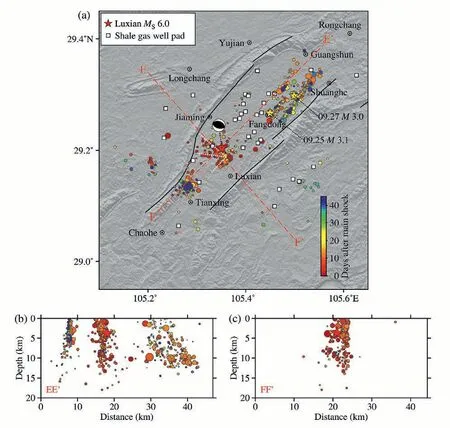
Fig.8.Distribution of earthquakes in the study area after MS 6.0 Luxian earthquake
The seismic activity in the source area before the occurrence of theMS6.0 Luxian earthquake was mainly located on the west side of the shale gas well, while theMS6.0 Luxian earthquake and most of its aftershocks occurred on the east side of the shale gas well, and the NWWoriented aftershock sequences ran through both the east and west sides of the well.Therefore, we speculate that there were small-scale faults underground, and hydraulic fracturing first activated the western end of the fault near the shale gas well.With the progress of hydraulic fracturing,slightly further parts of the fault on the east side were also activated,triggering theMS6.0 Luxian earthquake.
In general, the aftershock activity of theMS6.0 Luxian earthquake was weak (the areas outlined by red box in Fig.6a), and the maximum aftershock magnitude was onlyML2.8.After theMS6.0 Luxian earthquake, in addition to the aftershock activity in the epicenter area, there were also two obvious seismic clusters near Tianxing Town and Fangdong Town (Fig.8a), and there were also shale gas wells nearby.Among them, the distribution of earthquakes near Tianxing Town is relatively concentrated, and the strike of the seismogenic faults is not clear.The seismic activities near Fangdong Town formed three distinct NE-oriented seismic strips, and two earthquakes of magnitude greater than 3 occurred in this region on September 25 and 27, 2021, respectively.The relocation results of earthquakes clearly demonstrate that the seismic activities in the region are caused by the activity of multiple small-scale faults.
3.2. Spatiotemporal distribution characteristics of b values
It is generally suggested that theb-value decreases with the increase of stress level, andb-value also changes due to the influence of pore pressure (Dempsey et al., 2016).According to the earthquake catalogue provided by CENC, the variation curve ofb-value versus time was calculated from a sliding window containing 500 earthquakes (Fig.9).The maximum curvature method was used to determine the complete magnitude of each group of earthquakes, and then thebvalues were calculated by the maximum likelihood method.The results show that thebvalues in the study area have a significant increase around 2012,reaching about 1.2.During this time, there were frequent small earthquakes in Rongchang area, which we suggest are related to wastewater injection in this area.After 2013, with the shutdown of water injection wells, the frequency of earthquakes obviously decreased, and theb-value also decreased to about 0.9.By 2020, the seismic activity in the study area increased again, and thebvalues also increased significantly, which corresponds to the exploitation of shale gas in Luxian region in the central and southern part of the study area.After theMS6.0 Luxian earthquake on September 16, 2021, theb-value decreases significantly,with a value of approximately 0.8.
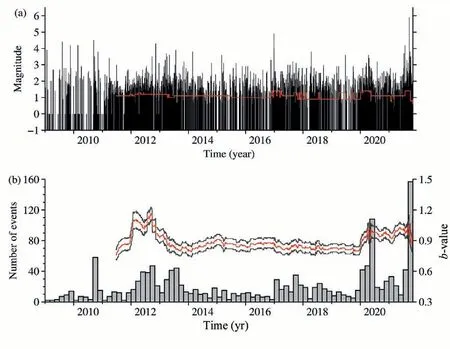
Fig.9.M-T plot, N-T plot, and the variation curve of b-value versus time
In addition, we calculated the spatial distribution ofbvalues according to the earthquake catalog of CENC.Each earthquake is colored inb-value computed from 200 nearest neighbors in Fig.10.The results show that there were significant spatial distribution differences in thebvalues within the study area.The source area of theMS6.0 Luxian earthquake is an obvious lowb-value zone, reflecting the high stress accumulation in the area.The lowb-value zones also exist in the Rongchang-Guangshun-Yujian-Longchang area and near Fangdong Town, where earthquakes with magnitude great than 4 have occurred several times since 2009.A significant highb-value zone is found near Tianxing and Shuanghe towns.
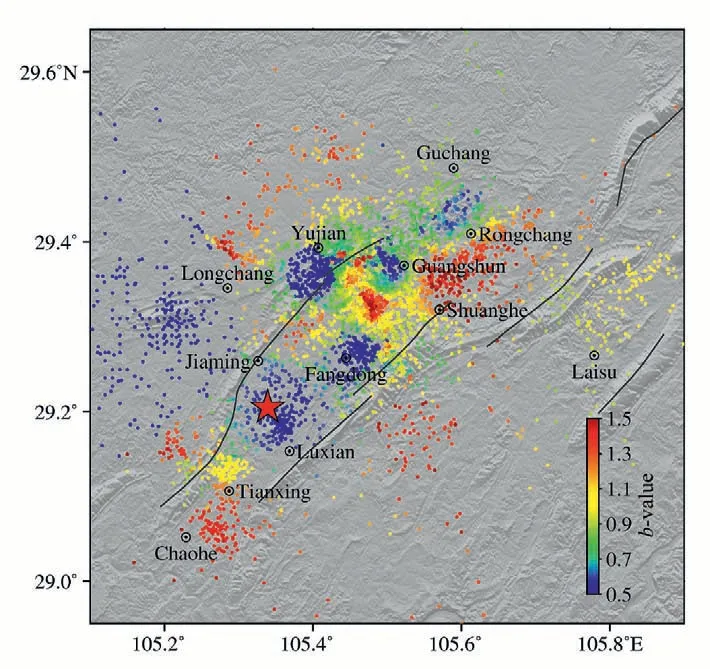
Fig.10.The spatial distribution of b values in the study area.
3.3. Velocity structures and the seismic active environment
Fig.11 shows the inversion results of theVP,VSandVP/VSmodels at different depths.It can be seen that there are significant heterogeneities in the study area.The results of the checkerboard test show that reliable velocity models can also be obtained at the depth of 0 km in the central region of the study area.At the depth of 0 km, the area between the Luoguanshan anticline and Gufoshan anticline is an obvious low-velocity area with a high-VP/VSvalue, while the locations of the Luoguanshan anticline and Gufoshan anticline are relatively high-velocity areas, and the results are in good agreement with the stratigraphic exposure information given by the geological map.In general, older sediments have higher P- and S-wave velocities(Long et al.,2020;Zuo et al.,2020).

Fig.11.(a) VP, (b) VS, and (c) VP/VS models at different depths.
At the depth of 0-4 km, the Longchang-Rongchang area in the northern part of the study area shows obvious high-velocity anomalies and relatively high-VP/VSanomalies.At the depth of 4 km, the Yujian town area, where the seismic activity is frequent, is located in the transition zone between high-and low-velocity regions and is also located in the transition zone between high- and low-VP/VSregions.The depth profile(Fig.12c)shows that the focal depths of earthquakes in this area are relatively shallow.The medium with high-velocity and low-VP/VSusually indicates that its strength is higher and can accumulate higher stresses.The spatial distribution of b values also shows that the area is a low b-value region(Fig.10).
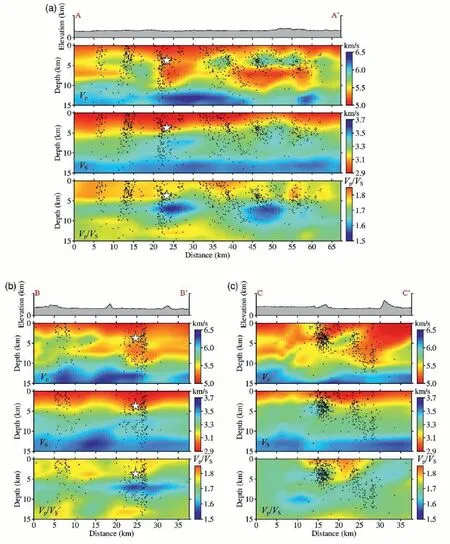
Fig.12.VP, VS, and VP/VS along different vertical profiles.
Previous studies have found that the characteristics of seismicity induced by hydraulic fracturing in different regions are quite different.The maximum magnitude of earthquakes induced by hydraulic fracturing in the western Canada sedimentary basin between 2009 and 2019 wasM4.6(Ghofrani and Atkinson,2020).In the Changning shale gas mining area in the southern Sichuan basin, hydraulic fracturing induced twoM> 5 earthquakes in 2018 and 2019(Lei et al., 2019).The seismic activity induced by water injection is closely related to the regional tectonic background and stress field (Rubinstein and Mahani, 2015; Bao and Eaton,2016).The epicenter of theMS6.0 Luxian earthquake is located at the edge of the P-wave low-velocity anomaly, with the low-velocity region to the northeast and the high-velocity region to the south.The aftershock sequence is distributed along the edge of the anomalous body in the horizontal direction.In Fig.12a, the AA’ profile shows that the aftershock sequence is also located on the edge of the anomaly in the depth direction.In addition, the AA’ and BB’ profiles show that theMS6.0 Luxian earthquake occurred at the transition zone of high- and low-VSanomalies, with a significant low-VP/VSzone below the source(Fig.12a and b).The difference in wave velocity reflects the change in rock properties and strength,and stress concentration is prone to occur in the area where the medium changes dramatically.Combined with the lowb-value in this area,we suggest that this area may have accumulated high stress before theMS6.0 Luxian earthquake, and the nearby hydraulic fracturing triggered the occurrence of the earthquake.
4.Conclusion
We obtained the precise earthquake locations and high-resolution 3DVP,VSandVP/VSmodels in the study area, which provided important information for understanding the seismogenic structure, seismogenic cause and seismogenic environment of theMS6.0 Luxian earthquake.After the relocation, the focal depth of theMS6.0 Luxian earthquake is about 4 km, and its aftershock sequence consists of three seismic bands with different trends.Before theMS6.0 Luxian earthquake, the seismic activity in the source area was mainly located on the west side of the shale gas well, while the aftershock sequence of theMS6.0 Luxian earthquake extended from the location of foreshocks to the east side of the well.We speculate that the hydraulic fracturing activity may first lead to the activation of the western end of the nearby seismogenic fault,and then extend eastward to trigger theMS6.0 Luxian earthquake.
The time period of obvious increase ofbvalue in the study area is consistent with the wastewater injection and hydraulic fracturing activities in this area, which reflects the influence of industrial activities on seismic activity in this area.There are also significant differences in the spatial distribution ofb-values within the study area, reflecting differences in stress accumulation and media properties in different regions.
TheMS6.0 Luxian earthquake occurred at the transition zone of highand low-velocity anomalies, and the aftershock sequence distributed along the edge of low-VPzone, reflecting the influence of the tectonic environment on seismic activity.Based on the spatiotemporal migration characteristics of seismic activity after relocation and the spatiotemporal changes of b-values, we infer that seismic activity in the study area is caused by the activation of pre-existing hidden faults under certain tectonic and stress environments.
Author agreement and acknowledgment
This research is supported by the Fundamental Research Funds for the Institute of Earthquake Forecasting, China Earthquake Administration(CEAIEF20220211 and CEAIEF20220401).We would like to thank the Associate Editor and anonymous reviewers for their constructive comments.The tomoDDMC software is provided by Professor Haijiang Zhang from the University of Science and Technology of China.The figures were drawn using the GMT software.The content, methods, procedures, and basic requirements of the relevant technical methods mentioned in the paper are from the monograph "Guidelines for Seismic Scientific Investigation"(ISBN:978-7-5028-5440-9).
Declaration of competing interest
The authors declare that they have no known competing financial interests or personal relationships that could have appeared to influence the work reported in this paper.
 Earthquake Research Advances2023年4期
- Earthquake Research Advances的其它文章
- Rapid report of seismic damage to hospitals in the 2023 Turkey earthquake sequences
- Rupture process of the January 8, 2022, Menyuan M 6.9 earthquake
- Propagation of crust deformation anomalies related to the Menyuan MS 6.9 earthquake
- Trade space for time for inspecting an earthquake cycle by modern seismological observation:The central-southern part of the Sichuan-Yunnan rhombic block
- Earthquake geochemical scientific expedition and research
- Introduction to the recently published treatise entitled A Guidebook to Earthquake Scientific Investigation