
Trade space for time for inspecting an earthquake cycle by modern seismological observation:The central-southern part of the Sichuan-Yunnan rhombic block
2024-01-08 06:00YueLiuZhongliangWuPengWangZhigangShaoYongxianZhang
Earthquake Research Advances 2023年4期
Yue Liu, Zhongliang Wu, Peng Wang, Zhigang Shao, Yongxian Zhang
Institute of Earthquake Forecasting, China Earthquake Administration, 100036, Beijing, China
Keywords:
ABSTRACT The central-southern part of the eastern border of the Sichuan-Yunnan rhombic block provides the research strategy of ‘trade space for time’ with an interesting fault system, where the segments have similar focal mechanisms and cover almost continuous spectra of elapse rates.We experiment to study the seismological characteristics of different segments with different elapse rates.We employed the de-clustered earthquake catalog for the calculation of b values for each segment.The analysis revealed that different segments have similar b values,which implies that,although different segments have different periods of earthquake recurrence,the'natural time'for the whole fault system elapses with a homogeneous pace.We extended the earthquake potential score (EPS)for nowcasting earthquakes to a quasi-EPS(qEPS).It is found that qEPS increases with the increase of elapse rates,albeit for those fault segments whose elapse rates have exceeded 1, qEPS may better reflect the seismic hazard.
1.Introduction
Investigation of the whole cycle of earthquake recurrence plays an important role in understanding the mechanism of earthquakes and seismic hazards.Such an investigation is difficult because the history of modern seismological and/or geodetic observation(typically decades)is much shorter than the period of earthquake recurrence.As implied by regions with long historic records,such as Turkey(Ambraseys,1971)and China(Shao et al.,2023;Wen et al.,2008;Xu et al.,2005;Zhang et al.,2005), large earthquake recurrence intervals are typically centuries.Large earthquakes often occur non-uniformly in both space and time.However,to confidently investigate earthquake mechanisms and seismic hazards,we do not have to acquire instrumental observations spanning a duration comparable to earthquake recurrence periods.If there happens to be a fault system, composed of several segments, with similar focal mechanisms but different recurrence periods and different elapse rates for each segment,then there would be the opportunity to implement the research strategy ‘trade space for time’ (e.g., Shao et al., 2022; Longair,2003), which will give a reliable analysis.This is similar to what is practiced in astronomy when similar stars/galaxies with different ages are considered together to understand the whole life cycle of a star/galaxy(Longair,2003).
The eastern border of the Sichuan-Yunnan rhombic block seems an interesting place to carry out such an experiment in earthquake science.The fault system,composed of the Xianshuihe fault(XSHF),the Anninghe fault (ANHF), the Zemuhe fault (ZMHF), and the Xiaojiang fault (XJF),from the north to the south, forms the eastern border of the rhombic block, where the China Seismic Experimental Science Site (CSES) is located with strong tectonic activity(Zhang et al.,2003).Fig.1 shows the block boundaries,in which the Sichuan-Yunnan rhombic block is clearly visible and the fault system considered in this study belongs to its eastern border.From a geodynamic perspective, a collision between the Indian plate and the Eurasian plate,which results in the rising of the‘roof of the world’,causes the eastward flow of materials of the Tibetan plateau,and further causes the differential motion of neighboring blocks.Such differential motion leads to a series of left-lateral strike-slip earthquakes as the release of the moment deficit.As a comparison, the Longmenshan fault system,which is also marked in Fig.1,is characterized by its thrust feature,which is consistence with the overall picture of the eastward flow of materials.Seismologists have studied the regional seismicity around the eastern border of the Sichuan-Yunnan rhombic block, including the characteristics ofb-value (Yi et al., 2008), background and cluster characteristics of earthquakes (Jiang and Zhuang, 2010; Xiong et al.,2020), seismic activity and the related stress evolution in numerical geodynamic models(Zhu et al.,2015;Sun et al.,2020;Shao et al.,2016;Xu et al.,2019).
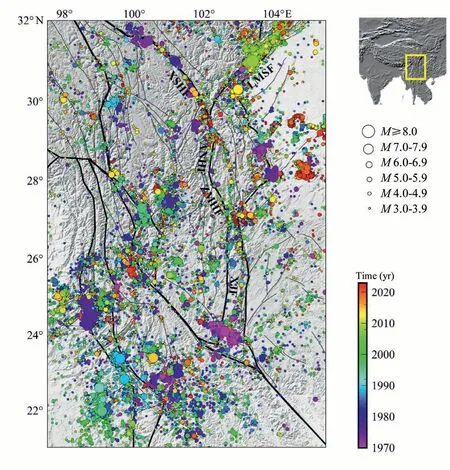
Fig.1.The Sichuan-Yunnan rhombic block (as delineated by the black lines) and earthquakes of ML ≥3.0 from January 1, 1970 to December 31, 2022 (data from China Earthquake Networks Center,CENC),with colors representing the origin time.The indexing map to the top right indicates conceptually the region under study,which is also the region of the China Seismic Experimental Site(CSES, 21°-32°N and 97.5°-105.5°E, Li et al., 2022).Note that for major to great earthquakes which have finite sizes up to hundreds of kilometers,their hypocenters represent the nucleation points of the seismic ruptures.In the figure a few relevant faults are marked as:XSHF–the Xianshuihe fault zone,ANHF–the Anninghe fault zone,ZMHF–the Zemuhe fault zone,XJF–the Xiaojiang fault zone,and LMSF–the Longmenshan fault zone.
Analysis of earthquake catalog from the perspective of statistical seismology is the main topic of this study, in which we highlight two simple approaches: theb-value and the 'nowcasting'.In statistical analysis,the recent idea of'nowcasting'was introduced(Rundle et al.,2016)to define the current state of risk from large earthquakes in a system.Different from the calendar time, natural time (small earthquakes between large earthquakes) was used for a defined seismically active region.Nowcasting methods have been applied to the anticipating occurrence of earthquakes and tsunamis worldwide (e.g., Rundle et al.,2020, 2022; Pasari and Sharma, 2020; Chouliaras et al., 2023).For the CSES region, Zhang et al.(2023a, 2023b) analyzed several strong earthquake potentials retrospectively,implying results from‘nowcasting’may be used to define the earthquake potential.
This study aims to investigate the seismology characteristics and thecurrent state of earthquake potential on the central-southern eastern border of the Sichuan-Yunnan rhombic block throughb-value estimation and the'nowcasting'method.Unlike previous studies(e.g.,Rundle et al.,2020,2021),we analyze the seismic potential state for the fault segments rather than a special region and take different ways to select the target area and the related seismic data used for fitting.Results from this study would make sense for our understanding of earthquake recurrence and seismic hazard.
2.The central-southern part of the eastern border of the Sichuan-Yunnan rhombic block, and its segmentation
The whole fault system of the eastern border of the Sichuan-Yunnan rhombic block is divided into 18 segments according to paleoseismological and geological investigations (Wen, 2000; Papadimitriou et al., 2004; Wen et al., 2008; Shao et al., 2016), in connection to the endeavor of the identification of long-to-intermediate-term (1–2 decades)potential hazardous regions of major to great earthquakes and the assessment of the state and trend of seismicity (Jiang et al., 2017).The related results were used and replenished by later studies in this region(e.g., Yan et al.,2018;Xiong et al.,2020;Kong et al.,2022).
These fault segments have similar strike-slip mechanisms, and have different periods of earthquake recurrence, as shown in Table 1.What interesting is that the 18 segments cover almost continuous spectra of elapse rates(Wang et al.,2022),as shown in Fig.2.The XSHF is divided into ten segments, including the northwestern section (average left-lateral slip rate of 13 mm/a) from segment S1 to S5 and the southeastern section(average left-lateral slip rate of 10 mm/a)from segment S6 to S10 (Papadimitriou et al., 2004; Wen et al., 2008).The strong earthquake recurrence periods range from 69 to 480 years.Taking the S10 segment as an instance, the average recurrence interval of strong earthquakes is 248 ± 70 years, and the last strong earthquake (M73/4)occurred in 1786.Thus, the elapsed time (period since the last strong earthquake)is 236 years until the end of 2022.The elapse rate(Deng and Wen,2008;Xu et al.,2017)is 0.95±0.27 by dividing the elapsed time by the average recurrence cycle(Deng and Wen,2008;Xu et al.,2017;Wang et al.,2022).The ANHF consists of S11(Shimian-Mianning,5 mm/a)and S12(Mianning-Xichang,6.5 mm/a)segments(Xu et al.,2003;Wen et al.,2008).The last large earthquake in S11 is the 1480M71/2 event.TheM6 3/4 earthquake in 1489,theM71/2 earthquake in 1536,and theM63/4 earthquake in 1952 occurred in the S12 section, which has a strong earthquake recurrence period of 63 ± 30 years.The S13 (ZMHF) fault(6.5 mm/a), on the south side of S12, was ruptured by theM63/4 earthquake in 1731 and the M≥71/2 earthquake in 1850 (Xu et al.,2003).The XJF consists of the western and the eastern sub-faults and is divided into five segments from north to south, which are the S14(Qiaojia-Dongchuan), S15 (Songming-Yiliang), S16 (Jiangchuan-Tonghai),S17(Huaning-Mile)and S18(Jianshui)segments(Wen et al.,2017)as listed in Table 1 in detail.
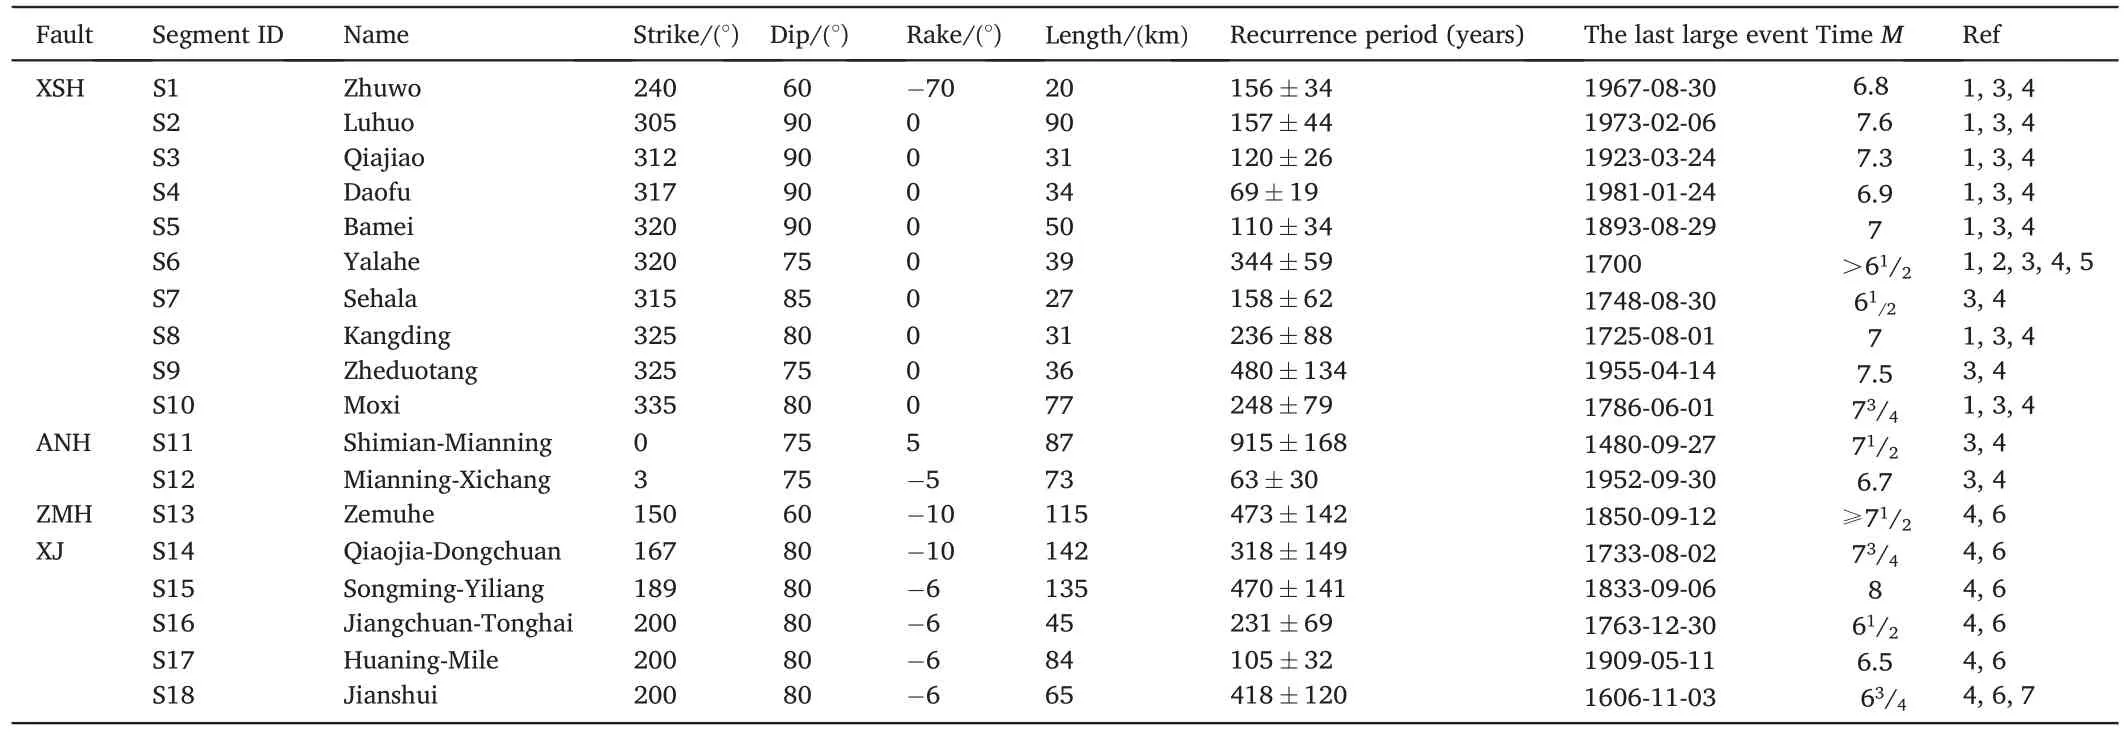
Table 1Segments of the eastern border of the Sichuan-Yunnan rhombic block and related parameters.
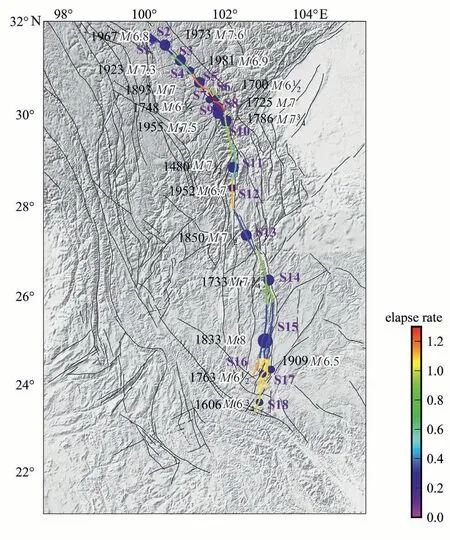
Fig.2.The last large earthquake and elapse rate for each segment of the eastern border of the Sichuan-Yunnan rhombic block.Colors represent the elapse rate,and white dots with black edges are the last large earthquakes, including strong, major, or great earthquakes, depending on the segment.From the figure it may be seen that the eastern border of the Sichuan-Yunnan rhombic block covers almost a continuous spectra of elapse rates.
Fig.3 shows this fault system as well as the segments,together with the sub-regions for the analysis of seismicity in this study.Due to the number of earthquakes available in each segment, the central-southern part of this giant fault system is better for a reliable estimate of seismicity parameters.This sample set thus includes the S10,S11,and S13 to S18 segments.In these segments,S16 and S17 are parallel to each other,and the segments for seismicity analysis have some overlaps.These samples of segments also cover a nearly continuous spectrum of recurrence periods and elapse rates.From Appendix I it may be seen that seismicity is mainly distributed around the position of the fault segment,with a Gaussian-like distribution.Considering the accuracy of the routine network location of earthquakes and the geological location of the fault segments as well as their fault zone,the seismicity subject to analysis can be regarded as the seismicity within the fault zone of the corresponding fault.Operationally, only the earthquakes falling within the Gaussianlike curve centered at the fault segments were selected for the analysis.
Fig.3.The segments of the eastern border of the Sichuan-Yunnan rhombic block with the distribution of declustered earthquakes with M ≥3.0 from January 1,1970 to May 11,2008(data from:http://www.cses.ac.cn/wp-content/uploads/2019/05/cat_chuandian1.txt).In the figure,colors represent the probability for an event to be a background one (or, not being an aftershock of some previous events).The sub-regions for the analysis of seismicity are centered at the eastern border and extending 100 km along the east-west direction.The marks of each segment are consistent with those in Table 1.
3.The Gutenberg-Richter b-value for different segments
One of the motives of this study is to take the‘snapshots’of different stages of an earthquake cycle, that is, to inspect the seismological features (within the recent half-century) and investigate whether they can reflect the elapse-rate-dependent variation.One of the naturally thinkable seismological parameters is the Gutenberg-Richterb-value,which is believed to be a manifestation of the stress state.It was known that just after the large earthquake theb-value tends to be higher,which has to be eliminated from the analysis,although it may reflect the healing process.It was hypothesized that before the next large earthquake, theb-value should have a decreasing process, which was shown to be not the case(see below), probably due to the number of samples and the time duration taken for the analysis,which leads to different results using different spatiotemporal grids(e.g.,Yi et al.,2008).
To avoid the influence of aftershock sequences as mentioned above,we use the de-clustered earthquake catalog (Jiang and Zhuang, 2010)from 1970 to 2008 before the Wenchuan earthquake, which was provided by Jiang (2021) by using the epidemic-type aftershock sequence(ETAS)model(Ogata,1988,1998,2011;Zhuang et al.,2004;Ogata and Zhuang, 2006).The model provides the analysis with a probability for each event to be an independent event(or background event),hereafter referred to as‘background probability’(see Appendix V).Fig.3 shows the spatial distribution of these events, with colors representing the background probability of each event.This background probability,according to Zhuang et al.(2004), is used as a weight in the most-likelihood estimate of the Gutenberg-Richterb-value.
Another efficient tool for displaying the power law scaling(Gutenberg-Richter law) is the Zipf distribution,which has been widely used in various fields (Li, 2002) and is one of the efficient tools for displaying the power law scaling.In the processing, the data subject to analysis is ordered from large to small values, and the rank versus the quantity is plotted in a double log plot.For earthquakes, due to the definition of magnitude which is the logarithm (or the order of magnitudes)of the seismic moment or radiated energy,the rank-ordering plot naturally becomes a single log.It has been proved(Sornette et al.,1996)that if a power law distribution exists, the rank-ordering plot exhibits a linear distribution.For the cases of a few data samples,the rank-ordering analysis may avoid the imbalance between the numerous data points of small values and the few data points of important large values,which is consistence with the idea of the likelihood estimation of theb-value(Aki,1965).Meanwhile, rank-ordering analysis is an efficient tool to differentiate the power law scaling and the few outliers (Pisarenko and Sornette,2012).
Fig.4 shows, for S13 and S18, respectively, the rank-ordering plots for the events with background probability larger than 0.8,0.6,0.4,and 0.2, respectively, and for all the events as well, while the rank-ordering plots for other segments are shown in Appendix II.These are two typical examples of the size distribution of seismic events.For S13, a single power law can be identified, albeit the large events have some fluctuations around the power law,most likely due to the lack of samples.For S18,the large events deviate apparently from the power law of data with background probability larger than 0.2,similar to the'outlier'or the'dragon king' behavior (Sornette and Ouillon, 2012), but due to the limited time duration of the earthquake catalog,it is hard to discriminate whether it reflects a real'dragon king'.In both cases,we consider only the samples which exhibit a clear power law distribution.The β-value can be estimated by the formula of Zhuang et al.(2004), which uses the background probability as a weight in calculating the mean magnitude
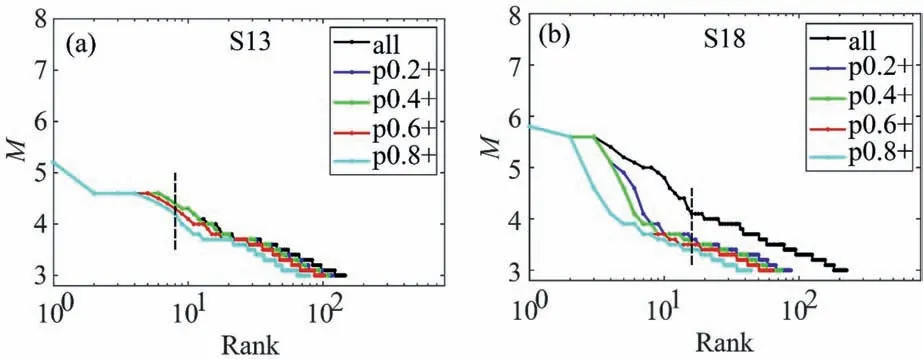
Fig.4.Rank-ordering plot for segments S13 (a) and S18 (b), respectively.Colors represent data with different thresholds of background probability used in the rank-ordering plot,that'all'means all earthquakes are selected, marked by black curve; 'p0.2+' represents earthquakes with background probability no less than 0.2 are used, as plotted in blue.Results for'p0.4+', 'p0.6+' and 'p0.8+' are shown in green, red and cyan curves, respectively, in a similar way as above.The data on the right side of the black dashed line, that is, data exhibiting a power-law distribution,are used to calculate the b-value, using the mostlikelihood estimate weighted by the background probability.
where φiis the possibility of theith earthquake being a backgroundevent.The Gutenberg-Richterb-value and its deviation are thus
The calculations ofbvalues strongly rely on the choice of cut-off magnitude (Harte, 2016).In this study, the minimum earthquake magnitude is set as 3.0,which is higher than the completeness magnitude(Jiang, 2021; Jiang and Zhuang, 2010).Besides, the choice of region selection is also an important issue in the calculation ofbvalues (Gulia and Wiemer, 2019; Dascher-Cousineau et al., 2019).In this study, we selected earthquakes falling within the Gaussian-like curve centered at the fault segments for fitting.Fig.5 shows thebvalues obtained with only the events exhibiting a power-law scaling(Appendix II),of the segments considered versus their period of recurrence and elapse rates, respectively.bvalues are shown in Table 2.It may be seen that thebvalues are basically consistent with each other, despite the periods of recurrence and the elapse rates being different.

Table 2b-value for the fault segments and its deviation.
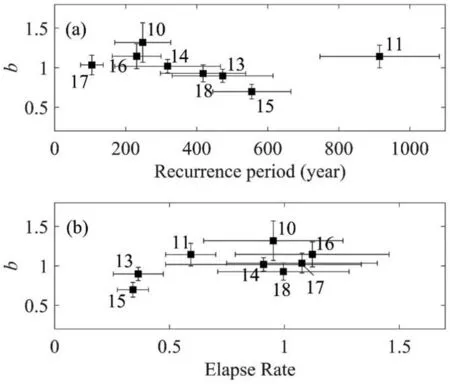
Fig.5.b-values for segments S10 to S18 (excluding S12) with different recurrence periods (a) and different elapse rates (b).To minimize the impact of limited earthquake data availability, the analysis narrows down its focus to the central-southern part of the giant fault zone and excludes the segment S12,specifically segments S10, S11 and S13 to S18.Uncertainties of recurrence periods are from published literature, while the uncertainty of the b-value is estimated with real data weighted by background probability.
4.The earthquake potential score (EPS) for different segments
The result that for different segments, thebvalues are stable and consistent with each other, although somehow different from our expectation,has on the other hand clear implication for the‘nowcasting’analysis (Varotsos et al., 2005, 2011; Rundle et al., 2016, 2018, 2021;Luginbuhl et al., 2018).In the 'nowcasting' approach the magnitude of the target events is denoted asMλand the magnitude of small earthquakes asMσ, which has to be larger than the completeness magnitude.The average number of small earthquakes larger thanMσand less thanMλis described by the Gutenberg-Richter frequency-magnitude scaling,that ifNσis the average number of the small earthquakes greater thanMσ,andNλis the average number of the large (target) earthquakes greater thanMλ, then
The average number of small earthquakesNbetween large earthquakes is thus:
In the 'nowcasting' approach (Rundle et al., 2016, 2018, 2021), the potential for large earthquakes (the target events) is calculated by the cumulative distribution function (CDF) counting the small events with magnitude larger thanMσand less thanMλ.The current value of CDF,p[n≤n(t)],using the current count of small earthquakesn(t)at timet,can be obtained.In the above counting,tis the calendar time since the last target earthquake.But remarkably such a counting leads to another kind of'time',the'natural time'(Varotsos et al.,2005,2011)since the last large earthquake.The earthquake potential score (EPS) at calendar timetis defined by(Rundle et al.,2016,2018,2021):
which increases with time since the last large earthquake and resets to zero when the next large earthquake occurs.
Considering the real situation of seismic data, the ‘classical’EPS(Rundle et al., 2016, 2018, 2021) has to have some variations, that theEPScalculated from a limited time duration (in this paper,since 1970),T0,has to be mapped on to a longer time,T1,since the last strong to great earthquake in the related segment.Similar to Rundle et al.(2020), we consider the factorT1/T0to multiply the calculatedEPSwith a 'cutoff date' of January 1, 1970.In such a variation, one of the underlying assumptions is that, for a long calendar time, the 'natural time' remains homogeneous.Meanwhile,considering the uncertainty of the recurrence period,the upper bound and the lower bound ofEPScan be obtained by timing(T1+ΔT)/T0and(T1–ΔT)/T0,respectively,in which ΔTis obtained by multiplying the valueT1by the relative error of the recurrence period.
Fig.6 shows, for segment S18, the estimation ofEPS, which is consistent with the study of Cheng et al.(2023).The results of other segments are presented in Appendix III.The calculation is similar to the‘classical’(Rundle et al.,2016,2018,2021),but with two variations.The first is the selection of the spatial range which is consistent with the segments but different from the‘classical’in which a circle centered at a specific site is taken.The seismicity located within the fault zone of the relevant fault is selected for calculation, which means that seismicity with a Gaussian-like distribution is used.The second is the 'mapping' to longer time scales, meanwhile giving the upper bond and the lower bond of theEPS.If the upper bound exceeds 100%, we simply take 100%.In this sense, theEPSobtained in the present study may be called quasi-EPS,or qEPSin short.Compared to the ‘enhanced nowcasting’ approach(Rundle et al., 2020), the qEPSshares the same idea that the seismicity before and after the ‘cutoff date ’(on which the earthquake recordings became significantly improved) kept the same rate, but we are not sure whether or not the mapping of the uncertainty of the recurrence period onto the time of the last earthquake in the qEPScalculation is valid.Most importantly, we take the fault segment itself, rather than a specific site and its surrounding regions as what has been taken in the classical nowcasting approaches.Appendix IV provides the sensitivity test of theEPSestimates in two ways,with one way similar to the previous works,varying the cutoff magnitude,and the other way somehow different from the previous works,to use a de-clustered catalog for theEPSestimation.For consistency of the data subject to analysis,the latter reflects the state at the time of May 11, 2008.Table 3 lists by order theEPSof different segments.
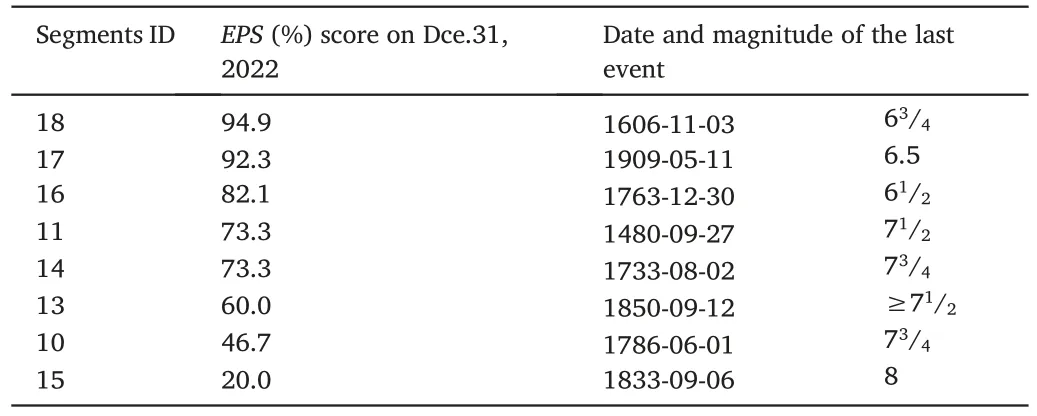
Table 3Ranked earthquake potential scores for segments of the central-southern part of the eastern border.
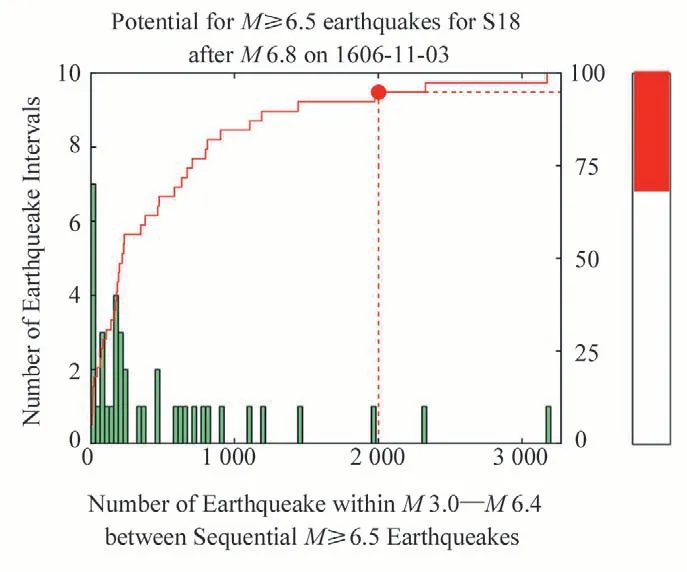
Fig.6.qEPS estimation for segments S18.Green bars are the histogram of the number of small earthquakes between M3.0-b6.4 earthquakes in the CSES region from January 1, 1970 to December 31, 2022.The red curve is the cumulative probability.The red dot represents the current potential for M≥6.5 earthquakes,located along the fault within the region extended west of 70 km to the east of 70 km (see Fig.3), since the last M 6.5 event on November 3, 1606(see Fig.2).The color bar in the right shows the range of the qEPS.
Fig.7 shows the qEPSfor different segments with different elapse rates.It may be seen that the qEPShave a positive correlation with the elapse rate,that qEPSincreases with the elapse rates.On the other hand,for those fault segments whose elapse rates have exceeded 1, qEPSmay better reflect the seismic hazard.Physically, when the elapse rates are equal to or exceeding 1,it means that the related segment'should' have been broken.However, in the real world, these 'expected' earthquakes have not occurred.Seen from the perspective of qEPS,even if the elapse rates indicate that the next earthquake is imminent,the'natural time'still provides another index for the hazard of the next earthquake.Whether this index has the potential contribution to the forecast of earthquakes needs to be falsified by real data.Remarkably, S16 to S18, that is, the southern part of the eastern border of the Sichuan-Yunnan rhombic block,seem to be closer to the next large earthquake.
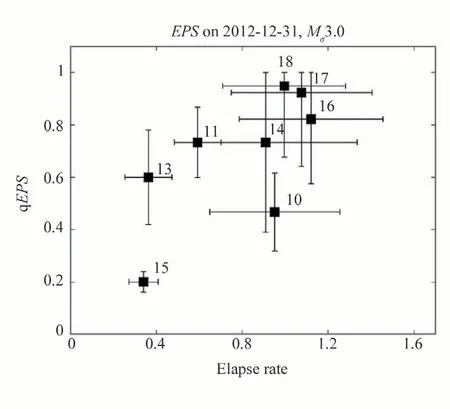
Fig.7.qEPS for different segments with different elapse rates.To minimize the impact of limited earthquake data availability, the analysis narrows down its focus to the central-southern part of the giant fault zone, specifically segments S10 to S18 (excluding S12).
5.Conclusions and discussion
Investigation of the whole cycle of earthquake recurrence is difficult because the history of modern seismological observation (typically decades, for the region under study, since 1970) is much shorter than the period of earthquake recurrence (typically centuries).The centralsouthern part of the eastern border of the Sichuan-Yunnan rhombic block, with similar focal mechanisms but different recurrence periods and different elapse rates for each segment, provides the investigation with the opportunity to implement the research strategy‘trade space for time’.For this giant fault system, we performed an experiment to study the seismological properties of different segments with different recurrence periods and elapse rates and found that different segments have similarb-values.It implies that, although different segments have different periods of earthquake recurrence and different elapse rates,the‘natural time’ for the whole fault system basically elapses with a homogeneous rhythm, which provides ‘nowcasting earthquakes’ with conveniences in operation.Considering the real situation of earthquake catalogs, we proposed some variations to the calculation of earthquake potential score(EPS)which is noted as qEPS.qEPSand elapse rate seem to have a positive correlation.This may reflect the duality of an earthquake cycle that both the waiting time of large (target) events and the rates of small events contribute to the process of earthquake recurrence,albeit the‘natural time’seems to be a better presentation of the process.
Declaration of competing interest
The authors declare that they have no known competing financial interests or personal relationships that could have appeared to influence the work reported in this paper.
Author agreement and Acknowledgment
I would like to declare on behalf of my co-authors that the work described was original research that has not been published previously,and is not under consideration for publication elsewhere,in whole or in part.All the authors listed have approved the manuscript that is enclosed.
This work is supported by the National Natural Science Foundation of China (NSFC, grant number U2039207).Thanks are due to Prof.J.B.Rundle(University of California,Davis)for advice in nowcasting,to Prof.Jiancang Zhuang (Institute of Statistics and Mathematics, Tokyo) for advice in using the ETAS model, and to Prof.Zaisen Jiang (Institute of Earthquake Forecasting, China Earthquake Administration, Beijing) for advice in understanding the recurrence behaviors of the fault system.Discussions with Xiaojian Lv,Junlong Zhang,Wenqiao Li,Renwei Xiong,and Xiaoxia Liu (Institute of Earthquake Forecasting, China Earthquake Administration, Beijing) helped in improving the manuscript.The authors appreciate the comments and suggestions from the anonymous reviewers and the editors, which have greatly improved the article.Special thank is due to Ms.Qin Xu, the editorial office ofERA, for the invitation to the present special issue and help in polishing the language.
Appendix A.Supplementary data
Supplementary data to this article can be found online at https://doi.org/10.1016/j.eqrea.2023.100254.
 Earthquake Research Advances2023年4期
- Earthquake Research Advances的其它文章
- Rapid report of seismic damage to hospitals in the 2023 Turkey earthquake sequences
- Rupture process of the January 8, 2022, Menyuan M 6.9 earthquake
- Seismicity and seismogenic mechanism of the MS 6.0 Luxian earthquake on September 16, 2021
- Propagation of crust deformation anomalies related to the Menyuan MS 6.9 earthquake
- Earthquake geochemical scientific expedition and research
- Introduction to the recently published treatise entitled A Guidebook to Earthquake Scientific Investigation