
Propagation of crust deformation anomalies related to the Menyuan MS 6.9 earthquake
2024-01-08 06:00AnfuNiuChongYueZhengyiYunJingZhoWeiYnYunLi
Earthquake Research Advances 2023年4期
Anfu Niu, Chong Yue, Zhengyi Yun, Jing Zho, Wei Yn, Yun Li
a China Earthquake Networks Center, Beijing, 100045, China
b The First Monitoring and Application Center, Tianjin, 300180, China
Keywords:
ABSTRACT Decoding the variation laws of the deformation field before strong earthquakes has long been recognized as an essential issue in earthquake prediction research.In this paper, the temporal and spatial distribution characteristics of deformation anomalies in the northeastern margin of the Qinghai-Tibetan Plateau before and after the Menyuan MS 6.9 earthquake were studied by using the Fisher statistical test method.By analyzing the characteristics of these anomalies, we found that:1)The deformation anomalies are mainly distributed in the marginal front area of the Qinghai-Tibetan Plateau, where short-term deformation anomalies are prone to occur due to a high gradient of gravity; 2) The deformation anomalies along the northeastern margin of the Qinghai-Tibetan Plateau are characterized by spatial propagation, and the migration rate is about 2.4 km/d.The propagation pattern is counterclockwise, consistent with the migration direction of MS ≥6.0 earthquakes; 3) The time and location of the Menyuan earthquake are related to the group migration of earthquakes with MS ≥6.0.Finally,based on the results of gravity field variation and the theory of crust stress wave,the law of deformation anomaly distribution was discussed.We suggest that both the deformation propagation along the northeastern margin of the Qinghai-Tibetan Plateau and the earthquake migration are possibly associated with the variation of the stress field caused by subsurface mass flow.
1.Introduction
The coseismic deformation caused by an earthquake is closely related to the dislocation of the seismogenic fault, and thus the mechanism of fault rupture can be studied by measuring the co-seismic deformation(Xu X.et al., 2008; Xu C.et al., 2011; Gai et al., 2022).Based on this idea,numerous scholars suggested that the deformation precursor observed before an earthquake is also caused by the seismogenic fault movement,and the pre-slip or exponential acceleration anomaly of the fault should be observed near the epicenter(Rice and Rudnicki,1979).In fact,due to the locking effect, the deformation in the epicentral area may become smaller and smaller,and the number of anomalies will gradually decrease as earthquakes occur nearby(Takemoto,1991;Bilham,2005;Johnston,2006;Amoruso and Crescentini,2010;Li et al.,2016;Niu et al.,2022a).Therefore, the earthquake precursors observed using instruments may not be induced by the seismogenic fault movements, but by other dynamic factors.Therefore,it is significant to recognize the mechanism of deformation anomalies before earthquakes.
The MenyuanMS6.9 earthquake occurred on January 8, 2022, in Qinghai Province,with a focal depth of 10 km.The epicenter is located in the northern part of the Qilian-Qaidam sub-block, which belongs to the intersection of the Tuolaishan and the Lenglongling fault zones,an area mainly characterized by sinistral strike-slip movement with local dip-slip components (Gai et al., 2022).Four anomalies, including the NS tilt on the vertical pendulum at Songpan station, the borehole EW tilt at Liangshui station, the borehole NS tilt at Gaotai, and the NS tilt on the vertical pendulum at Anxi station, have been observed before and after the Menyuan earthquake.Through Fisher statistical test, we extracted similar abnormal characteristics and found the propagation law of the anomalies.However, what is the reason for the propagation of deformation anomalies? What is the relationship between the propagation and the occurrence of the Menyuan earthquake? All these questions remain to be answered.
1.1. Data and methods
The study area is situated in the north of the Qinghai-Tibetan Plateau,including the Bayan Har, the Qaidam and the Qilian blocks and their surrounding areas (Fig.1).The southern boundary of the Bayan Har block is the Ganzê-Yushu-Xianshuihe fault zone, which is an NW sinistral strike-slip fault zone (Zhang et al., 2003).The fault zone is considered an important boundary controlling the eastward movement of the Qinghai-Tibetan Plateau (Molnar and Lyon-Caen, 1989).Furthermore, this area is a tectonically independent region with deep mass flow or mantle convection activity (Zhao et al., 2013).

Fig.1.Map showing the distribution of deformation anomalies and MS ≥6.0 earthquakes, with the gravity anomaly field (2016–2021) as background.
1) Seismic data
In order to analyze the deformation and earthquake migration in the region, the distribution ofMS≥6.0 earthquakes from the beginning of 2021 to April 2022 was discussed.In addition,we used the catalog from the China Earthquake Networks Center (https://data.earthquake.cn/c zdzml/index.html), which contains mostMS≥5.5 earthquakes (Chen et al.,2009).
2) Continuous deformation data
There are more than 30 continuous tilt observation stations in the northeastern part of the Qinghai-Tibetan Plateau and its surrounding areas.Since the occurrence of the MadoiMS7.4 earthquake in 2021, in total four tilt anomalies have been observed,including the NS tilt on the vertical pendulum at Songpan station,the borehole EW tilt at Liangshui station, the borehole NS tilt at Gaotai station and the NS tilt on the vertical pendulum at Anxi station.Fig.1 shows the distribution of anomalous tilt observation stations and related earthquakes.
Anxi station is located in the Altun seismotectonic zone,about 560 km away from the epicenter of the Menyuan earthquake.The vertical pendulum tilt meter at Anxi station has been calibrated several times since April 16, 2021.However, due to the influence of the Madoi earthquake on the stability of the instrument, the data recorded from April to June, 2021 were poor.Since the early July of 2021, the observation system has returned to its working order, and the anomaly from November 2021 to the Menyuan earthquake was reliable(Fig.2 a).

Fig.2.Curves of anomalous tilts observed at the four stations.
Gaotai station is located in the northern margin of the Qinghai-Tibetan block, which is also the middle segment of the rift zone in the northern margin of the Qilian Mountain.The station is ~220 km away from the epicenter of the Menyuan earthquake.The tilt anomaly appeared in early October 2021,with a tilt rate of ~25 ms/d(Fig.2 b).
Liangshui station is located in the northern part of the North-South Seismic Belt, which belongs to the west wing of the front arc of the Longnan arc-type tectonic belt.This station is ~560 km away from the epicenter of the Menyuan earthquake.The tilt NS anomaly recorded at the station began after the Madoi earthquake,and the tilt rate increased significantly until the occurrence of the Menyuan earthquake (Fig.2 c).
Songpan Station is situated at the eastern boundary of the Bayan Har Block, on the Huya Fault, a branch of the Longmenshan fault zone.The anomaly appeared at the end of September 2020, accelerating tilt from north to south.The tilt degree weakened at the end of January 2021(Fig.2d).The anomaly amplitude is ~1300 ms,with a duration of ~110 days.The station is ~570 km ~620 km away from the epicenters of the Madoi and Menyuan earthquakes.Niu et al.(2022b)and suggested that there was a correlation between the anomaly and the Madoi 7.4 earthquake.
In this study we collected and collated the hourly value data of the above abnormalities from 2018 to the end of April 2022.Through preprocessing, some high-frequency disturbance anomalies were filtered out,and finally relatively reliable deformation anomalies were obtained(Fig.2).
3) Extraction method for abnormal deformation
The abnormal deformation can reveal the transient variation of the crustal stress field,which contains the information of amplitude and frequency characteristics.Usually, the extraction method for obtaining anomaly information is based on the amplitude characteristics.In this study, the characteristics of amplitude and frequency are considered simultaneously, according to the idea of dynamic field analysis(Gitis,1995).
The dynamic field analysis is a status test method based on Fisher statistics.With the support of dynamic field analysis, the data used can be standardized.In this study,the data in 2018 were selected as normal, and the Fisher statistic test was normalized by taking the limit(Niu et al., 1998).
Assumed the observed data {xi}at each station is ad-dimension vector time series,taking the normal interval fromN1toN2,and the interval lengthn1=N2-N1+1.The mean value of the vector in the interval isX0,and the covariance isC0,that's a matrix of orderd×d.For each sliding interval fromL1toL2,the sliding interval lengthn2=L2-L1+1,the mean value isX1,and the covariance matrix isC1,and the covariance matrixCis constructed using Equa.(1):
The Makhahnobis distance is defined as:
After normalizingD,we get:
The statisticFfollows the Fisher distributionF(d,n2+n1- d - 1).If a confidence levelp= 95% is given, a confidence thresholdFpcan be obtained.IfF>Fp, it is accepted as an anomaly, otherwise it is normal.The general characteristics ofFdistribution can be derived from statistics.WhenN→ ∞(N> 120), that is,Fp(d,N) →Fp(d), the larger the d,the smaller theFp(d),reflecting the limit value of the stable status of the system.
The AF value that represents the anomaly intensity is defined as:
where theAFvalues are the corresponding normalized time series.In order to reduce the impact of the annual period, the standard period is set to 1 year, and the sliding period is set to 1 month.
According to the tilt observation data in this study,dis set to 1, and the correspondingAFvalue series is obtained, as shown in Fig.3.TheAFtime series are arranged clockwise, according to the position of the station at the northeast edge front.Notably, except that theAFanomaly of the Anxi station from April to June 2021 is mainly related to the instrument stability factor, theAFanomaly characteristics at the four stations are basically similar, with an anomaly duration of ~5 months.The anomaly was first observed at Songpan station, followed by Liangshui and Gaotai stations, and finally at Anxi station.Thus, the counterclockwise migration of tilt anomalies along the northeastern margin of the Qinghai-Tibetan Plateau was unveiled.The occurrence moments of the MadoiMS7.4 earthquake, LuxianMS6.0 earthquake, MenyuanMS6.9 earthquake and DelinghaMS6.0 earthquake are marked in Fig.3,without the limitation of the distance between the deformation anomaly sites and the epicenters.
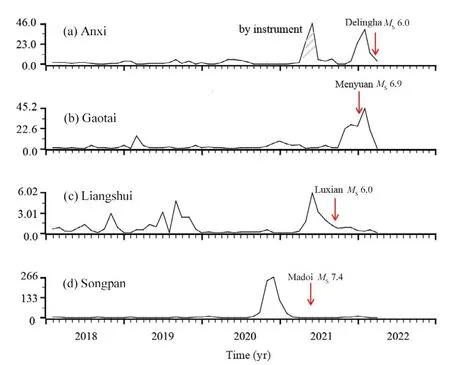
Fig.3.Fisher test curves for tilt data observed at stations with anomalies.
2.Discussion
It is well accepted that the Qinghai-Tibetan Plateau is formed by the collision and compression between the Indian plate and the Eurasian plate; however, a simple collision model and the SW-NE compression cannot completely explain the complex geological structures therein.Therefore, other geodynamic factors, especially mantle dynamic pro-cesses, have gradually attracted scholar's attention.Gravity has always been a traditional means and an important source of data for the study of mantle convection.Fu et al.(1994) developed a set of equations related to regional gravity anomalies and the small-scale convection in the upper mantle and directly used gravity anomalies to study the shape of small-scale convection in the upper mantle as well as the convective drag force field at the bottom of the lithosphere.Based on this information, they finally delineated the deep structure beneath the Qinghai-Tibetan Plateau and nearby regions, providing indirect evidence for the existence of mantle upwelling in the central and northern Qinghai-Tibetan Plateau.Xiong et al.(2005) calculated the mantle convection stress field in the Qinghai-Tibetan Plateau and its adjacent areas using surface gravity anomaly.The convective stress field produced by mantle con-vection at the bottom of the lithosphere is also one of the most important mechanical effects on lithospheric deformation and the uplift of the Plateau.Although it is generally believed that horizontal stress does not produce considerable flexural deformation of the rock layer, it will lead to significant stress accumulation in the rock layer,which makes the plateau rock layer more prone to deformation under the action of vertical stress.The subsurface mass flows in the lower crust have different pe-riods related to the mass flow volume, which can possibly be detected by surface observation instruments.
1) Deformation propagation
Crustal deformation is closely related to the change of stress field,which includes absolute stress and transient stress.Absolute stress is usually caused by long-term (geological) tectonic movements.It is well acknowledged that there is a deterministic linear relationship between absolute stress and absolute strain.Transient stress, also known as dynamic stress,mainly comes from the crustal stress process associated with the rheology of deep crustal media,as well as the short-term interaction of the crust,such as seismic and volcanic activities,etc.Transient stress fluctuates greatly.Transient stress and strain can switch rapidly,without showing a constant relationship with each other.Slow earthquakes with periods ranging from tens of seconds to several hours or even several days and long-period deformation waves with periods ranging from several days to several months are the results of transient stress field (Scholz,1977; Feng et al., 1984; Niu et al., 2022b).Some existing deformation observation methods, such as tilt, strain, gravity and global navigation satellite system (GNSS), can be used to reflect the transient stress field changes.
The outputSof the deformation observation signal at each stationxcan be divided into (1) deformation near the station subject to tectonic activity,mainly some long-term changes caused by tectonic force and coseismic changes induced by recent earthquakes, which are represented bySsandSn, respectively; (2) stress wavesSwexisting in the crust,including seismic waves, tidal waves, and long-period stress waves; (3)InterferenceSdcaused by changes in observation instruments, site environment, and meteorological environment.Therefore,Scan be expressed as:
The stress waveSwrecorded by the instrument is mainly realized by the instrument gainKjof every periodic waveAjcoswhich is written as:
Wherevis the rate of deformation migration,ωjis the angular frequency,and φjis the initial phase of thej-thwave.
The concept of deformation or stress wave was initially proposed in the 1970s.It was mainly believed that both earthquake migration and deformation propagation were affected by deep material flow, and that deformation propagation front can trigger earthquakes (Scholz, 1977;Feng et al.,1984).However,the spatio-temporal resolution for revealing subsurface material flow is still low (Bao et al.,2015;Zhao et al.,2013;Barbot, 2020), and thus the study of stress wave is limited (Niu et al.,2022b).In addition, some studies have shown that there is a closer relationship between the stress wave and the deep mass flow (Savage,1971; Bott and Dean, 1973; Scholz, 1977; Feng et al., 1984; Wang and Yin,1989;Niu et al.,1995;Zhang et al.,2003).
The results shown in Fig.3 indicate that the deformation propagation along the northeastern margin of the Qinghai-Tibetan Plateau can be detected.According to the time delay of anomaly and the projection distance on the front arc of the northeast margin, the deformation propagation rate is estimated to be about 74 km/month,that is,v=~2.4 km/d, which is close to the pre-earthquake deformation migration rate estimated before some earthquakes(Scholz,1977;Niu et al.,1995).
2) Earthquake migration
Earthquake migration refers to the sequential occurrence of earthquakes along a direction, which is an orderly occurrence in the overall disordered seismic activities.Some studies have shown that earthquake migration often has different characteristics at different temporal and spatial scales (Scholz, 1977; Wang and Zhang, 1995; Xu, 2005; Zhao et al., 2020).For instance, Scholz (1977) analyzed the phenomenon of earthquake migration and deformation migration before the February 4,1975 HaichengMS7.3 earthquake, suggesting that the migration of strong earthquakes in North China is along the NE direction.Xu (2005)found that the strong earthquake in the southeast coastal area of China has the seismotectonic characteristics of a circular ring of 10°, with a diameter of approximately 1000 km,and the strong earthquake activity in the southeast coastal ring area is complementary to that in the inland area of the Chinese mainland.Earthquake migration exists on different scales, which is the result of fault interaction, seismic stress triggering,lithosphere-scale deformation wave propagation and several other factors (Zhao et al., 2020).Yuan et al.(2020) probed the spatio-temporal migration characteristics, mechanism and future development trend ofMS≥7.0 earthquakes in the Qinghai-Tibetan block.The results showed that the strong earthquakes are clustered according to occurrence time and zoned in space.Wang and Zhang(1995)considered that earthquake migration was controlled by network-like plastic flow in the lower lithospheric crust.
In addition to the migration features described above, we find that theMS≥ 6.0 earthquakes after the MadoiMS7.4 earthquake are characterized by migration along an elliptical or circular path.It can be seen from Fig.1 that 4 earthquakes are distributed over an ellipse with a major axis of ~1350 km and a minor axis of ~440 km, and the migration is counterclockwise.Some follow-up studies have found that theMS≥ 6.0 earthquakes in the Qinghai-Tibetan Plateau migrate counterclockwise in groups.Fig.4 shows the distribution of theMS≥ 6.0 earthquakes from 2021 to the occurrence of the Mengyuan earthquake.
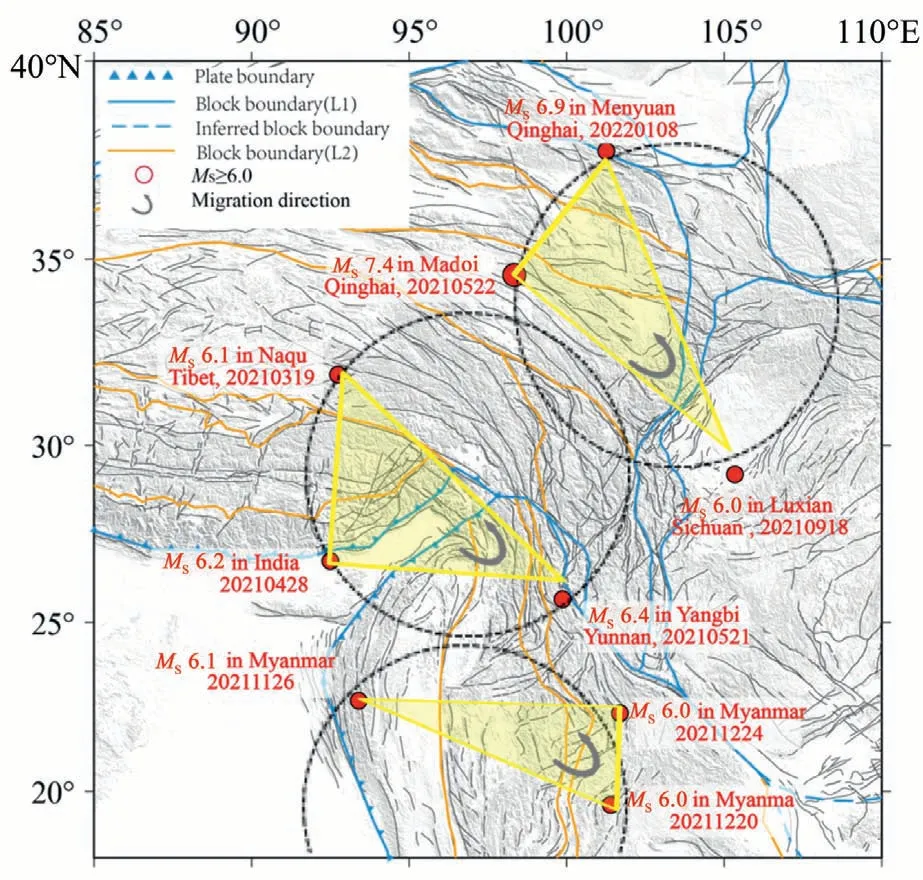
Fig.4.Clustering and migration of the MS ≥6.0 earthquakes in the Qinghai-Tibetan Plateau and its adjacent areas.
According to Fig.4, theMS≥ 6.0 earthquakes that occurred in the study area can be divided into three groups.In each seismic group, the time intervals among the earthquakes are close, and the distribution pattern shows a nearly right triangle in space.Namely, the earthquakes in each group are basically distributed on a same circle with a diameter of 950– 1 030 km.The characteristics of seismic groups are shown in Table 1.
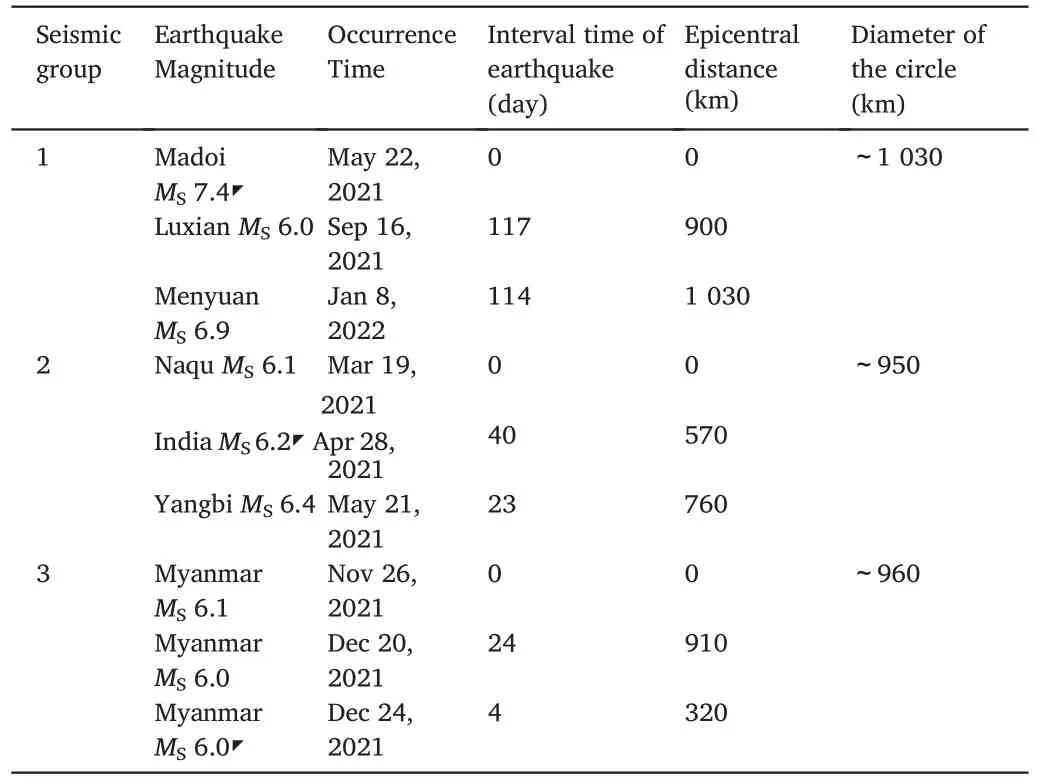
Table 1Characteristics of grouped MS ≥6.0 earthquakes from 2021 to the occurrence of the Menyuan earthquake.
Table 1 and Fig.4 indicate that the occurrence time of the Menyuan earthquake is 117 days after the Luxian earthquake, which is close to the time interval (114 days) between the Luxian and Madoi earthquakes.These 3 earthquakes are located in the same circle with a diameter of about 1 030 km, and the Menyuan earthquake is located near the top corner of the right triangle.The second and third groups of earthquakes also have similar characteristics in time and space.Therefore, it is prominent that the earthquakes in each group are not randomly gener-ated, and they are tightly correlated with each other.
3) Correlation between deformation anomaly propagation and earthquake migration
The deformation anomalies observed at Songpan, Liangshui, Gaotai,and Anxi deformation stations are located in the front of the northeastern margin of the Qinghai-Tibetan Plateau,where high gravity gradient and lowQ-value of Lg wave have been confirmed by observation and calculation (Niu et al., 2022b; Zhao et al., 2013).The anomaly intensity extracted by Fisher statistics in Fig.3 shows similar characteristics of these anomalies, and there is a time delay of 3-4 months in anomaly beginning at adjacent stations.Hence, we suggest that earthquake migration is closely associated with the deformation anomalies propagation.The relationship between earthquake migration and deformation anomaly migration without limiting the distance between precursors and related earthquakes is shown in Fig.3.It is clear that the migration of deformation anomalies is accompanied by the orderly occurrence of strong earthquakes in this area.
The synchronous migration of earthquake and deformation is usually affected by the change of the internal structure or density of deep ma-terials (Scholz, 1977; Zhao et al., 2013; Niu et al.,2022b).Fig.1 shows the gravity anomaly distribution in the northeastern margin of the Qinghai-Tibetan Plateau in the last five years.It can be seen that there is a positive anomaly with a scale of ~600 km near the Longmenshan fault in the Bayan Har block, while negative gravity anomalies are seen in the northern part of the Bayan Har block, the Qaidam block and the Qilian block.The gravity difference in the study area is nearly 200 µgal,providing a favorable condition for deep mass flow.
3.Conclusions
By analyzing the distribution characteristics and mechanism of the short-term deformation anomaly in the northeastern margin of the Qinghai-Tibetan Plateau before and after the Menyuan earthquake, the following conclusions are preliminarily drawn.
1) The short-term deformation anomalies are mainly distributed in the front arc of the northeastern margin of the Qinghai-Tibetan Plateau,where a high gravity gradient and low Q<v alue of the Lg wave are confirmed.The anomaly characteristics of AF value at each anomaly station are close, with a phase lag of 3-4 months between adjacent stations, and the propagation rate estimated by the projection distance on the front arc is ~2.4 km/d.
2) The occurrence time and location of the Menyuan earthquake are related to the group migration ofMS≥ 6.0 earthquakes in the Qinghai-Tibetan Plateau.The Menyuan earthquake occurred 117 days after the Luxian earthquake, and the time interval between the Luxian earthquake and the Madoi earthquake is 114 days.The three earthquakes are located on the same circle with a diameter of ~1000 km, and the Menyuan earthquake is located near the top corner of the right triangle.
3) The propagation of deformation anomaly and migration ofMS≥6 earthquakes may be related to the subsurface mass flow.In the past five years, a positive (negative) gravity anomaly of ~600 km and a gravity difference of about 200 μgal have been observed in this area, leading to the counterclockwise flow of subsurface mass.
In this study, we analyzed the relationship between the tilt anomalies before and after the Menyuan earthquake and the local seismicity.Although it is challenging to completely explain this regularity by obtaining the changes in subsurface mass structure, it is of great significance to recognize the related dynamic effect for understanding the mechanism of pre-earthquake deformation anomaly.
Declaration of competing interest
The authors declare that they have no known competing financial interests or personal relationships that could have appeared to influence the work reported in this paper
Author agreements and Acknowledgments
I would like to declare on behalf of my co-authors that the work described was original research that has not been published previously and is not under consideration for[publication elsewhere,in whole or in part.All the authors listed have approved the manuscript that is enclosed.This project is sponsored by the National Natural Science Foundation of China(41330314).
 Earthquake Research Advances2023年4期
- Earthquake Research Advances的其它文章
- Rapid report of seismic damage to hospitals in the 2023 Turkey earthquake sequences
- Rupture process of the January 8, 2022, Menyuan M 6.9 earthquake
- Seismicity and seismogenic mechanism of the MS 6.0 Luxian earthquake on September 16, 2021
- Trade space for time for inspecting an earthquake cycle by modern seismological observation:The central-southern part of the Sichuan-Yunnan rhombic block
- Earthquake geochemical scientific expedition and research
- Introduction to the recently published treatise entitled A Guidebook to Earthquake Scientific Investigation