
Propagation Properties of Shock Waves in Polyurethane Foam based on Atomistic Simulations
2024-02-29 08:22ZhiqiangHuJianliShaoShiyuJiaWeidongSongChengWang
Defence Technology 2024年1期
Zhiqiang Hu, Jianli Shao, Shiyu Jia, Weidong Song, Cheng Wang
State Key Laboratory of Explosion Science and Technology, Beijing Institute of Technology, Beijing 100081, China
Keywords: Polyurethane foam Shock wave Attenuation Atomistic simulation
ABSTRACT Porous materials are widely used in the field of protection because of their excellent energy absorption characteristics.In this work,a series of polyurethane microscopic models are established and the effect of porosity on the shock waves is studied with classical molecular dynamics simulations.Firstly, shock Hugoniot relations for different porosities are obtained,which compare well with the experimental data.The pores collapse and form local stress wave,which results in the complex multi-wave structure of the shock wave.The microstructure analysis shows that the local stress increases and the local velocity decreases gradually during the process of pore collapse to complete compaction.Finally,it leads to stress relaxation and velocity homogenization.The shock stress peaks can be fitted with two exponential functions, and the amplitude of attenuation coefficient decreases with the increase of density.Besides,the pore collapse under shock or non-shock are discussed by the entropy increase rate of the system.The energy is dissipated mainly through the multiple interactions of the waves under shock.The energy is dissipated mainly by the friction between atoms under non-shock.
1.Introduction
Traumatic brain injury (TBI) caused by blast waves is a major social problem for military personnel,and it is urgent to design and develop new head shock prevention equipment [1-3].Porous materials have excellent energy absorption and buffering properties due to their heterogeneous structure, which is often used as a material for explosion-proof and shock resistance [4-6].The dynamic mechanical properties of foamed metals, ceramics, and polymers in porous materials have been extensively studied and much knowledge has been achieved.The strain rate effect [7-15]and the inertia effect [16-18] of porous materials are two main research problems.The coupling of the two problems leads to the deformation localization and strength enhancement found as two typical features of porous materials [19-22].
Foamed metals are insensitive to low strain rates and sensitive to high strain rates [7].The energy absorption capacity increases with the increase of strain rate [8], but the yield strength is not sensitive to strain rate[9].At a high strain rate,the inertial effect of pore will become obvious and lead to strength enhancement [14].This effect can delay the densification of the material [23].The collapse of the pore will lead to the increase of pressure threshold and the formation of the local high-temperature region [24-26].This plastic deformation is an effective mechanism for absorbing shock wave energy and increasing the attenuation velocity of the shock wave[27].Due to the reflection of the pore,the shock wave in porous materials exhibits highly dispersed characteristics [28,29]The widely accepted shock wave attenuation model is the exponential attenuation model in dense media [30-32].Meanwhile,due to the improvement of finite element numerical method[33-37],many constitutive models have been proposed to explain the strain rate effect,inertia effect,viscosity effect,and plastic shock layer width in porous materials[38-41].Whether the continuumbased shock wave theories and models apply to porous materials is still controversial[41].
Polyurethane is a kind of foamed porous material with Carbamate repeating units in the main chain,which are prepared by the reaction of polyhydroxy compounds with polybasic Isocyanate.This material has a lightweight structure, energy absorption and dissipation,and excellent resistance to harsh environmental conditions,which is widely used in engineering,medical and protective fields[42-44], and by adjusting the proportion of soft segment, and segment and the way of molecular stacking, the materials with different mechanical properties can be obtained[45,46].Extensive experimental works have been conducted on the shock response of polyurethane [47-55].The shock Hugoniot relation of polyurethane with different porosity is given to characterize the state of the material under shock loading [53].The existence of precursor waves can be observed in polyurethane under different compression loads, and the propagation process is non-isentropic.Many other factors affect the attenuation of the shock wave, including shock strength, porosity, pore shape, number of pores, and permeability.With the increase of shock stress, the peak attenuation of over-pressure becomes more obvious [50].It is found that when the loading velocity exceeds 0.043 km/s (shock stress exceeds σ0= 0.36 MPa), the material begins to crush, and when the loading velocity exceeds 0.141 km/s(σ0=3.2 MPa),the material is completely crushed and has no effect on the establishment of the wavefront [53].There is data indicating that some unknown chemical(physical)reactions occurring at 21.7 GPa and low density maybe reduce the occurrence of a chemical reaction[52].There are many other experimental studies of polymeric materials subjected to shock wave excitation, such as polyurea, polyethylene, and polymethyl pentene [56-59].However, experiments can’t fully explain the dynamic response of polymers at the atomic scale under shock loading.
Fortunately, due to the improvement of interatomic potentials and the development of computer science and technology, molecular dynamics (MD)simulation[60] offers a powerful approach to unveil fundamental molecular-level deformation mechanisms.In the molecular simulation of shock effects on polymers,although some works on molecular modeling and tension and compression deformation simulation of polyurethane have been reported[61-63], less work has been focused on the simulation of polyurethane under shock waves [64].There are several distinct mechanisms for yield and plastic flow for polyurethanes under tensile deformation, namely, cavitation, chain pull-out, localized melting with shear band formation, as well as block slip [62]; and for under compressive deformation,there are such mechanisms as block slip, fragmentation and restacking, and block rotation [63].Dewapriya et al.demonstrated that the non-reactive interatomic force field to study the polyurethane under shock loading is with reasonable accuracy and found consistency between spallation strength and nucleation stress [64].There are few reports on the simulation of low-density polyurethane with pores.This is mainly due to the complexity of the polymer atomic model,the force field sufficient to describe the interaction accurately, and the wellestablished equilibrium state of the initial model.The dynamic response of polyurethane with different porosity and their attenuation law of shock wave under shock loading has not been addressed exclusively.
This work introduced a larger pore structure and density inhomogeneity over a longer distance into polyurethane and established several molecular dynamics models with average density between 0.35 and 1.15 g/cm3.Under the coupling action of shock stress and porosity, the thermodynamics, plastic deformation,and shock wave attenuation model of polyurethane are studied by mechanical and microstructural analysis.It is expected that the present work can provide guidelines for the application of foam materials in the shock protection system.The outline of this paper is organized as follows: Simulation models and methods are introduced in Section 2, Results and discussion are presented in Section 3, and finally, Conclusion is drawn in Section 4.
2.Simulation models and methods
2.1.Force field
The Large-scale Atomic/Molecular Massively Parallel Simulation(LAMMPS)[65]code is performed for the relaxation of models and shock loading with the OPLS-AA (all-atom) force field [66-68].Although the OPLS force field is not a reactive potential and can’t be used to simulate bond breaking or forming, the OPLS-UA (unitedatom) force field has been adapted to study the dynamical properties of polyurethane without consideration to the interaction of the hydrogen atom [69].Besides, simulations using a non-reactive force field optimized for high pressures show a great agreement with the experimental Hugoniot data up to ~20 GPa[64].The shock pressures generated in this work are below this value.The OPLS-AA force field has been adapted from other polymers [70-72].The temperature results calculated by the OPLS-AA force field are also in good agreement with results predicted by the Quantum Molecular dynamics (QMD) within an acceptable range of error [73].Therefore,it is reliable to use a more accurate OPLS-AA force field to describe the polyurethane.
2.2.Generation of initial models and equilibration
Polyurethane is a generic term for polymers containing repeating units of Carbamate bonds (-O-CO-NH-) in molecules.Polyurethane is usually prepared by the reaction of diisocyanate and diol.Different isocyanates,polyols,and synthetic methods can be used to prepare polyurethane with different structures, which results in artificial plasticity of polyurethane properties.In this study,the effect of pore structure on shock waves was studied,and the same polyurethane chain was chosen.The chemical structures of the polyurethane chain are shown in Fig.1(a).The copolymer forms urethane linkages by combining 4,4’-diphenylmethane diisocyanate (MDI) and poly ethylene oxide (PEO).The integer n indicates the number of repeating segments in the chains.
First, to rapidly obtain the polyurethane block unit with pores,rigid spheres were added to the simulated box while filling multiple polyurethane chains and the model is relaxed at 300 K and 1 atm for 0.5 ns.This method can be accomplished with the fix indent command in LAMMPS and has been used in previous porous polyethylene simulations [24].Flow chart of polyurethane block unit preparation with different densities is shown in Fig.1(b).Secondly, the large-scale simulation model is prepared by replicating this block unit and is still relaxed at 300 K and 1 atm for 0.5 ns.During the equilibration process, temperature and pressure were controlled by using the isothermal isobaric (NPT) ensemble with periodic boundary conditions along with all three directions and a time step size 0.1 fs.The densities of 0.35,0.50,0.67,0.80 and 1.15 g/cm3polyurethane were generated.The sample whose density is 1.15 g/cm3is close to the experimentally dense polyurethane[74,75].
2.3.Shock simulation and analysis methods
Most results presented in this work are for the lower density 0.35-0.67 g/cm3models, which is effective for the attenuation of the shock wave.The shock loading process of the 0.50 g/cm3model is shown in Fig.1(c).Before the shock loading process,the periodic boundary along the z direction needs to be removed to prevent the occurrence of abnormal bonds.And then, the models need to be further relaxed at 300 K and 1 atm (x and y directions) for 0.5 ns under the NPT ensemble, which ensures that the free surface is stable.Finally, the models continued to relax under the microcanonical(NVE)ensemble to confirm that the temperature did not change significantly.The size of the shock models are about 30 nm×30 nm in the non-shock direction(x and y directions),and the shock direction (z direction) is long enough to facilitate the propagation of shock wave.

Fig.1.(a)The chemical structures of polyurethane.The integer n indicates the number of repeating segments in the chains;(b)Flow chart of polyurethane block unit preparation with different densities;(c)A side view of polyurethane model used to study shock wave propagation.The shock wave is generated by moving a rigid piston at velocity Up toward the positive z-direction.When the piston moves 20 nm, the piston is removed.
The shock wave is generated along the shock direction by moving an effective infinite-mass piston at the desired velocityUp.The attenuation of shock wave is related to the shock widths and shock intensities.The width and intensity of the shock wave are affected by the shock pulse and the shock particle velocity respectively.In this work, at different shock particle velocities,different shock pulses are chosen to ensure that the piston moved the same distance(20 nm).For example,whenUp=0.5,1 and 2 km/s,the pulse time is 40,20 and 10 ps respectively.The similar loading methods are used in Ref.[64].After loading process, a series of shock waves with different intensities but similar shock widths are obtained in the same polyurethane.It is convenient to contrast the effect of the shock intensity on the attenuation of shock wave.
During the propagation of the shock wave, the stress is calculated based on the virial theorem [76] and the temperature is calculated by subtracting the center-of-mass velocity from the average kinetic energy of each bin.The entropy for atomiis obtained by the following equation [77]:
Here,rrepresents the distance and ρ represents the density of the system.kBis Boltzmann constant.represents the smooth radial distribution function of atomiand is calculated as follow:
here, the sum injgoes through the neighbors of atomi,and σ is a parameter to control the smoothing.Besides,the software package OVITO [78] is used for the calculation of atom strain [79], and construction surface mesh [80] visualization in this work.
3.Results and discussion
3.1.Dynamic response under shock loading
Before shock loading, we analyzed the pore structure information in the initial polyurethane.Fig.2 displays the distribution of pore diameter in polyurethane foam.The pores are approximated as spheres and the corresponding diameters are then calculated by the construction surface mesh of OVITO [80].It can be observed that the total number of pores gradually decreases with increasing density.The pore diameter is mainly concentrated in the range of 4-6 nm.Pore diameter ranging from 1.7-300 nm [81] and 8.3-31.9 nm [82] in polyurethane and polyisocyanurate has been also characterized in the experiments.The pore size range in the experimental material covers the pore size range of this simulation.By fitting the results with a normal distribution,it is found that the average pore diameter does not change significantly, and the standard deviation of the pore diameter decreases gradually with increasing density.That is,the average distance between the pores increases gradually.It should be noted that the polyurethane in this work is an open foam, and the pores are connected.Subsequent microstructure section does not fully exhibit the size of the pores.
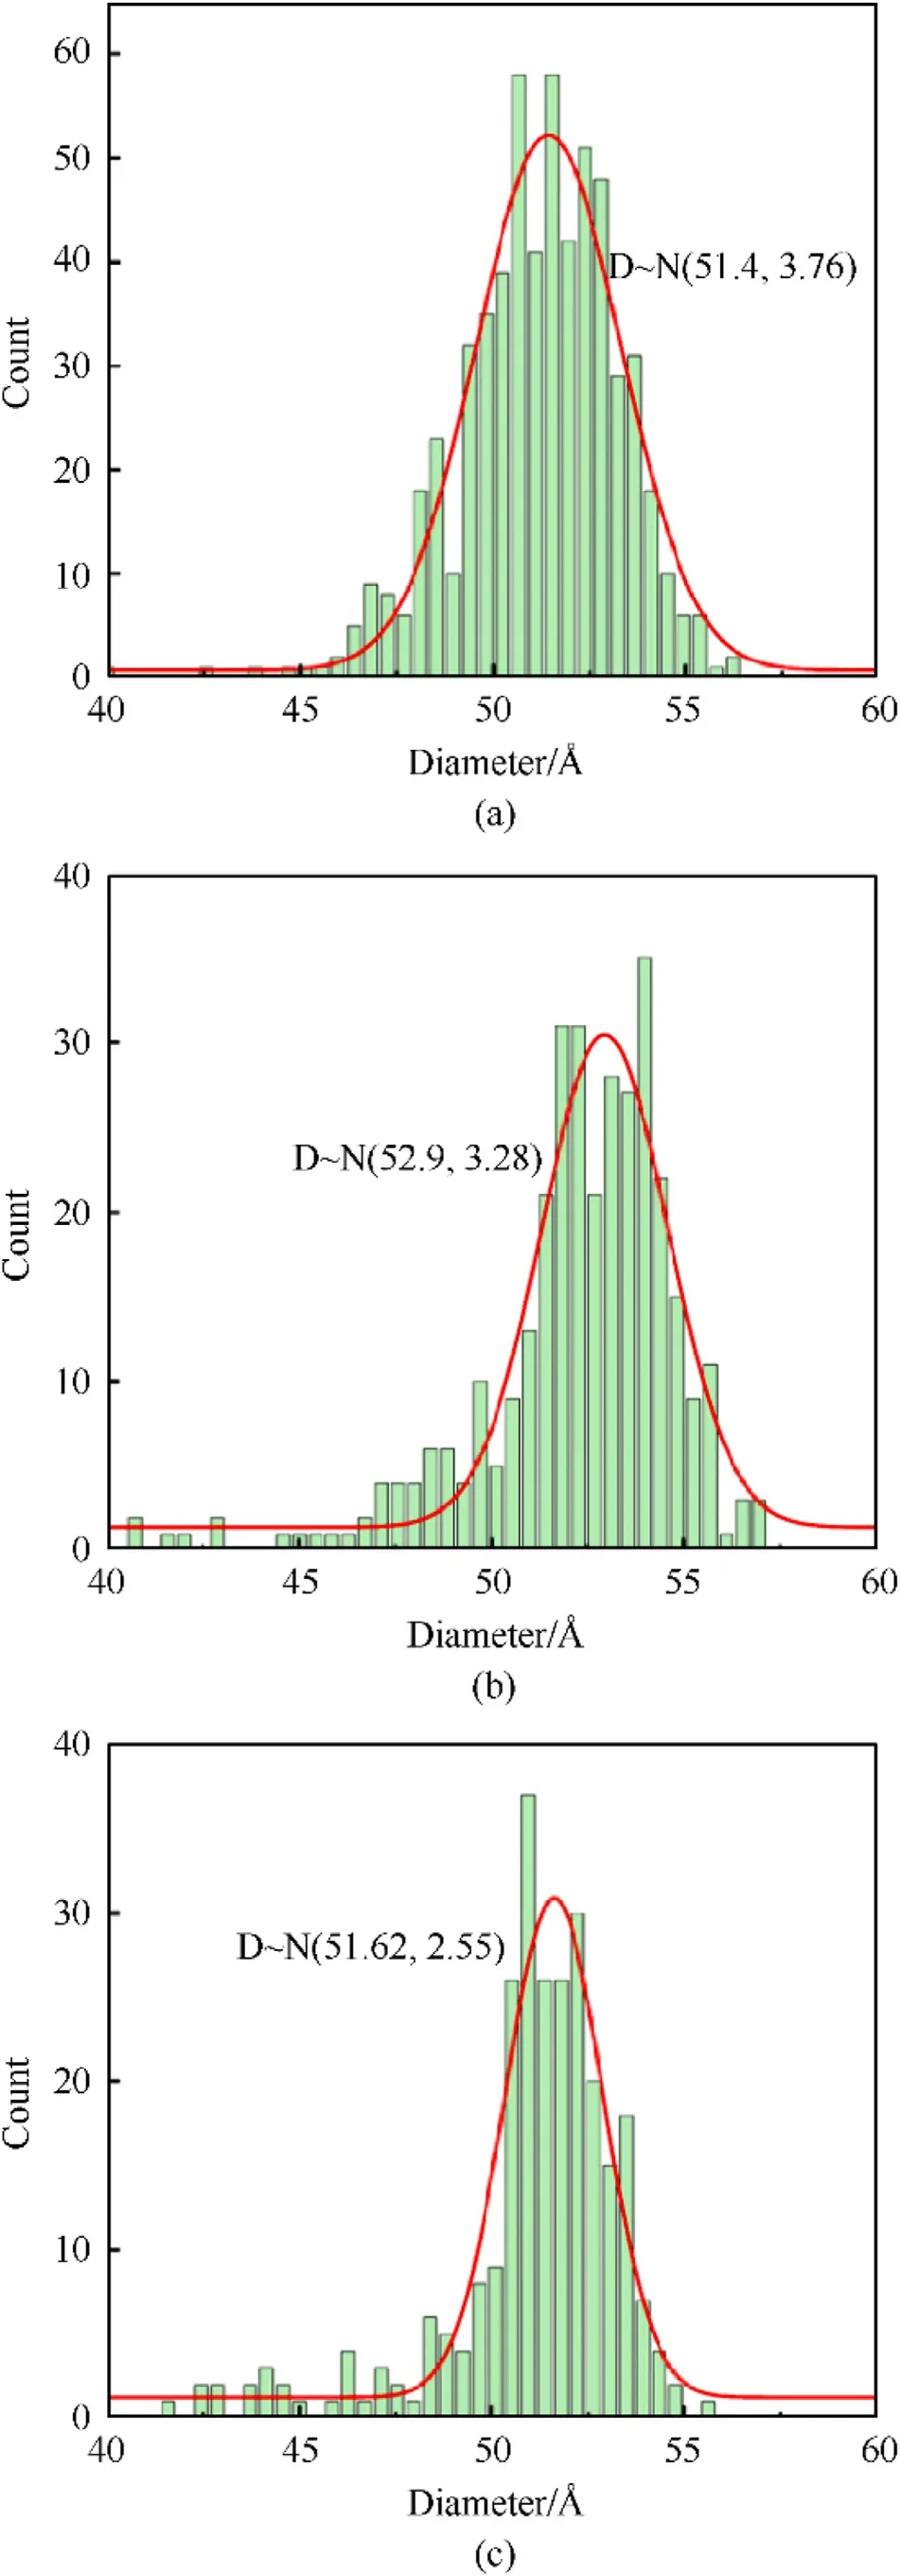
Fig.2.The distribution of pore diameter in polyurethane foam.The distribution approximately satisfies the normal distribution: (a) ρ0 = 0.35 g/cm3; (b) ρ0 = 0.50 g/cm3; (c) ρ0 = 0.67 g/cm3.
The propagation of shock waves will be different from that of dense medium for the density inhomogeneity of porous polyurethane.Fig.3 shows the atomic configuration of polyurethane(at 10, 20 and 30 ps) colored by particle velocity along the shock direction.Generally, the shock wave velocity is related to the shock pressure and increases with the increase of the pressure.The porosity has a significant effect on the propagation of shock waves in polyurethane.The position of the wavefront in high porosity sample is much higher than that in a low porosity sample at the same moment, which is mainly due to the difference of pore collapse and sample compaction time.The large pore structure can retard the propagation of shock waves.It is easy to understand that the rarefaction wave produced after unloading causes the shock wave to begin to attenuate.Similarly,the apparent decay of particle velocity can be observed from the atomic configuration.
The non-uniformity of porous materials will lead to nonuniformity of shock wave velocity.The velocity of the shock wave is obtained by linear fitting the position of the wavefront during the loading process.Fig.4 presents theUs-UpandP-Uprelationship compared with previous simulated [64] and experimental [83]works.It shows that the Hugoniot data of normal polyurethane(ρ = 1.15 g/cm3) agree well with simulated and experimental data and polyurethane with pores are closed to experimental data with an acceptable degree that may be caused by the distribution and morphology of pore.This indicates that the force field chosen in this work and analysis of methods are reliable enough.There is a linear relationship between theUs-Upin the range of loading velocity, while the curvature relationship between theUs-Upunder low-velocity loading is not observed in Fig.4(a)[84,85],partly due to the few low loading velocities investigated in this work.Although the wave velocity decreases with the increase of porosity,the slope of the linear relationship between the fitted curve of theUs-Upis almost constant.The following equation can represent the linear relationship [86]:
whereC0is the intercept andSis the slope.In Fig.4(b), The shock pressure of normal polyurethane(ρ=1.15 g/cm3)increases rapidly with the loading velocity and reaches 13.29 GPa whenUp=2 km/s.The shock pressure of polyurethane with pores increases slowly with the increase of loading velocity.WhenUp=2 km/s,the shock pressure is all lower than 5 GPa.It shows that the pore structure has an obvious attenuation effect on the initial shock pressure.
During the loading process of polyurethane, because of the existence of pores, there is also the unloading process of reflection and absorption of the shock wave.The propagation of shock waves has gone through a complicated process.Fig.5 shows the distribution of thermodynamic quantities (stress, velocity, and temperature)along the shock direction in polyurethane at different piston velocities when the piston is removed.In Fig.5(a) and 5(b), it is found that the pore structures can affect the stress waveforms,and this is especially significant at higher loading velocities.When loading velocity is above 1.5 km/s, the stress waveform in the sample appears as a triangular wave.As the peak value of the stress wave increases with the increase of loading velocity,the waveform becomes sharper and sharper.However, at low loading velocity(Up=1 km/s),the stress waveform in the sample appears to have a plateau.Especially, for the density of 0.67 g/cm3, a double-wave structure can be observed in the triangular wave from about 360 to 400 Å.It should be noted that this phenomenon is not caused by the separation of elastic and plastic waves.

Fig.3.The atomic configuration of polyurethane for different densities.Atoms are colored by particle velocity along the shock direction.

Fig.4.Comparison of shock Hugoniot data of polyurethane.Relationship of (a) shock wave velocity Us versus loading velocity Up, (b) pressure versus loading velocity Up.
In the velocity versus position curve,when the loading velocity exceeds 1.5 km/s, the curve shows wave shape.When the loading velocity is 1 km/s, the curve is approximately a platform.This shows that when the loading velocity is too fast(Up>1.5 km/s),the structure in the sample can’t be stabilized in time and causes the reflection and projection of shock waves many times.This also explains why the stress wave appears as a double-wave structure.It can be predicted that the double-wave structure will appear in the polyurethane with the density of 0.35 g/cm3as the propagation of the shock wave.In the temperature versus position curve,there is a peak in the temperature waveform on the shock side.The peak value increases with the increase of loading velocity.In the simulation, the shock wave is generated by an effective infinite-mass piston, which has a weaker ability to confine atoms due to the lack of force field and leads to a higher temperature on the shock side.This phenomenon also appears in the study that adapted an infinite piston to drive shock waves[87].
Similarly, the temperature decreases slightly with the increase of density.Pore collapse can form local hot spots and high-porosity polyurethanes can carry higher temperatures,which are consistent with the results of porous polyurea.The high-temperature region on the shock side is approximately less than 280 Å.There is an approximate platform temperature region after more than 280 Å,and the temperature after the platform region presents a fluctuating decline.WhenUp>1 km/s, the platform temperature is higher than the melting point(450 K)of typical polyurethane.High temperature will lead to low shear stress [64], the deformation of the material will be dominated by normal stress σzz.These will lead differences in the deformation patterns of pores.The attenuation of shock wave is related to the width and intensity of shock wave.Local hot spots caused by pore collapse cause the material to expand,such as a solid-liquid transformation,which will affect the propagation velocity of the unloading section on the left side of the stress curve to change and the width of the shock wave.
Fig.5(c) present the atomic configurations of density 0.35,0.50 and 0.67 g/cm3atUp=1.5 km/s.It can be observed that the stress propagates through the polyurethane matrix, so the stress field at the wavefront appears as a ribbon,which is parallel to the two rows of pores along the shock direction.The stress concentration appears on the polyurethane matrix near the non-shock directions of the pores.Besides, the collapse of the pore is accompanied by the appearance of a local acceleration field and a local hot spot.Differently,the local velocity field shows a triangular zigzag shape,and the temperature field shows a ribbon shape coincident with the shock direction.

Fig.5.Stress and temperature profiles at different loading velocities Up of(a)ρ0=0.35 g/cm3 and(b)ρ0=0.67 g/cm3;(c)The atomic configurations of density 0.35,0.50 and 0.67 g/cm3 are colored by σzz, vzz, and temperature at Up = 1.5 km/s when the piston is removed.
3.2.Attenuation of shock wave
Fig.6 shows stress, velocity, and temperature profiles as functions ofzposition at a different time with the loading velocities of 1 km/s and 2 km/s.It can be seen that the peak value of stress has obvious attenuation,and the attenuation amplitude is promoted to the shock intensities.The stress wavefront gradually becomes flat and the wave shape oscillates as the shock wave attenuates.Multiwave structures appear in the stress waveforms of polyurethane of 0.35 g/cm3with the propagation of shock waves.Interestingly,the velocity and temperature of the left free surface will decrease for the rarefaction wave, but the velocity curve will be gradually homogenized and become a platform as the shock wave attenuates.This indicates that the inertial effect is weakening with the decrease of loading velocity.The shock wave diverges gradually,and when the shock wave goes through the pores, the multiple effects between the shock waves no longer occur.This change is related to the initial loading velocity and density.The corresponding curves are always accompanied by local acceleration fields and local hot spots.
Fig.7 displays time position diagrams of stress, velocity and temperature in polyurethane of 0.35 g/cm3and 0.67 g/cm3atUp= 1.5 km/s.The piston removal time is approximately 13.3 ps.During the loading process before 13.3 ps, the piston pushes the sample on the left side at a constant velocity to produce a shock wave.However, the loading process is also accompanied by the reflection and projection caused by the collapse of the pore.When the shock wave reaches the vicinity of the pore,the decrease of the interface will lead to the increase of stress.As the shock wave propagates further, the pores are filled with atoms on both sides and in the direction of the shock, which causes new collisions.
In polyurethane of 0.35 g/cm3, several stress concentration regions can be seen alternately adjacent to each other in the shock region, and the stress concentration region gradually expands before 13.3 ps.The alternation is due to the periodic distribution of pores.After 13.3 ps,when the pores begin to collapse,in addition to forming a stress concentration area, a series of reflection waves with different velocities are clearly seen to the left.The reflection waves from different pores meet and decay away before they reach the free surface.After about 4 layers of pores, as the stress decays rapidly, there is a wave dispersion effect and no obvious stress concentration area.
In polyurethane of 0.67 g/cm3,pores collapse and compact more easily, which results in larger and higher stress concentrations.After 13.3 ps, the waves reflected from the pore are more obvious,and the path of wave propagation is zigzag due to the repeated transmission and meeting.After about 6 layers of pores, the waveform begins to diffuse and the wavefront gradually widens.The velocity waveform is similar to the stress waveform.Correspondingly, when the stress waveform begins to disperse, the velocity distribution becomes uniform gradually.In the process of temperature propagation, the temperature distribution decreases with distance,and the difference between the local hot spot and the shock region is large, which can’t be seen clearly in the diagram.
To further describe the thermodynamics of pore collapse,Fig.8 presents the stress,velocity,and temperature profiles curves of the collapse and compaction of a layer of pores and the corresponding atomic configuration in polyurethane of 0.67 g/cm3atUp=2 km/s.Clearly,the stress peak on the left side decreases gradually until the peak disappears due to the rarefaction wave,and the stress on the right side increases gradually to form a new peak due to the pore collapse.From the atomic configuration, it can be seen that the stress concentration mainly occurs in the framework on both sides of the pore,and the region gradually expands and forms alternating bonds of high pressure and low-pressure regions.When the pore completely collapses, the stress near the pore reaches the maximum value.After passing through a layer of pores, the peak stress will decrease from 8 GPa (t= 10 ps) to 6 GPa(t= 12 ps).
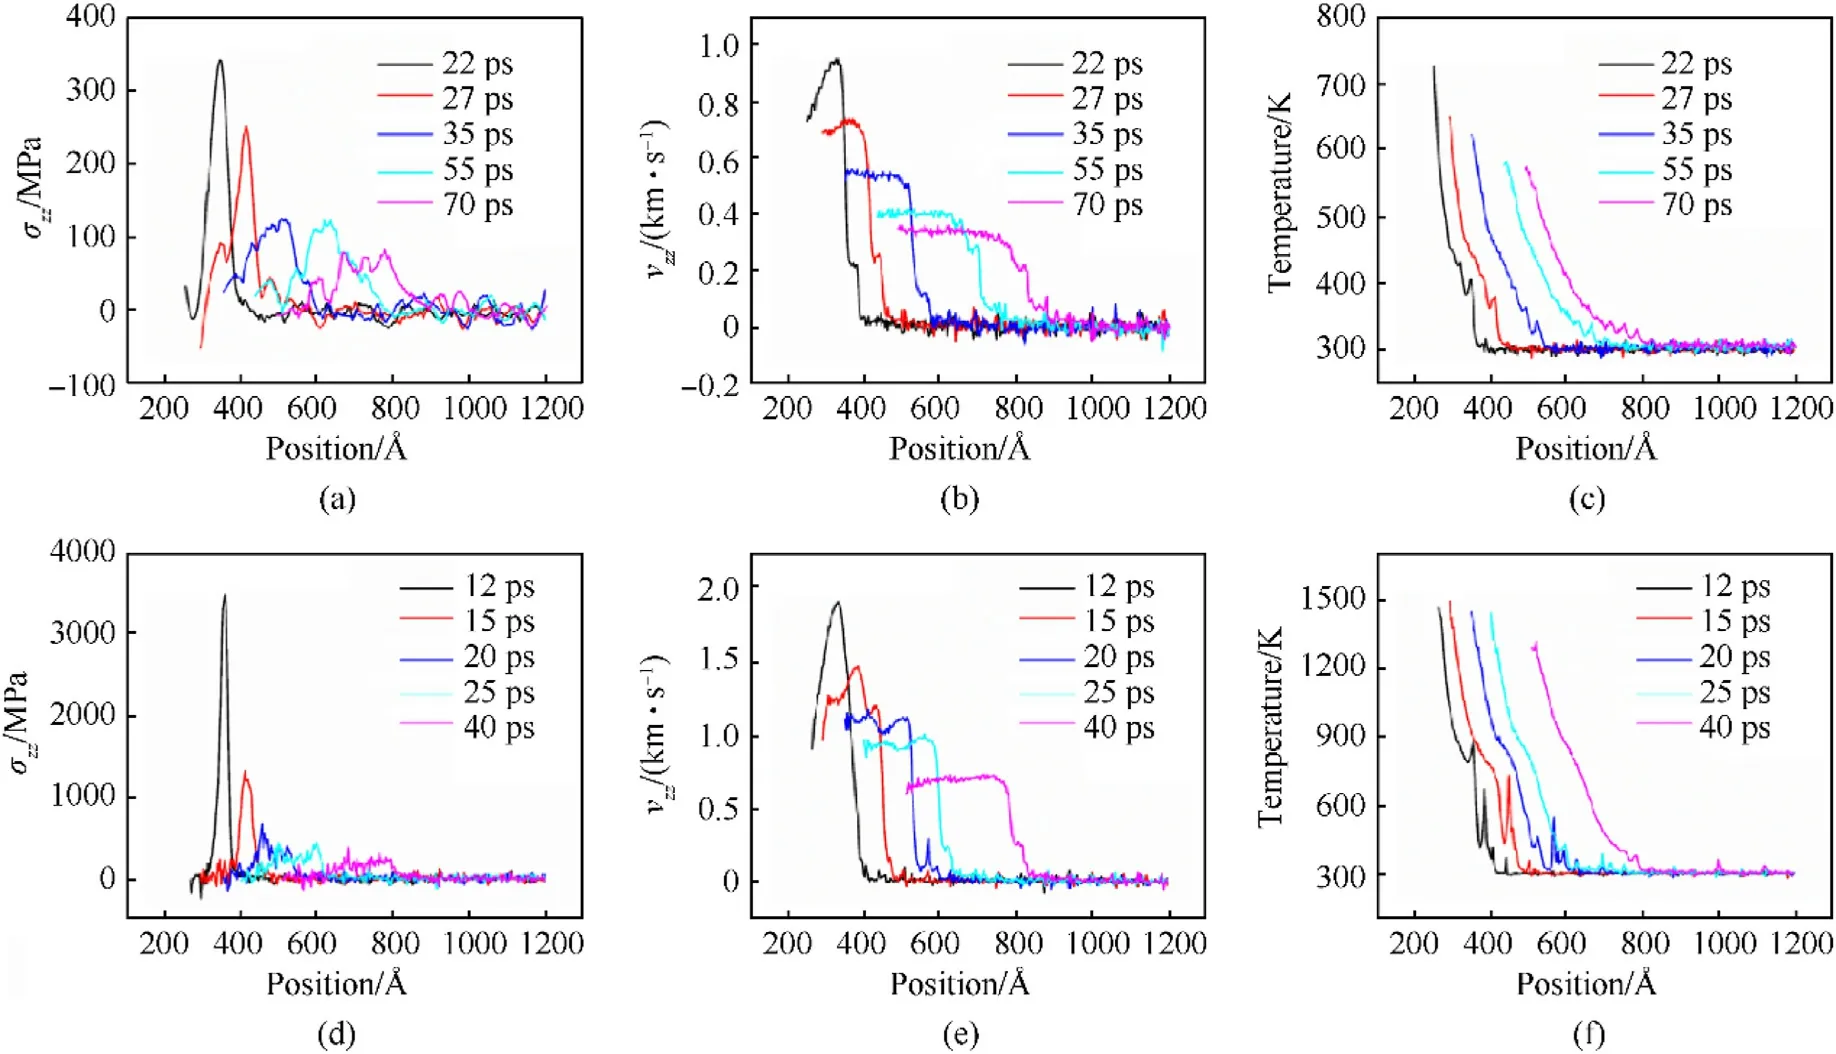
Fig.6.The variation of thermodynamic quantities along the direction of shock in polyurethane of 0.35 g/cm3 under different shock intensities: (a)-(c) Up = 1 km/s; (d)-(e)Up = 2 km/s.It includes (a) and (d) the stress, (b) and (e) velocity, (c) and (f) temperature curves.

Fig.8.(a)Stress,velocity,and temperature profiles curves of the collapse and compaction of a layer of pores;(b)The corresponding atomic configuration in polyurethane of 0.67 g/cm3 at Up = 2 km/s.
Similarly,the velocity on the left side decreases gradually due to the rarefaction wave.Differently,the local acceleration field mainly appears in the area below the pore from the atomic configuration.When the pore begins to collapse,the velocity of this area reaches the maximum value.With the pore filling,the velocity of this area extends down and decreases gradually.When the next layer of pores begins to collapse, a new local acceleration field will be formed.As for the distribution of temperature, when the pores begin to collapse, local high temperature occurs in the pores, but the temperature of complete collapse is slightly lower than that of the upper layer of pores.The high-temperature area remains in the sample, and the alternating bands of low temperature and hightemperature regions will be formed after layer upon layer of pores collapse.
As the shock wave propagates forward in a dense material, the peak stress is certain to undergo some degree of attenuation.It is widely accepted that the attenuation of the peak stress satisfies an exponential function [30-32].
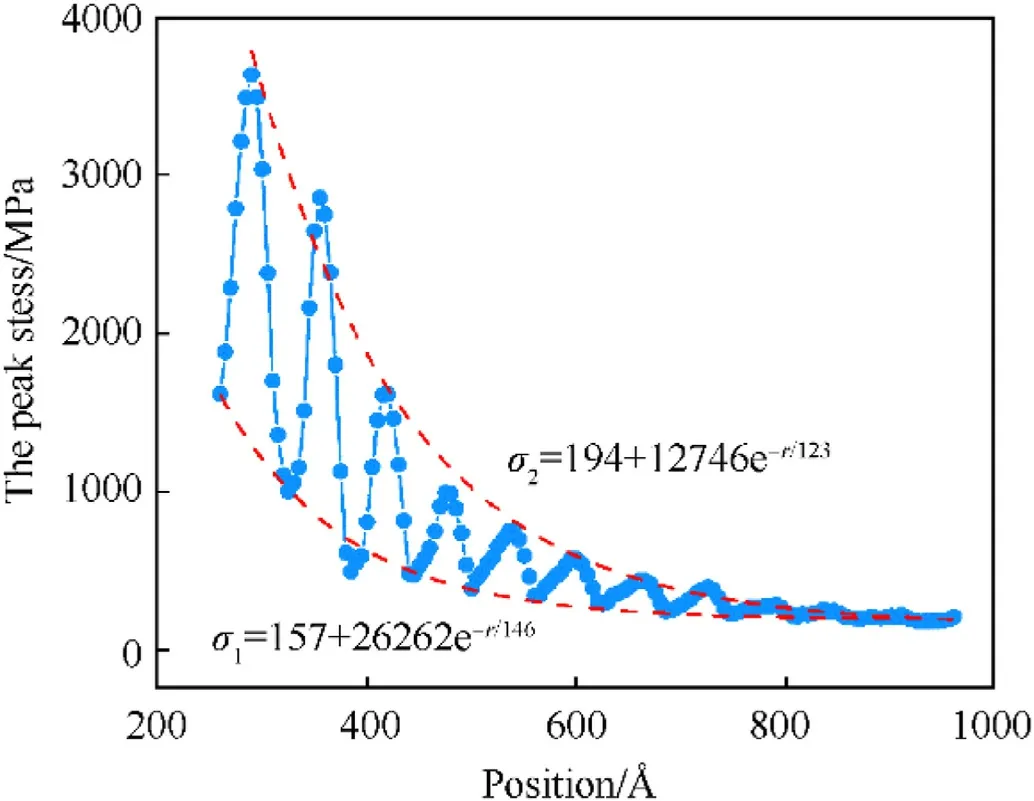
Fig.9.The fitting curve of shock wave peak stress with the position in polyurethane of 0.35 g/cm3.The blue dots are the peak stress versus position.The σ1 and σ2 are used to fit the range of peak stress and satisfy the exponential decay expression.
Here,α is the attenuation coefficient, which is related to material properties.CandKare constant and depend on the initial state.ris the position of the shock wave.Fig.9 shows the distribution of scattered points of the peak stress of the shock wave with the position in polyurethane of 0.35 g/cm3and the distribution of initial peak stress and shock width.In Fig.9, the peak stress of the triangular wave is taken as the example when the piston is removed.The peak stress does not decay with an exponential function, but with the periodic fluctuation of distance.The fluctuation is due to the inhomogeneity of the porous polyurethane and the stress concentration caused by the collapse of the pores.The amplitude of the fluctuation decreases with the propagation distance.Periodicity is due to the uniform distribution of pore structure, the size of pores and the distance between pores are similar.Two exponential functions,σ1and σ2,are used to fit the lower and upper bounds of the distribution of peak stress scattered points to describe the attenuation law.Such as polyurethane of 0.35 g/cm3atUp=2 km/s,the two exponential functions are σ1=157+26262e-r/146 and σ2=194 +12746e-r/123.
Fig.10 displays the attenuation coefficients of σ1and σ2for polyurethanes with different porosity.Among the three densities of polyurethane, the attenuation coefficient α1and α2of the lowest density (0.35 g/cm3) is the largest, which indicates that the attenuation effect of the polyurethane with large porosity is the best.When the density increased from 0.35 to 0.5 g/cm3,the attenuation coefficient α1decreased greatly, and when the density increased from 0.5 to 0.67 g/cm3, the attenuation coefficient α1decreased slightly.The attenuation coefficient α2decreases approximately linearly with the increase of density.In theory,the loading velocityUpis related to the initial peak stress,which is reflected inKandCbut not in α.However,the attenuation coefficient α1and α2increase with the increase of loading velocity, which may be due to the difference of shock wave width and the pore deformation mode.When the shock wave width is similar to the length of the pore structure, the stress attenuation is more easily caused by the scattering of the shock wave.The deformation mode of the pore is discussed below.
Fig.11 shows the shock wave width and the initial peak stress atUp>1 km/s when the piston is removed.The shock wave width decreases slightly with the increase of particle velocityUp.In Fig.11(a),The shock wave width of polyurethane with high porosity is much smaller than that of polyurethane with low porosity.In this work,the length of a layer pore is about 66 Å,which is close to the shock wave width length of polyurethane of 0.35 g/cm3.Besides,when the piston is removed, the peak stress is not easy to determine if it is in a period of increased or decreased stress, the minimum and maximum stress of the collapse of the nearest layer is chosen as the initial peak stress of the two exponential functions,as shown in Fig.11(b) and 11(c).
3.3.Deformation in polyurethane
Entropy can be used to describe the degree of chaos in a system,and higher entropy corresponds to a more chaotic environment.Also, it is useful to distinguish between ordered and disordered environments, for instance liquid environments and solid-like environments and boundary environments.Fig.12 shows the evolution of the normalized average entropy of polyurethane with time at different loading velocityUp.Here, the entropy of polyurethane with different porosity is normalized to facilitate comparison.In fact,polyurethane with high porosity has a larger surface area and is with higher initial entropy.The value of entropy depends on the Radial distribution function of the atom,which must be affected by factors such as temperature and density.However,the normalized average entropy is also affected by the size of the model.Although the initial shock wave width is close at different shock particle velocities,it will change obviously during the propagation.This will affect the value of entropy.In Fig.12, the final moment of the horizontal coordinate corresponding to the entropy decreases with increasing shock particle velocity.At shock particle velocity of 0.5,1,1.5 and 2 km/s, the time range is from 0 to 90, 70, 50 and 40 ps respectively.The rate of entropy growth is more concerned and is not affected by the calculated atomic grouping.
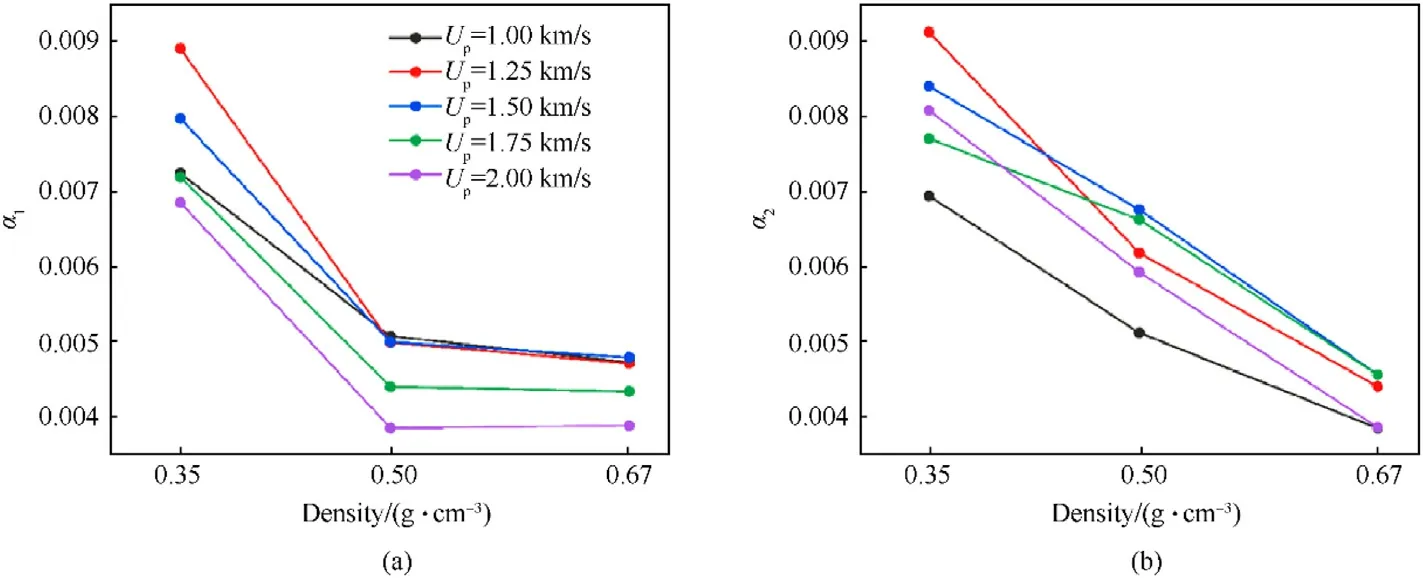
Fig.10.The attenuation coefficients of (a) σ1 and (b) σ2 for polyurethanes with different porosity.

Fig.11.(a)The shock wave width;(b),(c)The initial peak stress versus loading velocity Up when the piston is removed.
During the loading process, the entropy of all density polyurethanes driven by the piston increases at a certain rate.With the increase of piston speedUp,the entropy increase rate also increases.At higher loading velocity(Up>1 km/s),the entropy increases in a wavy fashion.Interestingly,the different densities of polyurethane showed a different change of entropy at different loading velocities when the piston was removed.AtUp= 0.5 km/s, the pore deformation is not very violent, and the rate of increase of entropy is close to the rate during the loading state.The deformation of pores in the whole process is mainly caused by friction.This explains that porous polyurethane can form a stress plateau similar to that in a dense material under low loading velocity from Fig.5.AtUp=1 km/s,when the piston was removed,the entropy of polyurethane with a density of 0.5 and 0.67 g/cm3increased linearly, and the rate of entropy increase is obviously higher than that of the loading state.A similar rapid increase of entropy has not been observed in polyurethane with a density of 0.37 g/cm3.The results show that the small pore structure is more prone to shear deformation, and the main deformation is caused by the multiple interactions between the shock wave and the inner wall of the pore.In this process, the stress concentration becomes obvious.There is a large difference between σ1and σ2,and the stress decreases obviously.In addition,the duration of this rapid increase of the entropy increases with the increase of density.After that,the entropy increases slowly and approximately linearly with time.In this process, the rate of attenuation gradually diminishes,and σ1and σ2become closer.The inertia effect is weakened, and the deformation of pores is mainly friction.AtUp= 1.5 km/s,2 km/s,the entropy of all polyurethanes shows rapid growth when the pistons were removed.
The inertial effect is obvious under high-velocity shock and the deformation of porous materials is in shock wave mode,while the inertial effect is weakened under medium velocity shock and the deformation of porous materials is in compression wave mode.Fig.13 displays the evolution of the atomic configuration of a pore collapse in polyurethane of 0.5 g/cm3in different stages of entropy growth after the piston is removed.The stage of rapid increase of entropy is considered to be in the shock mode(14.5-17 ps),and the stage of slow increase of entropy is considered to be in the compression wave mode(45-57.5 ps).In the shock mode,the pore structure can’t be moved in time and is rapidly filled by the atoms below the pore.The displacement produced by the atoms below the pore is larger than others, which corresponds to the atoms in the local accelerating field.The atoms above the pore hardly move,and the boundary of displacement has a bulge in the pore.The atomic shear strain is distributed uniformly below the pore and appears layer by layer.As the pores continue to collapse,the shearstrain atoms of the different layers gradually connect.Besides, the region of pore structure after the shock wave is completely densified, and the pore structure will disappear eventually.In the compression wave mode, the wavefront gradually widens, the pores are no longer collapsing layer by layer, and the multi-layer pores are deforming simultaneously.No obvious local accelerating atoms are observed, and the boundary of atomic displacement is relatively uniform.The shear strain atoms mainly appear on both sides of the pore, and the plastic deformation distribution is not uniform.Meanwhile, the atoms in the pore structure region can’t be completely densified, and the pore structure will not disappear completely.

Fig.12.Evolution of the normalized average entropy of polyurethane with time:(a)Up=10.5 km/s;(b)Up=1 km/s;(c)Up=1.5 km/s;(d)Up=2 km/s.The time corresponding to the dashed line is the time to remove the piston.
4.Conclusions
In this work, MD simulations are performed to study the attenuation of the shock wave in polyurethane.It is found that the shock wave velocity decreases with the increase of porosity.As the loading velocity increases, the stress waveform in polyurethane changes from a rectangular wave to a triangular wave.The rapid collapse of the pores causes the reflection and projection of the shock wave, which leads to the appearance of a multi-wave structure and the convergence of the waves to form the triangular wave.Besides,the collapse of pores is accompanied by stress concentration,local acceleration field,and hot spot formation.The stress concentration area appears on both sides of the pore and increases with the collapse of the pore,while the local acceleration field appears below the pore and decreases with the collapse of the pore.The temperature of the hot spot is always lower than the temperature of the area near the shock side.With the propagation of the shock wave, the inertial effect weakens gradually, the velocity waveform becomes uniform gradually,which means the pore deformation pattern changes.The length of a layer pore is close to the shock wave width length of polyurethane with the lowest density.Two exponential functions were used to fit the upper and lower boundary of the peak stress, and it was found that the attenuation coefficient of polyurethane with high porosity was the largest.Moreover, the entropy of the shock mode increases very fast, the entropy of the compression wave mode increases slowly.The former energy dissipation is mainly the multiple interactions of waves and the latter is mainly the friction.
These results can be used to optimize the design of protective helmet liners made from PU,such as by adjusting the thickness and density of the material to achieve the desired level of impact resistance.They can also help researchers understand how different processing methods or additives may affect the impact behavior of PU,and how to tailor the material properties for specific applications.
Declaration of competing interest
The authors declare that they have no known competing financial interests or personal relationships that could have appeared to influence the work reported in this paper.
Acknowledgments
This work would like to thank the financial support from National Natural Science Foundation of China (Grant No.12172325).

- Defence Technology的其它文章
- The interaction between a shaped charge jet and a single moving plate
- Machine learning for predicting the outcome of terminal ballistics events
- Fabrication and characterization of multi-scale coated boron powders with improved combustion performance: A brief review
- Experimental research on the launching system of auxiliary charge with filter cartridge structure
- Dependence of impact regime boundaries on the initial temperatures of projectiles and targets
- Experimental and numerical study of hypervelocity impact damage on composite overwrapped pressure vessels