
Reheat effect on the improvement in efficiency of the turbine driven by pulse detonation
2024-02-29 08:22JunyuLiuZhiwuWngZixuZhngJunlinLiWeifengQinJingjingHung
Defence Technology 2024年1期
Junyu Liu , Zhiwu Wng ,b,*, Zixu Zhng , Junlin Li , Weifeng Qin , Jingjing Hung
a School of Power and Energy, Northwestern Polytechnical University, Xi’an 710072, China
b Shenzhen Research Institute of Northwestern Polytechnical University, Shenzhen 518057, China
c Mechanical Engineering College, Xi’an Shiyou University, Xi’an 710065, China
Keywords: Pulse detonation turbine engine Hydrogen detonation Turbine efficiency Reheat effect Multi-cycle detonation
ABSTRACT Due to the strong unsteadiness of pulse detonation,large flow losses are generated when the detonation wave interacts with the turbine blades, resulting in low turbine efficiency.Considering that the flow losses are dissipated into the gas as heat energy, some of them can be recycled during the expansion process in subsequent stages by the reheat effect, which should be helpful to improve the detonationdriven turbine efficiency.Taking this into account, this paper developed a numerical model of the detonation chamber coupled with a two-stage axial turbine, and a stoichiometric hydrogen-air mixture was used.The improvement in turbine efficiency attributable to the reheat effect was calculated by comparing the average efficiency of the stages with the efficiency of the two-stage turbine.The research indicated that the first stage was critical in suppressing the flow unsteadiness caused by pulse detonation,which stabilized the intake condition of the second stage and consequently allowed much of the flow losses from the first stage to be recycled, so that the efficiency of the two-stage turbine was improved.At a 95%confidence level,the efficiency improvement was stable at 4.5%-5.3%,demonstrating that the reheat effect is significant in improving the efficiency of the detonation-driven turbine.
1.Introduction
As combat weapons evolve toward long-range,hypersonic,and highly maneuverable capabilities, the power system is often the limiting factor in weapon performance, which has stimulated interest in researching advanced propulsion modes to meet defense requirements.Pressure gain combustion, such as rotating detonation [1-3] or pulse detonation [4-7], has a higher combustion efficiency and a lower entropy increase than isobaric combustion,which can be applied in conventional engines to enhance weapon performance [8].
The pulse detonation turbine engine(PDTE),a new type of engine that replaces the isobaric combustion chamber (including the main combustion chamber and afterburner) of the conventional aero turbine engine with the pulse detonation chamber (PDC), benefits from the high thermal efficiency of the pulse detonation cycle and the effective power extraction of the gas turbine.The selfpressurization effect can reduce the number of compressor and turbine stages, reduce the engine mass and improve the engine thrust-to-weight ratio.According to theoretical analysis,the performance of the PDTE is superior to that of the conventional aero turbine engine under most operating conditions [9-12].Moreover,experiments have proved that the turbine is capable of converting the energy of detonation gas into shaft work [13-15], which demonstrates that the scheme of PDTE can be effective.However,further investigation reveals that the performance of the PDTE is not ideal[16,17], especially the low turbine efficiency.Therefore, many experimental and numerical studies have been conducted to investigate the mechanisms of pulse detonation and turbine interaction.

Nomenclature A Area b Chord length cf Velocity cp Isobaric heat capacity cmax Maximum thickness E Energy g Acceleration of gravity h Specific enthalpy m Mass p Static pressure p * Total pressure pCJ C-J pressure q Mass flow rate Q Quantity of heat t Time T * Total temperature v Axial velocity W1 Actual work of the first stage W1 * Isentropic work of the second stage W2 Actual work of the second stage W2 * Isentropic work of the second stage WT Actual turbine work WT * Isentropic turbine work z Height x Axial position Greek symbols β1k Geometric inlet angle β2k Geometric outlet angle η1 * Efficiency of the first stage η2* Efficiency of the second stage ηst * Average efficiency of the stages ηT* Efficiency of the two-stage turbine κ Specific heat ratio ρ Density τ Pitch χ1 Leading edge angle χ2 Trailing edge angle Subscripts a First stage inlet b First stage outlet/second stage inlet c Second stage outlet
The coupling system of the multi-tube PDC with a single-stage turbine was studied by Rasheed et al.[18,19].They found that the peak pressure at the turbine outlet was significantly reduced, but complex wave interactions were observed in the transition section,which affected the turbine operation.Frolov et al.[20] found that most of the kinetic energy of the detonation wave was not utilized due to the strong interaction between the pulse detonation wave and the turbine.To attenuate the intensity of the shock, Rezay Haghdoost et al.[21] designed a device called a "shock divider" to reduce pressure fluctuation at the turbine inlet by splitting the leading shock into two weaker compression waves.Qiu et al.[22]investigated the impacts of synchronous and asynchronous ignition methods on PDTE operation and discovered a coupling effect between PDCs, which was more obvious in asynchronous ignition.Additionally, Glaser et al.[23] investigated the coupling effect of sequential ignition in 6-tube PDCs and discovered that sequential ignition had little effect on the normal operation of adjacent PDCs.Fernelius et al.[24]modeled the detonation pressure pulsations as sine functions to investigate the effect of unsteady periodic flow on turbine performance.They found that the pulsation amplitude had a stronger effect than the pulsation frequency.George et al.[25]also found that the turbine efficiency was mainly affected by detonation-induced fluctuations in turbine flow rate and rotor incidence angle, while detonation frequency had only a minor impact.Anand et al.[26]investigated the effect of purge fraction on turbine performance and observed a"purge braking"phenomenon at the turbine inlet, which might impact the turbine performance.Li et al.[27] investigated the interaction mechanism between the PDC and the turbocharger.They discovered that the difference in momentum per unit area between the turbine inlet and outlet was the critical factor for power extraction from the turbocharger,which could be improved by optimizing the design of the transition section between the PDC and the turbine.
Van Zante et al.[28]performed a three-dimensional simulation of the interaction between the pulse detonation and a single-stage turbine.They discovered that the strong flow unsteadiness had a negative effect on turbine efficiency,and the traditional calculation method for turbine efficiency was not applicable to pulse detonation.To solve the problem,Suresh et al.[29]proposed two methods to calculate the turbine efficiency for unsteady periodic flow, and the rationality of the calculation method was verified by numerical simulation.Nango et al.[30,31] investigated the relationship between rotor speed and turbine efficiency driven by pulse detonation.They found that properly increasing rotor speed could improve turbine efficiency.Xisto et al.[32] found that the interaction between unsteady PDC outflow and constant rotor speed caused significant changes in rotor incidence angle, resulting in local flow separation on rotor surfaces,which seriously affected the turbine performance.Asil et al.[33] proposed a fast calculation method to calculate the turbine performance for pressure gain combustion.The calculation method was accurate enough and computationally inexpensive, which could be a robust tool for the performance evaluation of turbines driven by pulse detonation.Sousa et al.[34] proposed a new approach to optimize supersonic turbines applied to detonation engines.They diagnosed the primary sources of entropy generation and discovered that irreversibility was mainly caused by the leading-edge bow shock.Braun et al.[35] analyzed the energy conversion process of a detonation combustor with a bladeless turbine for subsonic to hypersonic flight.They found that the pressure ratio across the shock greatly affected engine power and loss.
When the gas drives the turbine, there must be flow losses regardless of how well the turbine is designed.Flow losses are the irreversible conversion of gas mechanical energy to heat energy,and the turbine, on the other hand, is a device that converts heat energy into mechanical energy.As a result, the flow losses generated by the previous stage are dissipated in the gas as heat energy.This portion of the heat energy generated by the flow losses can be partially converted into turbine work during the expansion process of the rear stage, thus improving the overall energy utilization of the turbine, which is known as the turbine reheat effect [36].Considering that the unsteady characteristic of pulse detonation tends to cause large turbine flow losses, the reheat effect of the detonation-driven turbine should be significant.Therefore, this paper developed a two-dimensional numerical model of a PDC coupled with a two-stage axial turbine.The work accumulation process and efficiency of the turbine were analyzed,and the reheat effect on the improvement of turbine efficiency driven by detonation was discussed.
2.Physical model and numerical method
2.1.Physical model
The two-dimensional planar model of the PDC and turbine coupling system is shown in Fig.1, which consists of the predetonator, main detonation tube, and two-stage axial turbine.Since the entire turbine is significantly larger than a single PDC,multiple PDCs are required to work simultaneously to meet the mass flow requirements of the turbine.Considering that the geometry and flow conditions of the PDC and turbine stage are periodic, a single PDC and a few cascades are sufficient to simulate detonation-driven turbine flow by setting periodic boundary conditions, which ensure simulation accuracy while reducing calculation resource consumption.Most of the current numerical studies for PDTE adopt high-energy ignition to initiate the detonation wave directly,but the detonation is typically initiated by the deflagration to detonation transition(DDT)process[37-39].Although the DDT process is instantaneous, the obstacles that accelerate the DDT process complicate the detonation tube structure, which impacts each phase of the pulse detonation cycle,such as the filling quality and the exhausting time.Therefore, to be closer to the actual operation of PDTE, the solid obstacles was adopted in the predetonator to accelerate the DDT process.The distance between obstacles was 3 cm and the blockage ratio was 0.4.The height of the pre-detonator was 3 cm, and the tube length was 20 cm.The premixed gas in the main detonation tube was directly initiated by the detonation jet generated in the pre-detonator.The height of the main detonation tube was 9 cm, and the length was 50 cm.
The two-dimensional turbine geometry was identical to the mid-span elementary stage cascade of the GE-E3two-stage high pressure turbine.This turbine was chosen because it is a highpressure turbine with two stages, which is suitable for the study of the turbine reheat effect.Although the three-dimensional flow of the turbine stage cannot be considered in the study of the elementary stage, the turbine stage is superimposed by multiple elementary stages along the direction of the blade height, and the flow conditions at different radii along the blade height are comparable.Given that the turbine flow is extremely unsteady under detonation-drive conditions, the analysis of the elementary stage flow prior to the study of the three-dimensional flow can facilitate a greater comprehension of the fundamental characteristics of the turbine operation driven by detonation.
The actual number of stators and rotors in the four rows was 46,76,48,and 70,which was modified to 48,72,48,and 72 to simplify the stator-to-rotor blade ratio to 2:3.The main geometric parameters of the blade profile and cascade are shown in Table 1,and their definitions are shown in Fig.2.Planes a, b, and c were used to record area-weighted average data to facilitate the computation of the turbine efficiency.Plane a was the first stage inlet;plane b was the first stage outlet and also the second stage inlet; and plane c was the second stage outlet.

Table 1Main geometric parameters of the blade profile and cascade.
Fig.1.Physical model and boundary conditions.
Fig.2.Schematic diagram of the main geometric parameters of the blade profile and cascade.
2.2.Boundary condition
All PDC walls and turbine blades were set to be adiabatic with a roughness of 0.5.The heads of the pre-detonator and the main detonation tube were inlet valves, controlling each phase of the pulse detonation cycle, as shown in Fig.3.
The valves were set to mass flow inlet during the filling premixed gas and air buffer phases, and the premixed gas was the stoichiometric hydrogen/air mixture.The mass flow rate for valve 1 was 0.1 kg/s and valve 2 was 1 kg/s.The filling pressure was 0.15 MPa, and the filling total temperature was 300 K.During the detonation propagation and exhausting phases,valves 1 and 2 were closed and set to the adiabatic wall.The ignition area was located at the head of the pre-detonator; the ignition temperature was 2000 K.The duration of each phase of a single pulse detonation cycle is shown in Table 2, and the total time of a single pulse detonation cycle was 18.6 ms;the detonation frequency was 54 Hz.
The rotor speed corresponded to the 100% design point, so the linear speed of the first and second stage rotors was 300 m/s.The second stage outlet was set to pressure outlet,and the back pressure was 52,000 Pa.Back pressure is used only when the flow is subsonic.If the flow becomes locally supersonic, the specified pressure will no longer be used;pressure will be extrapolated from the interior flow.The top and bottom boundaries of the turbine were set to be periodic,and the rotor/stator interfaces were processed with the periodic sliding mesh.
Fig.3.Schematic diagram of each phase of pulse detonation cycle.
2.3.Computational methodology
The commercial software ANSYS Fluent 2020R2 was used to solve the two-dimensional Unsteady Reynolds Averaged Navier-Stokes (URANS) equation, which is the mass, momentum and energy conservation equation of unsteady compressible flow.Since chemical reaction and turbine flow were carried out simultaneously,the turbulence model selected had to take into account the reliability of the simulation of reaction flow and turbine boundary layer flow.The k-epsilon model was used by Wang et al.[40,41]and Frolov et al.[42] to simulate the initiation and propagation of the detonation wave, and the simulation results agreed well with the experimental data.Therefore,based on the k-epsilon model,the y+insensitive wall function was used to deal with the viscous sublayer flow of the turbine blades, so as to improve the accuracy of the turbine boundary layer flow simulation.The O-type meshes were used near the blade wall to enhance mesh quality and compute accuracy;the height of the first mesh was 0.01 mm,the exponential growth rate was 1.1,and the number of O-type mesh layers was 15.
To consider the turbulence-chemistry interaction, the Eddy Dissipation Concept(EDC)model was chosen,and the 8 species,19-step chemical reaction mechanism of H2/air[43]was adopted.The Pressure Implicit with Splitting of Operators (PISO) scheme was used for the solution method, with second-order upwind spatial discretization and second-order implicit transient formulation.Since detonation initiation and propagation involved viscous flow,species transport, and complex chemical reactions, a small time step was required to ensure calculation convergence.In the rest of the phases, only viscous flow with species transport was involved,so the time step could be amplified appropriately.Therefore, the time step size was 1e-7 s during detonation initiation and propagation and 1e-6 s for the rest of the phases.
2.4.Grid independence test
2.4.1.Turbinecomputationaldomain
Three grid sizes of 1.5 mm,1.0 mm and 0.5 mm were selected todiscretize the turbine computational domain and simulate the 11th test condition of the GE-E3turbine in Appendix G of the NASA Report[44].At the test condition,the total pressure at the turbine inlet is 344,740 Pa; the total temperature is 709 K; the back pressure is 61,724 Pa.
Table 2Duration of each phase of a single pulse detonation cycle.
Table 3 displays the total temperature ratio and turbine efficiency calculated based on the simulation results.As the grid was continuously refined, the relative error of the total temperature ratio and turbine efficiency between the different grids was significantly reduced.The relative errors of the total temperature ratio and turbine efficiency were 2.1% and 2.5% for the 1.5 mm versus 1.0 mm grid,while they were decreased to 0.69%and 0.43%for the 1.0 mm versus 0.5 mm grid.This suggested that reducing the grid size to 1.0 mm had little effect on turbine flow simulation.Because calculating with the 0.5 mm grid requires more computational resources, using the 1.0 mm grid could ensure simulation accuracy while saving calculation time.Therefore,the 1.0 mm grid was selected to discretize the turbine computational domain.
The test value of the GE-E3two-stage turbine efficiency in the NASA report is 92.5% [44], and since the secondary flow losses at the end wall cannot be considered for the elementary stage flow,it was reasonable that the turbine efficiency calculated by the elementary stage simulation was slightly higher than the test value.
2.4.2.PDCcomputationaldomain
The PDC computational domain was also discretized with grid sizes of 1.5 mm,1.0 mm and 0.5 mm.The detonation initiation and propagation were simulated with an initial pressure of 0.1 MPa and an initial temperature of 300 K.It was found that the detonation could be successfully initiated with three grid sizes,but there were differences in the detonation wave propagation process.
By recording the position of the detonation wave(x1,x2)at two moments (t1,t2) after the formation of a stable detonation, the velocity of the detonation wave can be calculated:v= (x2-x1)/(t2-t1).Table 4 shows the effect of grid size on detonation wave velocity.The relative error of detonation wave velocity calculated by 1.5 mm and 0.5 mm grids was 0.69%,while the relative error of 1.0 mm and 0.5 mm grids was 0.06%.This indicated that reducing the grid size to 1.0 mm had little effect on detonation simulation results,so the PDC computational domain was also discretized with 1.0 mm grid.
Table 3Effect of grid size on total temperature ratio and turbine efficiency.
2.5.Validation
2.5.1.Validationofdetonationwaveparameters
According to the one-dimensional ZND model of the detonation wave [45], one of the key factors in determining detonation is whether the leading shock is coupled with the chemical reaction zone.Fig.4 shows the pressure and temperature contours of the detonation initiation and propagation.The detonation wave propagated into the main detonation tube and interacted with the tube wall to create two symmetrical high-pressure points and reflected waves.Under the action of the high-pressure points, a stable detonation wave was generated and propagated downstream.The pressure front and temperature front of the detonation wave were not decoupled during the propagation process, indicating that the self-sustaining C-J detonation wave had been initiated.
Table 5 compares the simulated results with the C-J values calculated by the NASA Chemical Equilibrium with Applications(CEA)Code program[46].Consistent with the previous section,the detonation wave velocity was measured after the detonation wave had stabilized,which corresponded to the definition of C-J velocity.Therefore, the relative error between the simulation results of the detonation wave velocity and the theoretical C-J value was only 0.96%.The maximum values of the detonation wave temperature and pressure were selected for the simulation results in Table 5.The relative error between the simulated detonation wave temperature and the C-J value was about 3.9%,and the simulated peak pressure of the detonation wave was about 1.4 times that of the C-J pressure.According to the variation of the thermodynamic parameters in the one-dimensional detonation wave[35],the maximum value of the detonation wave temperature is basically the same as the C-J temperature, while the maximum value of the detonation wave pressure is greater than the C-J pressure, which is basically consistent with the comparison results in Table 5.
Since multi-cycle simulations of pulse detonation were involved in Subsection 3.3,ensuring that each detonation could be initiated was a prerequisite for the research.Fig.5 shows the time history of detonation pressure for seven cycles,which was normalized by C-J pressure,i.e.,pCJ.All seven peak pressures clearly exceeded the C-J pressure, indicating that detonations were successfully initiated over seven detonation cycles.These results confirmed thereliability of the detonation numerical simulation.
2.5.2.Validationofdetonationwaveandturbineinteraction
The pulse detonation is characterized by strong unsteadiness,especially the powerful interaction of the detonation wave with the turbine blades.Therefore, to verify the reliability of the numerical simulation of the detonation wave and turbine interaction, certain key features of the simulation flow field were qualitatively compared to the experimental observations of Rasheed et al.[47],as shown in Fig.6.Since the detonation waves initiated under different conditions differ in detonation wave parameters (such as pressure and temperature) but have the same detonation wave structure, the flow field features of the detonation wave interacting with the turbine blades are comparable for different operating conditions.
Due to the lack of fuel required to maintain the detonation propagation at the turbine inlet, the detonation wave would decouple into a leading shock and a chemical reaction zone.The leading shock propagated at supersonic speed and entered the turbine channel before the reaction zone, where it was strongly reflected by turbine blades, bending the wavefront and forming a series of non-stationary bow shocks.The restriction of the PDC wall caused each bow shock to gradually evolve into a reflected shock propagating upstream with a series of reflected transverse waves,showing a very complex flow field structure.These flow field features were close to the experimental observations, demonstrating the reliability of the numerical simulation of the detonation wave and turbine interaction.
3.Results and discussion
In this section, the work and efficiency of the turbine were investigated by taking different control volumes (CV).By comparing the average efficiency of stages to the efficiency of the two-stage turbine, the improvement in turbine efficiency due to the reheat effect could be determined.
3.1.Turbine work and efficiency of the first and second stages
The strong unsteadiness of pulse detonation makes it impossible to calculate the turbine efficiency based on the study of steadyflow.As a result, a definition of turbine efficiency suitable for detonation drives must be developed.Since the derivation process of the second stage efficiency is similar to that of the first stage,the efficiency definition of the first stage was derived in detail,and the applicability of the definition was explained.
Table 5Comparison of the simulated results with C-J values calculated by CEA.
Fig.4.Pressure and temperature contours of the detonation initiation and propagation.
Fig.5.Time history of normalized pulse detonation pressure for seven detonation cycles.
Taking the first stage turbine as the CV and assuming the turbine flow was one-dimensional,which means the flow parameters vary only along the flow direction.
The energy into the CV
whereEis energy,Qis the heat exchange between the turbine and the environment,mis mass,his specific enthalpy,cfis velocity,andgzis gravitational potential energy;subscript a represents the first stage inlet.
The energy out of the CV
whereW1the actual work output for a single pulse detonation cycle; subscript b represents the first stage outlet and also the second stage inlet.
The variation of stored energy for CV is ΔECV,and the transient energy equation is
Neglecting the heat exchange between the turbine and the environmentQas well as the effect of gravitational potential energygz, Eq.(3) can be written as
Derivation of Eq.(4) for timet, then integration over the pulse detonation cycle, and the actual work output for a single pulse detonation cycleW1can be obtained.
whereqis mass flow rate.
Assuming that the working fluid is ideal gas, Eq.(5) can be expressed by state properties as
where ρ is density, v is axial velocity,Ais area,cpis isobaric heat capacity,T*is total temperature.
If the working fluid drives the turbine through an isentropic process,and according to the isentropic process equationTb,ad*=,the isentropic work output for a single pulse detonation cycleW1*can be obtained.Tb,ad*is the total temperature at the outlet of the first stage turbine under the isentropic process, andp*is the total pressure.
Turbine efficiency is defined as the ratio of actual work output to isentropic work output.The efficiency of the first stage turbine η1*can be written as

Fig.6.Comparison between simulation and experiment of detonation wave and turbine interaction.

Fig.7.Time history of density,ρ; axial velocity, v;isobaric heat capacity, cp; and total temperature, T*at planes a, b and c during the second detonation cycle.
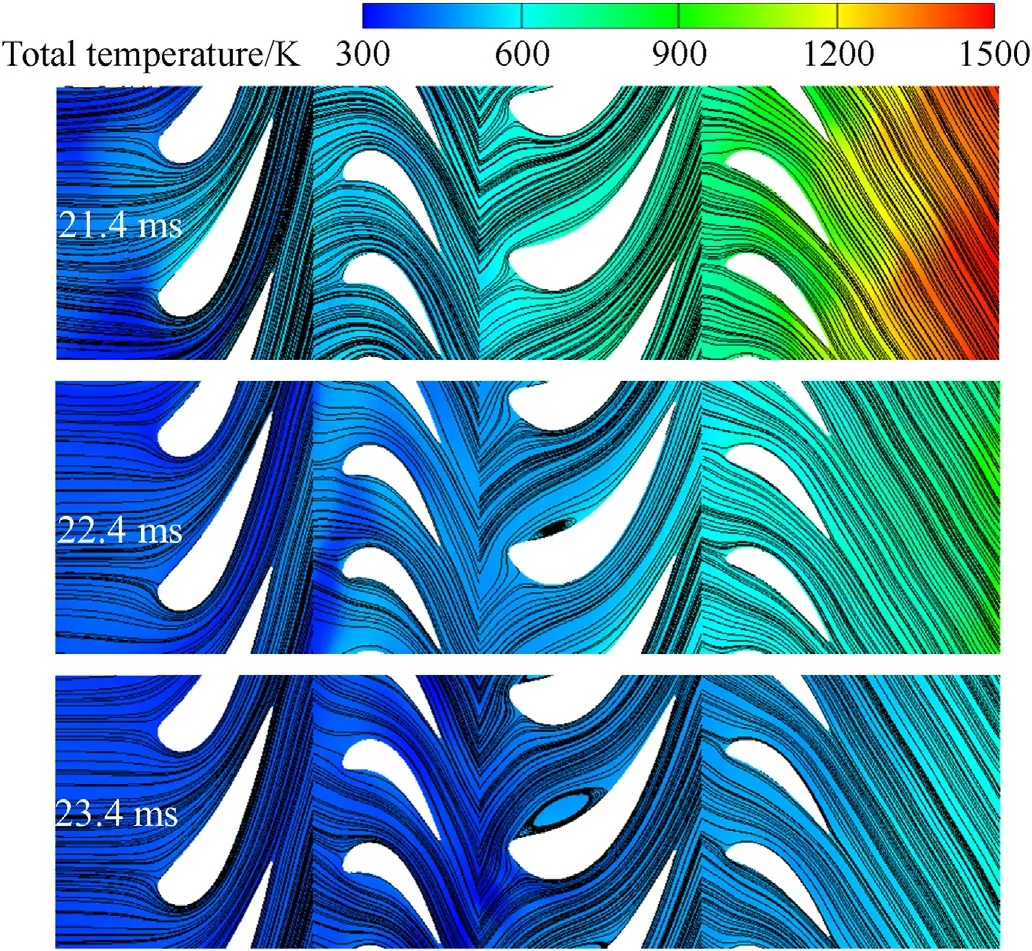
Fig.8.Total temperature contour and instantaneous streamlines distribution of the turbine flow field during the filling premixed gas phase.
Similarly, taking the second stage turbine as CV, the efficiency of the second stage turbine η2*can be written as
where,W2is actual work output of the second stage turbine, andW2*is isentropic work output of the second stage turbine; subscripts c is second stage turbine outlet.
Since the turbine was driven by pulse detonation, the turbine flow presented unsteady and periodic characteristics, so Eqs.(8)and (9) are close to the definition by Suresh et al.[30].However,for the first detonation cycle, the working fluid inside the turbine was low-temperature air at the start but high-temperature gas at the end, which resulted in the thermodynamic process of the turbine not forming a complete cycle,i.e., ΔECV≠0.Therefore,Eqs.(8)and (9) cannot be used to calculate the turbine efficiency for the first detonation cycle.This problem did not occur in the subsequent cycles because the working fluid was high-temperature gas at the start and end of the cycles.As a result,the second detonation cycle will be analyzed in detail.The time history of the flow parameters in Eqs.(8)and(9)during the second detonation cycle is depicted in Fig.7.It can be seen that the flow unsteadiness was most noticeable during the filling premixed gas and exhausting phases, and the reasons will be further investigated in conjunction with the change in turbine flow field.
The total temperature contour during the filling premixed gas is shown in Fig.8.The low-temperature air buffer from the previous cycle was gradually flowed into the turbine, which led to the total temperature of the turbine working fluid decreasing significantly,as shown in Fig.7(d).The decrease in total temperature represents the reduction in total energy, which adversely affected the expansion and acceleration of the working fluid.As can be seen from the instantaneous streamlines distribution in Fig.8,the attack angle of the airflow dropped significantly as the total temperature of the working fluid decreased, resulting in the impact and separation of the airflow when flowing through the turbine cascade.Especially for the second-stage stator, where the separation area of the pressure surface at 23.4 ms occupied a larger flow area.
Additionally,the main product of the hydrogen and air reaction is H2O,which has a high specific heat capacity due to the hydrogen bond.The combustion product was continuously discharged from the turbine as the air buffer flowed into it,causing the isobaric heat capacity of the turbine working fluid to drop dramatically,as shown in Fig.7(c).It is also demonstrated that if the turbine performance were calculated with a constant specific heat capacity,a large error would result.
During the exhausting phase, the detonation wave was decoupled into a leading shock and a chemical reaction zone, and the leading shock would interact strongly with the turbine blades.Fig.9 shows the density gradient of the turbine flow field,providing a clear view of the shock position at each moment.When the leading shock moved to the first stage inlet, the density at Plane a immediately rose to nearly 8 kg/m3,as shown in Fig.7(a).However,the strong reflection on the first stage stator caused the leading shock to be partially reflected upstream, resulting in some of the shock energy (kinetic and pressure energy of the shock wave) not being directly utilized by the turbine.Furthermore, part of the shock energy was extracted by the first stage rotor and converted into turbine work, which made the intensity of the leading shock gradually decrease as it moved downstream, so that the peak density at Plane b was only 2 kg/m3.This demonstrated that the first stage turbine significantly suppressed the leading shock intensity,which stabilized the intake condition of the second stage.
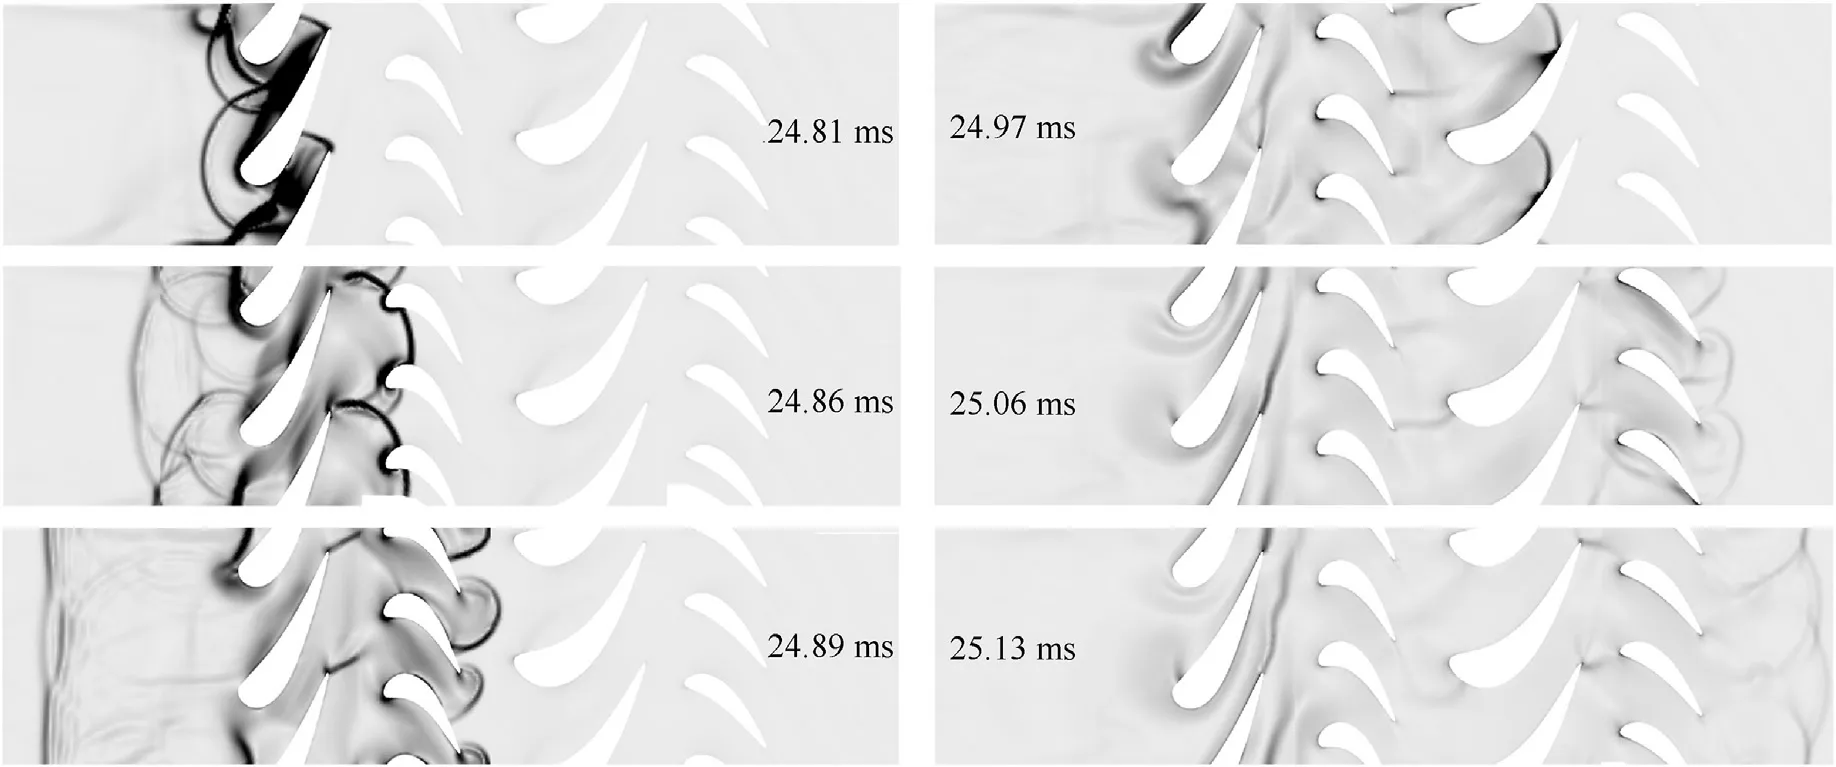
Fig.9.Density gradient graph of the turbine flow field during the exhausting phase.
Due to the leading shock traveling at supersonic speed, the turbine flow was instantly converted into a choke condition as the leading shock entered the turbine passage.The critical section limited the maximum flow capacity,and the blocked gas was driven upstream by the reflected shock,resulting in a negative axial velocity magnitude at Plane a,as shown in Fig.7(b),which indicated that an overall gas backflow occurred at the turbine inlet.The high temperature gas flowing into the turbine caused a sudden increase in total temperature and isobaric heat capacity, as shown in Figs.7(c)and 7(d), but then decreased slightly at Plane a, which was also caused by the momentary gas backflow at the turbine inlet.
Fig.10 shows the turbine work accumulation process of the first and second stages during the second detonation cycle.Work accumulation refers to the accumulation of total enthalpy drop of the gas at the turbine inlet and outlet.It can be seen that the accumulation of the turbine work was mainly in the exhausting phase, but due to the strong unsteadiness of pulse detonation, the actual work accumulation process of the first stage fluctuated considerably,which was far from the isentropic process.Timest1-t5were the five moments of the actual work accumulation process of the first stage turbine.The total enthalpy at the turbine inlet(Plane a)increased as the gas and shock arrived,but remained low at the outlet(Plane b),resulting in a large difference in total enthalpy and consequently causing a rapid accumulation of turbine work(t1-t2).The accumulation of turbine work decreased slightly due to the gas backflow at the turbine inlet(t2-t3), but continued to rise after the backflow was relieved(t3-t4).Because the inlet valves were closed during the exhausting phase, the shock was constantly reflected between the valve and the first stage stator, and each reflection reduced the intensity of the reflected waves, which led to the amplitude of fluctuations gradually decreasing (t4-t5).
Compared with the first stage, the actual work accumulation process of the second stage was less fluctuating and closer to the isentropic process, indicating that the reflection and power extraction of the leading shock by the first stage substantially reduced the unsteadiness of the pulse detonation,which was quite helpful for the efficient operation of the second stage.It should be noted that, the accumulation of the actual turbine work at the beginning of the exhausting phase was greater than the isentropic turbine work, but this did not contradict the Second Law of Thermodynamics.Because it had been emphasized that the study of turbine work for unsteady periodic flow must be based on the formation of a complete thermodynamic cycle, and any arbitrary selection of the integration interval for turbine work would lead to incorrect results.
Table 6 lists the turbine work and efficiency of the first and second stages under the second detonation cycle.Due to the large deviation from the isentropic process, the efficiency of the first stage η1*was only 73.2%.However, the first stage played an important role in suppressing the flow pulsation caused by pulse detonation, which made the intake condition of the second stage relatively stable,and combined with the smaller airflow deflection of the second stage, the efficiency of the second stage turbine η2*was up to 89.1%.The average efficiency of the first and second stages ηst*was 81.2%.
3.2.Turbine work and efficiency of the two-stage turbine
The actual work output of the two-stage turbineWTis equal to the sum of the work of the first and second stages.
However, the isentropic work output of the two-stage turbineWT*does not equal to the sum of the isentropic work output of the first and second stages,i.e.,WT*≠W1*+W2*.To defineWT*,the two-stage turbine must be taken as the CV for analysis.
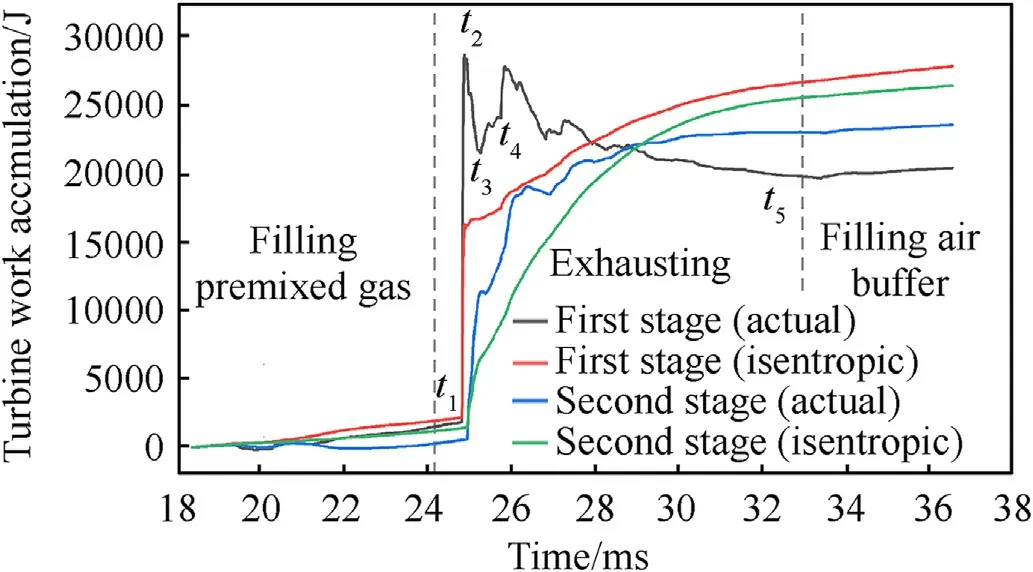
Fig.10.The turbine work accumulation process of the first and second stages during the second detonation cycle.

Table 6Turbine work and efficiency of the first and second stages under the second detonation cycle.
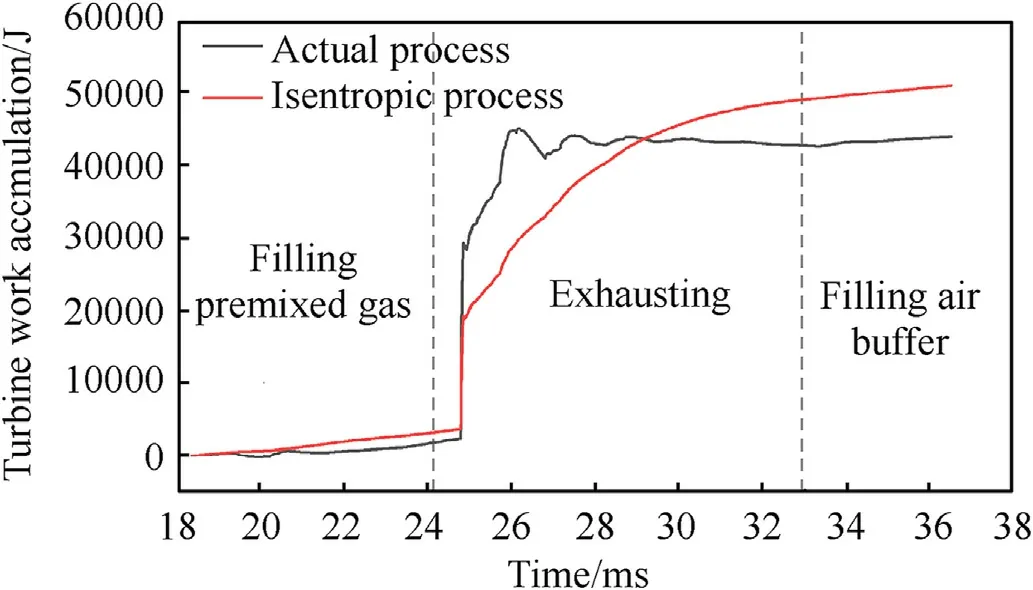
Fig.11.The turbine work accumulation process of the two-stage turbine during the second detonation cycle.
According to Eqs.(10) and (11), the efficiency of the two-stage turbine ηT*can be written as
Fig.11 illustrates the work accumulation process of the twostage turbine during the second detonation cycle.It is clear that the actual work accumulation process has characteristics of both the first and second stages.During the exhausting phase,the actual process experienced several fluctuations, which were primarily influenced by the work accumulation process of the first stage.However, the amplitude of the fluctuations was not so drastic because the work accumulation process of the second stage was relatively stable and compensated for the large fluctuations caused by the strong interaction between the pulse detonation wave and the first stage turbine.
Since some of the flow losses from the first stage were dissipated into the gas as heat energy, the total temperature of the second stage inlet would increase fromTb,ad*toT2*by reheat effect, which indicated the isentropic work output of the second stage increased.Therefore,the sum of the isentropic work output of the first and second stages was greater than the isentropic work output of the two-stage.
According to Eqs.(8)-(10) and (12),ηT*can be written as
Taking the average efficiency of the first and second stages ηst*.
According to Eq.(13),the relationship between ηT*and ηst*can be obtained.
This indicates that the efficiency of the two-stage is higher than the average efficiency of the stages,and the higher part is entirely attributed to the reheat effect of the turbine.Table 7 shows the work output and efficiency of the two-stage turbine under the second detonation cycle.The improvement in turbine efficiency due to the reheat effect can be obtained by comparing Tables 6 and 7 It can be seen that the average efficiency of the first and second stages ηst*was 81.2%,while the efficiency of the two-stage turbine ηT*was 86.1%, a 4.9% improvement in turbine efficiency.It was mainly because while the first stage turbine interacted with the pulse detonation wave to generate large flow losses, the suppression of the flow unsteadiness by the first stage made the second stage efficient,allowing much of the flow losses from the first stage to be recycled during the expansion process in the second stage,thereby improving the efficiency of the two-stage turbine.
3.3.Multi-cycle analysis
A multi-cycle simulation was conducted to ensure the reliability of the results, and the turbine efficiency was calculated for each cycle.Fig.12(a) shows the η1*and η2*from the second to the seventh cycle.Due to the multi-cycle effect,the flow field at the end of the previous cycle will affect the filling and DDT processes of the next, so that the different pulse detonation cycles cannot be guaranteed to be performed exactly the same,resulting in differences in turbine efficiency for six cycles.
Because the first stage turbine was directly connected to the PDC,it was severely influenced by the multi-cycle effect,which caused η1* to be unstable,even suffering a noticeable decline in the fifth cycle,and the strong flow unsteadiness caused by pulse detonation made η1*generally low.In contrast, the flow pulsation had been significantly suppressed by the first stage,and the intake condition of the second stage was relatively ideal.As a result, η2*was higher with little variation from cycle to cycle.To estimate the true η1*and η2*,the data in Fig.12(a) were used as samples to construct the 95%confidence interval(CI)using at-distribution,as shown in Fig.12(b).The 95%CI of η1*was wider,about 67.7%-77.6%,while the 95%CI of η2*was more concentrated,up to 89.4%-93.0%.

Table 7Work output and efficiency of two-stage turbine under the second detonation cycle.

Fig.12.(a) Data of η1* and η2* for multi-cycle detonation; (b) The 95% confidence interval for the true η1* and η2*.
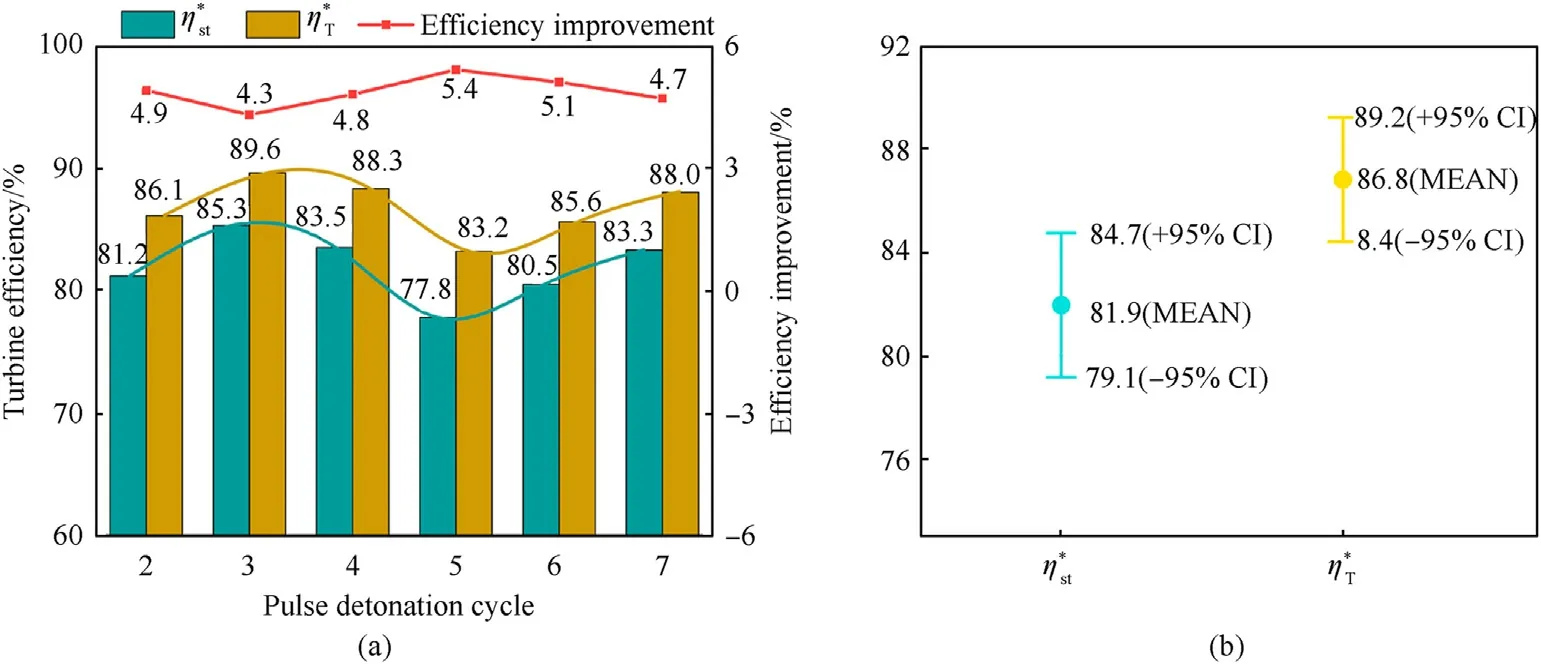
Fig.13.(a) Data of ηst*, ηT* and efficiency improvement for multi-cycle detonation; (b) The 95% confidence interval for the true ηst*, and ηT*.
Fig.13(a) shows ηst*, ηT*, and efficiency improvement for six detonation cycles.It can be seen that the fluctuation trend of ηst*and ηT*was basically the same, which means the efficiency improvement was relatively stable.According to the statistical results in Fig.13(b), the ηst*was 79.1%-84.7% at 95% confidence level, while the ηT*reached 84.4%-89.2%,and the efficiency improvement was stable at 4.5%-5.3%, which demonstrated that the reheat effect can effectively improve the detonation-driven turbine efficiency.
4.Conclusions
In this paper, a two-dimensional numerical model of the PDC coupled with a two-stage axial turbine was developed to investigate the work accumulation process and efficiency of the turbine driven by pulse detonation.By comparing the average efficiency of the first and second stages to the efficiency of the two-stage turbine,the improvement in turbine efficiency attributed to the reheat effect was determined.The main findings are as follows.
1) A strong unsteady characteristic was observed when the turbine was driven by pulse detonation, especially during the filling premixed gas and exhausting phases of the pulse detonation cycle.The inflow of the low-temperature air buffer reduced the total energy of the working fluid, resulting in a decrease in airflow attack angle and significant flow separation at the blade pressure surface.The leading shock interacted strongly with the first stage stator, which caused an overall gas backflow at the turbine inlet.
2) Large flow losses were generated due to the strong interaction between the detonation wave and the first stage turbine,which led to the work accumulation process of the first stage deviating from the isentropic process considerably.However, the first stage was critical in suppressing the flow unsteadiness caused by pulse detonation and stabilizing the intake condition of the second stage, which was beneficial to the work output of the second stage turbine.Therefore, at a 95% confidence level, the efficiency of the first stage was 67.7%-77.6%, and the efficiency of the second stage was up to 89.4%-93.0%.
3) Since the second stage was efficient, much of the flow losses from the first stage could be recycled by the expansion process in the second stage, which improved the efficiency of the twostage turbine.Therefore, at a 95% confidence level, the average efficiency of the first and second stages was 74.1%-84.7%,while the two-stage turbine efficiency was 84.4%-89.2%; the efficiency improvement was stable at 4.5%-5.3%, indicating that the reheat effect can effectively improve the turbine efficiency driven by pulse detonation.
Declaration of competing interest
The authors declare that they have no known competing financial interests or personal relationships that could have appeared to influence the work reported in this paper.
Acknowledgments
This work was financially supported by the National Natural Science Foundation of China through Grant Nos.12372338 and U2241272, the Natural Science Foundation of Shaanxi Province of China through Grant Nos.2023-JC-YB-352 and 2022JZ-20, the Guangdong Basic and Applied Basic Research Foundation through Grant No.2023A1515011663,the Practice and Innovation Funds for Graduate Students of Northwestern Polytechnical University through Grant No.PF2023010.

- Defence Technology的其它文章
- The interaction between a shaped charge jet and a single moving plate
- Machine learning for predicting the outcome of terminal ballistics events
- Fabrication and characterization of multi-scale coated boron powders with improved combustion performance: A brief review
- Experimental research on the launching system of auxiliary charge with filter cartridge structure
- Dependence of impact regime boundaries on the initial temperatures of projectiles and targets
- Experimental and numerical study of hypervelocity impact damage on composite overwrapped pressure vessels