
Wideband spectrum sensing using step-sampling based on the multipath nyquist folding receiver
2024-02-29 08:23KilunTinKiliJingSenCoJinGoYingXiongBinTngXuyingZhngYnfeiLi
Defence Technology 2024年1期
Ki-lun Tin , Ki-li Jing *, Sen Co , Jin Go , Ying Xiong , Bin Tng ,Xu-ying Zhng , Yn-fei Li
a University of Electronic Science and Technology of China, Chengdu, 611731, China
b China Electronics Technology Group Corporation 29th Research Institute, Chengdu, 610036, China
Keywords: Wideband spectrum sensing Sub-Nyquist sampling Step-sampling Nyquist folding receiver (NYFR)Multisignal processing
ABSTRACT Wideband spectrum sensing with a high-speed analog-digital converter (ADC) presents a challenge for practical systems.The Nyquist folding receiver(NYFR)is a promising scheme for achieving cost-effective real-time spectrum sensing, which is subject to the complexity of processing the modulated outputs.In this case, a multipath NYFR architecture with a step-sampling rate for the different paths is proposed.The different numbers of digital channels for each path are designed based on the Chinese remainder theorem (CRT).Then, the detectable frequency range is divided into multiple frequency grids, and the Nyquist zone (NZ) of the input can be obtained by sensing these grids.Thus, high-precision parameter estimation is performed by utilizing the NYFR characteristics.Compared with the existing methods, the scheme proposed in this paper overcomes the challenge of NZ estimation, information damage, many computations,low accuracy,and high false alarm probability.Comparative simulation experiments verify the effectiveness of the proposed architecture in this paper.
1.Introduction
The real-time operating frequency space used in modern electronic warfare is expanding with continued advances in modern radar systems.A noncooperative receiver requires the detection and parameter estimation of signals in the ultrawideband (UWB),which increases the difficulty of spectrum monitoring.One of the key challenges in UWB receivers is the extreme requirements for sampling devices; the absence of a high-speed analog-to-digital converter(ADC)results in the requirement of a significant amount of resources for signal acquisition.Many scholars have proposed various schemes for sub-Nyquist sampling and information gathering to overcome this restriction.
At present, the most commonly used UWB receivers divide the whole frequency spectrum into multiple narrow bands so that lowspeed ADC devices can be used to receive signals from multiple narrow bands after the division.The frequency-swept receiver and the analog channelized receiver are the two most commonly used architectures.The frequency-swept receiver is unsatisfactory while operating in an uncooperative environment because it has a low probability of signal interception.The analog channelized receiver architecture is the architecture most commonly used [1,2] to resolve the trade-off between the instantaneous bandwidth and dynamic range of UWB reconnaissance receivers.This kind of receiver divides the operating frequency band through narrowband filter banks and then uses low-speed ADC devices for sampling.
The analog channelized receiver is still limited by the sampling theorem,which solves the problem of signal reception at the cost of hardware resources.Although it is a mature scheme for use in the UWB,the analog channelized receiver has some problems,such as a complex RF structure, serious crosstalk between channels, and a large number of ADCs.
When the target signal has sparse characteristics in a certain transform domain, some scholars have proposed compressed sensing (CS) technology for sub-Nyquist sampling.The dimensionality of the signal can be reduced by designing an appropriate compressed sampling frame.Since D.L.Donoho,E.J.Candes and T.Tao et al.proposed and published CS theory in 2006,it has been of great concern and widely applied in many fields of signal processing [3-5].
The modulated wideband converter (MWC) is a CS receiver architecture proposed by Mishali and Eldar in 2010[6].The MWC can be regarded as a multichannel parallel random demodulation(RD)architecture,and each channel mixes the signal through a periodic pseudorandom sequence.Then, a low-pass filter and a low-speed ADC are used to obtain signal information.The measured signal can be accurately reconstructed in theory.The MWC is widely considered by the academic community because of its good theoretical performance.However, in engineering implementation,some nonideal hardware factors often lead to the failure of support set reconstruction, and the sensing matrix calculated theoretically may not represent the characteristics of the hardware system.Another constraint of MWCs is that it is very difficult to generate high-frequency periodic pseudorandom sequences in engineering.Additionally, the MWC system destroys some of the signal information,and signal reconstruction requires many calculations under high-signal-to-noise ratio (SNR) conditions, so it has difficulty meeting the requirements of practical applications.In summary,hardware error and high SNR are the key to limiting the MWC structure for practical applications.
G.L.Fudge et al.proposed another CS architecture called the Nyquist folding receiver (NYFR) [7-9].The NYFR, which is a secondary sampling system, folds all the signals into one narrow frequency band through periodic nonuniform analog sampling and then uses a low/bandpass filter and a single low-speed ADC for digital sampling.The NYFR adds a specific mark, namely, the Nyquist zone (NZ), to each frequency segment through analog sampling; thus, the signal frequency can be obtained by acquiring the NZ.Compared with other CS methods, the NYFR architecture has a clearer physical meaning, making it more similar to classical modulation theory.The subsequent digital signal processing is simpler than that of an MWC and shall not break the signal information.Moreover, it is a more easily implemented architecture in engineering.
However, the NZ broadens the frequency spectrum and power spectrum density (PSD) of the signal received by an NYFR; therefore, an NYFR cannot identify the received signal under several specific conditions.
(1) NYFRs have difficulty when the frequency of the received signal is located at an integral multiple of the sampling frequency or when the spectrum of the signal is broadened to cover the integral multiple of the sampling frequency.In such cases, spectrum overlap and information loss occur after signal receiving,and the methods for estimating the NZ and signal reconstruction become quite complex.
(2) NYFRs have difficulty when receiving multiple signals because all signals are folded into the same narrow frequency band, and overlap may occur between some signals that are far apart from each other in their original frequency.Furthermore, spectrum broadening increases the possibility of this phenomenon.When frequency aliasing occurs, it is necessary to extend the information of other dimensions(such as azimuth) to address the ambiguity.
(3) NYFRs perform poorly when the input signal is an extremely short pulse.The NYFR needs to accumulate the signal for a while to obtain the NZ parameter.In addition, the required time is often negatively related to the modulation bandwidth.However, excessive modulation bandwidth leads to serious spectrum broadening of the signal, which is not conducive to system performance.
In addition, the difficulty of NZ estimation is another challenge that limits the development of NYFRs.The logic of existing NZ estimation methods needs to be changed according to the input signal type.Taking the energy matching peak search algorithm as an example,when the input signal is a Mono pulse(MP),it needs to search for the highest spectral peak in the results,while when the input signal is a linear frequency modulation(LFM)pulse,it needs to search for the lowest spectral peak in the results,which is a great constraint of NYFRs.Moreover, the NZ contains positive and negative parts after being folded by NYFRs; the only difference between the two parts is that the time-frequency characteristics are opposite, which increases the computational difficulty in solving the NZ.To solve these problems, scholars have proposed three ideas: other modulations, such as LFM-based NYFR [10]; other structures,such as a synchronous NYFR[11];and a multipath NYFR,as in Ref.[12].However, these methods still have one or more disadvantages of the NYFR.
In most CS methods, when the obtained signal spectrum is aliased, regardless of whether the signal interferes with itself or another signal, complex algorithms are needed to reconstruct the signal.However, in the case of multipath signal processing, it is likely to find a path where there is no aliasing.
Multirate sampling (MRS) and multicoset sampling (MCS) are two common methods of multichannel sub-Nyquist sampling frameworks.Among them,MCS uses a delayer and a fixed-rate ADC for each sampling path and also suffers from frequency loss.In addition, MCS must ensure that the delay between different paths is extremely accurate, which is difficult to achieve in engineering implementation [13,14].
Each ADC device in MRS uses different sub-Nyquist sampling rates.The representative architecture of this framework is the coprime sampling architecture [15,16], and the more mature scheme is the two-channel coprime sampling structure proposed by Palghat.P Vaidyanathan in 2011.This algorithm uses the data of two channels to obtain the autocorrelation matrix of the signal,thus realizing the estimation of signal frequency.From the conclusion given by the existing algorithm,the number of signals it can process and the spectrum detection range are both positively correlated with the number of channels,which means the problem is solved at the cost of increasing hardware and algorithm computation complexity.
Based on the Chinese remainder theorem (CRT), by using the coprime sequence module, Pace et al.proposed the symmetrical number system [17] (SNS), extending it to the optimum symmetrical number system (OSNS) [18] and robust symmetrical number system (RSNS) [19].Meanwhile, the closed expression of the expandable dynamic range for each system was given.However,this method has a high probability of ambiguity.
The work in Ref.[20]reports an approach by Lin E.and Monte L.that is based on the CRT and MRS, namely, a joint frequency measurement and interferometric direction finder (IFM-IDF) architecture.Signals were sub-Nyquist sampled at different rates and processed by a discrete Fourier transform (DFT) at the same point number.The CRT was used to find the position of signals in the spectrum,and a lookup table was used to determine the DOA of the signals.The main problems with this method are as follows[21].(1)The number of DFT points is very important.Using the same DFT points at different sampling rates will make it difficult to apply some algorithms that need synchronization.(2) When using the CRT, if the input signal is located within the boundary of two adjacent channels,the signal may not be in the right place;thus,an error in the estimation of the signal frequency may occur.(3) This method cannot support multiple simultaneous signals.(4) I/Q sampling should be used when applying the CRT, which is quite difficult considering the practical frequency range.(5) The input signal is assumed to have a 1 MHz bandwidth, and wideband signals are not considered.
Sobhani, G.et al.proposed an improved scheme [21], Ref.[20]that still uses sub-Nyquist sampling at different rates to estimate the carrier frequency, which is referred to as step-sampling in the following for descriptive convenience.This scheme ingeniously designs the relationship between the sampling frequency and DFT points in each sampling path to obtain frequency domain data with the same resolution.More importantly,a DFT is used in place of the digital channelization process,where one DFT point represents one digital channel.The problem with frequency domain resolution in Ref.[20]is solved;in the meantime,the approach in Ref.[21]can be applied to the frequency measurement of multiple simultaneous signals.Additionally, two sampling rate selection criteria are proposed to clarify the maximum instantaneous signal bandwidth that can be resolved when avoiding aliasing.This scheme can quickly obtain the signal frequency, but some spurious peaks may occur when estimating multiple signals because each channel has only one DFT point.Moreover, although the frequency estimation accuracy of this scheme is low, improving the accuracy of frequency estimation will lead to problems in estimating broadband signals,so it is only used for rough frequency estimation.
The above two methods are based on the discrete frequency grid constructed by the CRT, which means that the performance of frequency estimation is limited by whether the signal deviates from the grid and the grid density.
In this paper, we propose an improved carrier frequency estimation architecture using a step-sampling multipath NYFR.In short, by designing the relationship between the sampling frequency and the number of digital channels,the operating frequency band is divided into multiple frequency grids in this scheme.In addition, high-precision NZ estimation is achieved based on the correlation and CRT,and then,high-precision frequency estimation is performed based on the NYFR.
To the best of our knowledge,the works reported based on MRS are mentioned above.Compared with the methods in Refs.[15,16,20], our scheme can effectively deal with the multisignal situation, and I/Q sampling is avoided.Furthermore, the proposed scheme avoids the occurrence of spurious peaks in Refs.[17-19,21]; moreover, it can improve the accuracy of frequency estimation through time accumulation.Compared with Refs.[7-9], this scheme can overcome the intractable signal loss,aliasing, and NZ estimation problems and other problems of the NYFR system, which are described in detail above.At the same time,this paper also has high realizability compared with Ref.[3-6]and fewer hardware resources than Refs.[1,2].
2.Proposed scheme
2.1.Single-path architecture
The radio inputx(t) is received by the single path Nyquist folding receiver,as shown in Fig.1.The key to the NYFR is to mix the input signal with a periodic nonuniform pulse train that has rich harmonic components so that the output signal contains the NZ information while retaining the full original signal information.
The periodically nonuniform sampling pulse train is generated through the zero-crossing rising-edge time of a modulation function, which primarily uses sine frequency modulation (SFM), as follows:
wherefsis the average sampling frequency, which is equal to the sampling rate of the ADC.The term θ(t) is the modulation of the sampling pulse train, which can be expressed as
wherefθis the modulation bandwidth.As such, the pulse train triggered by the zero-crossing rising edge through the acquisition modulation function can be normalized as follows [9]:
whereLis the absolute value of the NZ andmfis the modulation index, which is equal to 1.Some scholars have also accomplished this step based on optics [22].
The definition of the NZ is the same as that in Ref.[7], that is,(lfs-fs/2,lfs+fs/2), andl∈{1-L,…-1,0,1,…,L-1} represents thelth NZ.Note that when considering the influence of the negative half-axis,the bandwidth of the NZ is equivalent to half of the sampling frequency, while the NZ symbols alternate positively and negatively with increasing frequency.
The signal after mixing is copied and scattered to each NZ from the original frequency band in the frequency domain, so all signal information can be obtained by removing one specific NZ through a low-pass or bandpass filter.This paper uses a low-pass filter,which has the cutoff frequency set tofs/2.Finally, a path is completed through the ADC with sampling ratefs.

Fig.1.Single-path architecture of the NYFR.
2.2.Multipath architecture
In this scheme, input signals are divided into C paths through the wideband filter and the power divider and then sampled at different rates with the NYFR scheme, which is different from the multipath NYFR with the same sampling rate [12].The general block diagram of the scheme is shown in Fig.2.
In the diagram, the selection of sampling rate links with the number of digital channels,and one channelization bandwidth can be seen as one step; therefore, the difference in sampling rates in each path is a multiple of one step.
The sampling rate of each path can be obtained by specifying the number of digital channels, that is
wherefscis the sampling frequency of path c andNcis the number of digital channels for pathc.Through appropriate parameter selection, the digital channel bandwidth is fixed; thus, the subchannel data have the same frequency resolution.In all paths of the receiver, there are three differences in the output signals.
(1) The output data lengths are different, that is, the time resolutions of data points are different; the numbers of digital channels are different,but the subchannel bandwidths of all digital channels are the same.
(2) In different paths, the same signal may appear in different numbered digital subchannels,such as theith subchannel in one path and thejth channel in another path, wherei≠j.
(3) The NZ of the same signal from different paths may be different, which is due to the different numbers of folding times.
This section describes the receiver model proposed in this paper.Ref.[23] shows that the signal processing in this paper does not damage the signal parameters, such as the pulse width, time of arrival, and interpulse modulation mode.
3.Wideband spectrum sensing
When the same signal is sampled at different sampling rates,the number of folding times and the frequency remainder may be different.After the frequency grid is divided,according to the CRT,the corresponding channel in all sampling paths can be uniquely mapped back to the entire operating frequency band.When the signal correlation in the frequency domain confirms that a group of channels have the same signal,the frequency grid and the NZ of the signal can be determined.The schematic is shown in Figs.3 and 4.
If the highest operating frequency of the receiver isfmax, the highest sampling rate of ADC isfsmax, and the number of digital channels corresponding to the highest sampling rate isNC, the whole operating frequency band is divided into multiple grids with bandwidthfbase.Assuming that the number of grids isK, we can obtain
where the design of the base bandwidthfbaseis the focus.The sampling rate of each sampling path can be obtained by designing the number of digital channels, which can be selected as
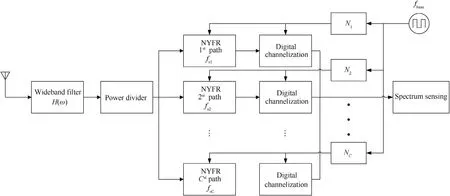
Fig.2.Multipath architecture of the NYFR using step-sampling.
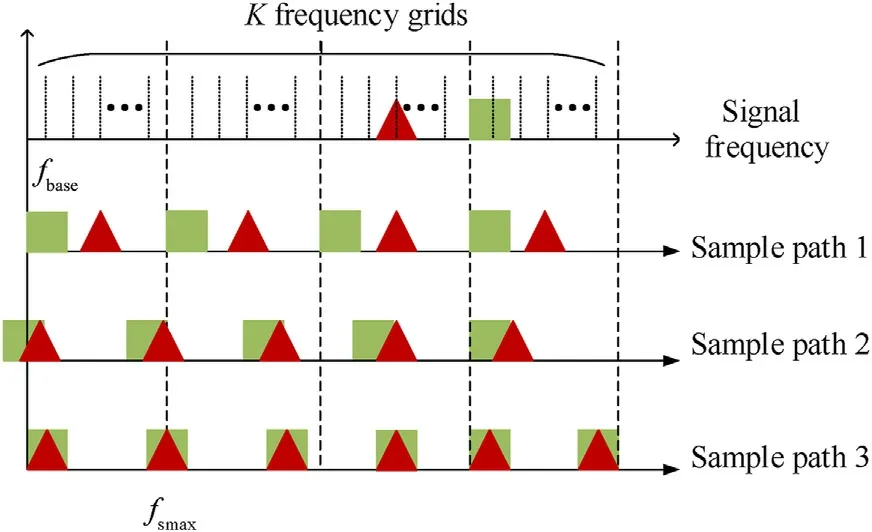
Fig.3.Schematic diagram of the frequency grid.

Fig.4.Schematic diagram of the sampling results.
Then, the sampling rate of thecth path is
Two new criteria were given for the selection of sampling rates in Ref.[21],which also applies to the architecture proposed in this paper.These criteria were based on the support of the maximum wideband signal processing capability while avoiding aliasing.Since the proposed scheme does not need a highNcto improve the frequency estimation precision,which is described in detail below,the step-sampling rate selection standards can be relaxed.
Through sub-Nyquist sampling,each frequency grid is received by different paths with different subchannel numbers, and its corresponding relationship can be expressed as aC×Kmatrix[21].
where mod refers to taking the remainder.Each column ofGcorresponds to a frequency grid,which represents the digital channel number located in each path.The symbols of the elements also show some folding results.When considering an engineering application where there is no negative frequency, this mapping relationship, including the subsequent Rkmatrix construction method,should be modified accordingly.If there is a signal in a grid numberedk,the signal should be observed in all the corresponding subchannels specified by matrix G.Therefore, to determine which grid has a signal, the corresponding correlation matrix should be constructed for allKfrequency grids.
whereXc,gc,kis the 1×LDFT data of the corresponding subchannelgc,k, which present thekth grid in thecth path, so a signal processing model that can be used to sense the spectrum is established, where Ykis aC×Lmatrix and Rkis aC×Cmatrix, which represents the correlation of signals.The analysis ofRkcan be considered a spectrum-sensing process because the value of this matrix reflects the following properties [21]:
(1) The minimum element of matrix Rkapproximates the signal amplitude at thekth frequency grid.
(2) The median value of matrix elements can be considered the signal amplitude of thekth frequency grid.
(3) The largest eigenvalue of matrix Rkapproximates the signal amplitude at thekth frequency grid.
The sensing results of each frequency grid can be obtained by using Rk, and the signal frequency can be obtained by selecting appropriate threshold values.If there is a signal in frequency gridk,the NZ of pathcmaps into
whererounddenotes rounding.
For example, assume there is a three-path system without loss of generality.The folded labelgc,kof frequency gridkis known,and its correct corresponding data matrix is
Assume that the remainder of the signal frequency to frequency grid isj; when considering the ideal situation, which can be represented as
whereAcis the amplitude of pathc.The corresponding Rkcan be expressed as
The properties of the matrix agree with the results of the analysis.
Additionally,nonuniform analog sampling should be considered when analyzing Rkmatrix elements.The modulated signals output by the ADC of pathccan be expressed as Ref.[9]
whereAcis the signal amplitude output by pathc,f0is the signal frequency,kNZcis the NZ of pathc,ψ(t)is the signal modulation,φcis the signal phase, andnc(n) is the noise.The NYFR converts the signal into the original-SFM composite modulation signal, the signal frequency is folded intof0-kNZcfsc,and the SFM modulation coefficient is a known system parameter.Assuming that the input signal is an MP signal, its spectrum has only one spectral line,regardless of the impact of phase and noise on the signal, and the output signal can be written as
whose Fourier transform is
whereJn(·)is the first-class n-order Bessel function,ω0is the signal carrier frequency,ωscis the path sampling angular frequency, and ωθis the modulation angular frequency.The above formula shows that the spectrum of the output signal is no longer a single spectral line but consists of a series of spectral lines.This series of spectral lines takes ωc-kNZωscas the center and ωθas the interval,and the left and right both have |kNZ| spectral lines.
The NYFR also causes another problem.When the frequency of the input signal is high, the number of folding times of the signal may be different at different sampling rates.Therefore, the constructed Rkmatrix needs to be updated.Considering a three-path system, the folded labelgi,kof the signal and the frequency gridkare known, and the input signal is an MP signal, the ratio of the signal frequency to the frequency grid isj,and the NZs of the three paths are.Considering the ideal normalized spectrum, according to Eq.(18) we can obtain
The corrected matrix elements still represent the existence of signals, and only the edge spectral lines in the higher NZ may be lost.Fortunately, the amplitude of these lost spectral lines is very low; thus, only a small part of the signal energy is lost.
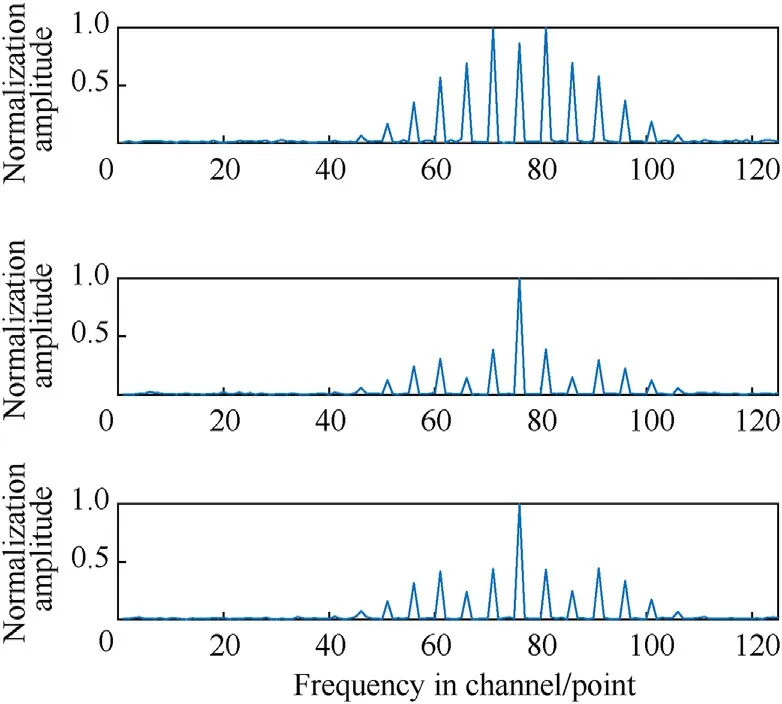
Fig.5.Schematic diagram of different NZs.

Fig.6.Multisignal case 1.
Another possible problem is that the signal frequency is just at the boundary of the frequency grid after broadening.This problem also occurs when the signal is directly step-sampled when facing broadband signals.Ideally, the signal will be detected in two adjacent frequency grids, but the relative amplitude of both positions will decrease.
Additionally, the proposed scheme can deal with multisignal processing well;furthermore,there are several special multisignal cases different from the step-sampling case, so it is necessary to analyze them.
As shown in Fig.6, there is strong staining when there are signals in the subchannels of the selectedCsampling paths, but they do not belong to the same signal.The ratio of the signal frequency to the frequency grid is different.Assuming that the corresponding frequency grid of the three MP signals isk1,k2,k3,that the ratio of their frequency to the frequency grid isj1,j2,j3,and that the NZs of the three paths are allkNZ= 1, we can obtain
Because the remainderjcof the frequency grid is different,only the diagonal elements of the matrix Rkare theoretically nonzero.
In this case, correct identification and elimination can be completed,no matter how many such signals exist.
The second possible scenario is that in all subchannels corresponding to a certain frequency grid,some subchannels have signal 1 and others have signal 2,similar to Fig.7.The scheme in Ref.[21]is very prone to error in this case because every bin of the DFT represents a channelized subchannel.As long as there is a signal,regardless of whether the signal is correlated,a spurious peak will be generated when its frequency grid satisfies the CRT.
The proposed scheme can avoid spurious peaks.Another possibility is that the original distance between two signal frequencies is too small to distinguish by channelization.This situation can be identified and estimated separately by conventional methods such as multilevel channelization.
The third possible multisignal scenario is that in the different subchannels corresponding to frequency grids, different signals partially intersect at the edge of the spectrum due to bandwidth broadening, which will lead to nonzero partial nondiagonal elements of the matrix,but because signal broadening exhibits Bessel characteristics,the spectral amplitude at the edge is extremely low.This is shown in Fig.8.
The fourth possibility is that in some subchannels corresponding to the frequency grid of one signal,other signals are aliased with the target signal.Fortunately,this phenomenon does not affect the detection of the signal according to the signal correlation; meanwhile, this has difficulty occurring in all subchannels at the same time, so aliasing can be eliminated by precise estimation of the signal.This is shown in Fig.9.
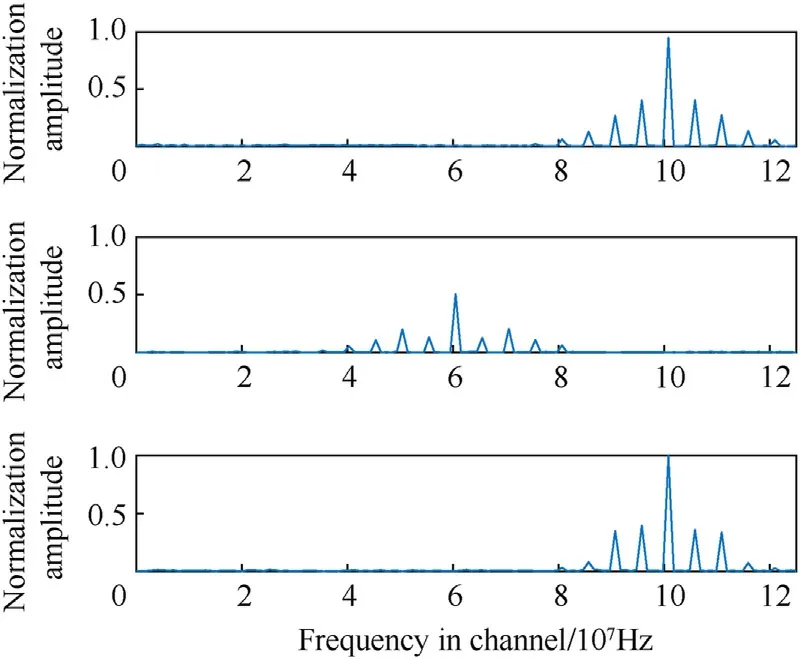
Fig.7.Multisignal case 2.

Fig.8.Multisignal case 3.
Fig.9.Multisignal case 4.
By selecting appropriate elements in the Rkmatrix, the proposed architecture can correctly exclude these four cases, which[21] cannot.
Another possibility is that the frequencies of multiple signals can have the same remainder at the same time for the sampling rate in each path, that is
wherefiis the frequency of theith signal,fsiis the sampling frequency of theith sampling path,andfremiis theith remainder.This multisignal condition occurs when
Despite the small probability, this situation will have a significant impact on spectrum sensing.In the perception results, there will be additional false peaks that are not associated with any real signal,especially when the input signals have the same modulation type.This problem cannot be solved by the step-sampling method alone.As an example, suppose that a three-path system has three input signals with the same modulation type.Suppose that the three signals have the same frequency remainderfremifor the sampling rates; then, the sensing result of the system atfremiis
As a result,a false signal with a frequency offremiis introduced and cannot be identified as such by the sensing method.This paper proposes a scheme that can handle this situation with the introduction of the NYFR.As a judgment, the NYFR can match each sensed signal once.Signals can be judged as true when the matching result matches the NZ corresponding to the signal frequency; otherwise, they can be discarded.In Section 4.3, the method is simulated.
It is common to select the median value of matrix Rkas the result of spectrum sensing.When the same signal does not exist in the frequency grid, most of the elements in the matrix represent noise.However, the frequency is can be determined when all subchannels have the same signal,so using the median value may cause some finite subchannels to erroneously have the same signal.
Another simple solution is to select the minimum value because all elements in the matrix represent the degree of correlation of the received signal of interest.When there is at least one group of uncorrelated signals,there is no signal in the frequency grid.At this time, the minimum-value element represents noise.Therefore,using the minimum value can effectively reduce the false alarm probability.However,because the introduction of the NYFR leads to the broadening of the signal spectrum and the reduction in the matrix element, the minimum value may become insensitive.
A reliable scheme is to detect the intermediate level feature if matrix Rk(C×C)is sorted in descending order,so the intermediate element between the minimum value (data numberC^2) and the median value (data numberC^2/2) is also a suitable option for detecting the presence of signals,assuming thatCis large enough.
Additionally, the step-sampling method can use the sensing frequency obtained from the rough estimation to guide the signals sampled by each path to jointly estimate the frequency.However,as mentioned earlier,the spectrum sensing results sometimes have spurious peaks.Since direct step-sampling is an undersampling mode, it cannot complete the ambiguity resolution.The NYFR can solve both the resolution and spurious peak problems well.
Note that step-sampling is used to estimate not the frequency but the NZ;it is more effective,with high speed and high precision,than frequency estimation by step-sampling and the NZ solved by the NYFR alone.After spectrum sensing,Csubchannels corresponding to the frequency grid of one signal are extracted.Suppose that the NZ corresponding toCpathsand thatCsubchannels are demodulated.If the results match,the signal is considered to be correct; on the other hand, the spectrum sensing results are considered to be spurious peaks if they do not match.
After demodulating, high-precision recovery signals can be obtained by all paths.As mentioned above, according to the CRT, the signal carrier frequency must be at the same location in the corresponding subchannels.If the ratio of the signal carrier frequency to the subchannel isfchannel,this signal in itscth subchannel can be expressed as
Then, the demodulation process of thecth subchannel can be expressed as follows:
wheremfis the modulation index andfθis the modulation bandwidth, both of which are known.AllCsubchannels of frequency gridkare compared after demodulation.If the demodulation is correct,Cmeasurement frequenciesfchannel+Δfccan be obtained,where Δfcis the frequency measurement error of pathc; then, the signal frequency is
The recovered signal can be used to estimate other parameters of the signal.The NYFR does not destroy the signal parameters, so the architecture proposed in this paper can obtain all parameters of the signal, the demodulation process is shown in Figs.10 and 11.
In this paper, the frequency estimation resolution can be improved by time accumulation because the data length of every subchannel is increased through time accumulation, and the frequency estimation resolution shall be the same as the resolution of the subchannel bin.The achievable resolution is
where Tao is the total time.Assuming thatfsc= 4 GHz,Nc= 32,Tao = 1 μs, we can obtain

Fig.10.Signal reconstruction before.
Fig.11.Signal reconstruction result.
When the time accumulation Tao increases,the accuracy of the frequency estimation increases.Therefore, the proposed architecture can achieve high-precision and unambiguous frequency estimation.
Note that the introduction of the NYFR is equivalent to the introduction of one-dimensional easy-to-use parameters to the step-sampling architecture.Its usage includes not only the method mentioned above but also other methods,such as conjugating and multiplying two signals of all subchannels separately.Because the signal carrier frequencies are consistent and the modulation is different, the signal obtained should be an SFM signal with a frequency of 0 Hz; for example,
The signal parameters are all known,and the correctness of the peak value in the frequency grid can be obtained by verifying this signal.
4.Simulation and discussion
To verify the effectiveness and performance of this architecture,suppose a receiver contains three sampling paths with a maximum operating frequency of 18GHz.The highest sampling rate isfsmax=4 GHz, and the corresponding number of digital channels isNmax= 32; then, we can obtainfbase= 125 MHz,K= 144.The channel number isNc= {24,26,32}, so the step-sampling rates can be determined asfsc={3 GHz,3.25 GHz,4 GHz}.Suppose that each path has the same modulation bandwidthfθ = 5 MHz and modulation indexmf= 1.Parts of the encoding matrix G are shown in Table 1.
4.1.NZ estimation
First, to verify the effectiveness of the NZ estimation, let the pulse width of all input signals be τ =1 μs,signal 1 is an MP signal,and the carrier frequency is located atfc1=6.5 GHz,that is,across the frequency grid; signal 2 is a wideband LFM signal, the carrier frequency is located atfc2= 10.15 GHz, and the frequency modulation slopeK= 20 MHz/μs; and signal 3 is a binary phase shift keying(BPSK)signal,the carrier frequency is located atfc3=8 GHz,the code is 1001100110, and this signal frequency is an integral multiple of the sampling frequency(see Fig.11).These three signals include some cases that are generally impossible to process with the NYFR alone or step-sampling alone.Two experiments were conducted with SNR=5 dB and SNR = -15 dB,and the results are shown in Fig.12.
The figure shows that the proposed architecture can correctly estimate the NZ in some nonideal situations.Signal 1, which represents the situation across the frequency grid, can correctly estimate the NZ.When facing a wideband signal such as signal 2,regardless of where the leap over of frequency grids occurs, the proposed scheme can work correctly at the expense of an amplitude decrease.When processing a signal such as signal 3,in which energy is too dispersed, it may be wrongly estimated as a broadband signal(it appears on two frequency grids),and both frequency grids should be used for further processes.Fig.13 shows the results of signal 3, which is across the frequency grid in subchannels.
One hundred independent experiments are carried out with SNR = -25 dB ~0 dB,the correct rate(CR)is used to measure the performance, and the result is shown in Fig.14 to compare the performances.Figs.15-17 compares the NZ estimation accuracies of the MP signal, LFM signal and BPSK signal received by different NYFR-based algorithms, including the Bessel peak match (BPM)[25], dual-channel NYFR (DDNYFR/SDNYFR) [24,25], peak search,sliding window matching (SWM), time-frequency curve fitting(TFCF) [8], and Matching Component Function (MCF) [26]algorithms.

Table 1Encoding matrix G.

Fig.12.Spectrum sensing results, 5 dB (left), -15 dB (right).

Fig.13.Signal 3 in subchannels.

Fig.14.NZ estimation performance.

Fig.15.NZ estimation with the NYFR alone (MP signal).
Compared with the direct calculation of the NZ, the scheme proposed in this paper has better antinoise performance and adaptability to signal types.Assuming that the normal signal represents a signal that does not cross the frequency grid,when facing the normal signal, the proposed scheme can reach a 100% correct rate with SNR =-21 dB without considering its modulation type.In contrast, algorithms of the direct NZ calculation cannot work without signal modulation types.

Fig.16.NZ estimation with the NYFR alone (LFM signal).
Fig.17.NZ estimation with the NYFR alone (BPSK signal).
4.2.Frequency estimation
After estimating the NZ,the signal frequency can be obtained by all (or one) subchannels corresponding to the grid.Suppose that there are two signals:an MP signal located infc1=14.3 GHz and a wideband LFM signal with the bandwidthB=100 MHz located infc2= 5.64 GHz.The channelization results and signal reconstruction results of the accumulation times Tao=1 μs and Tao=2 μs are shown in Figs.18-23.

Fig.18.Subchannel results of 1 μs.
Fig.20.Subchannel results of 2 μs.
The figure shows that the proposed scheme can effectively improve the estimation accuracy of the signal frequency when the time accumulation increases.One hundred independent experiments are carried out, the root mean squared error (RMSE) of different time lengths with respect to the normal signal is shown in Fig.24, and the RMSE converges to RMSE = 1/Tao.The RMSE mainly comes from the NZ estimation error.These figures also show that the proposed scheme can be used to estimate the signal bandwidth.
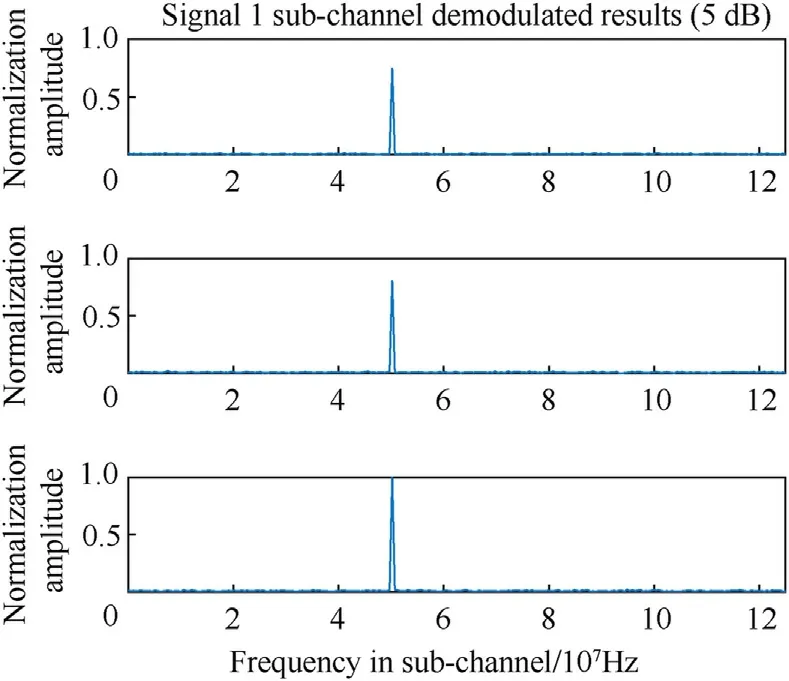
Fig.21.Signal reconstruction results of 2 μs.

Fig.22.LFM signal reconstruction results of 1 μs.

Fig.23.LFM signal reconstruction results of 2 μs.
4.3.Comparison and discussion
To compare performances, we build a three-path system based on Ref.[21]and set the first case as the same as that of 4.1.Assume that there are five signals received at the same time,including four MP signals and one wideband LFM signal, that the frequencies arefMP={4 GHz,7.2 GHz,8.7 GHz,13.9 GHz},fLFM=5.5 GHz,and that the bandwidth of the LFM signal isB=200 MHz.The results of the proposed scheme and the scheme in Ref.[21]are shown in Figs.25 and 26 with a SNR = 0 dB.

Fig.24.Frequency RMSE results of different time accumulations.
When processing multiple signals at the same time, the minimum value and the intermediate value have better performance.Because of frequency spreading,signals with high carrier frequency yield lower amplitude,but this does not affect detection.Obviously,a one-point DFTcan hardly handle the low-SNR case,so the number of DFTs must be increased.For the second case for the scheme in Ref.[21],NDFT= {3072,3328,4096}; in this case, the sampling rates do not change, but the frequency grid bandwidth decreases,withfbase=freco≈1 MHz.The frequency resolution is improved to the same degree as the proposed architecture inNc={24,24,32},Tao = 1 μs.The result is shown in Figs.27 and 28.
Increasing the number of DFT points reduces spurious peaks and improves the accuracy in Ref.[21], but Figs.27 and 28 show that even if the same accuracy as the proposed scheme can be achieved,the scheme in Ref.[21] will lead to incorrect estimation of the broadband signal, and the amplitude of such signals will become extremely low (lower than the MP signal of nearly 20 dB in this experiment) and easily contaminated by noise.
Additionally, to verify the capability of spurious peak elimination of fifth multisignal case in section 3, another experiment is conducted in which there are three MP signals with frequencyfMP={6.3 GHz,6.8 GHz,8.3 GHz} with the same accuracyfreco=1 MHz.Thus, it can be calculated asNc={24,26,32},Tao=1 μs for the proposed scheme andNc={3072,3328,4096} for the scheme in Ref.[21], and we can obtain Figs.29 and 30.The simulation results are consistent with those in Section 3 for the multisignal case (5).Because the remaining input signal frequencies and sampling rates are the same,the spurious peak occurs infrem1=frem2=frem3= 300 MHz.The approach in Ref.[21]cannot eliminate this kind of error,while the proposed scheme can deal with it.The results are shown in Figs.31 and 32.
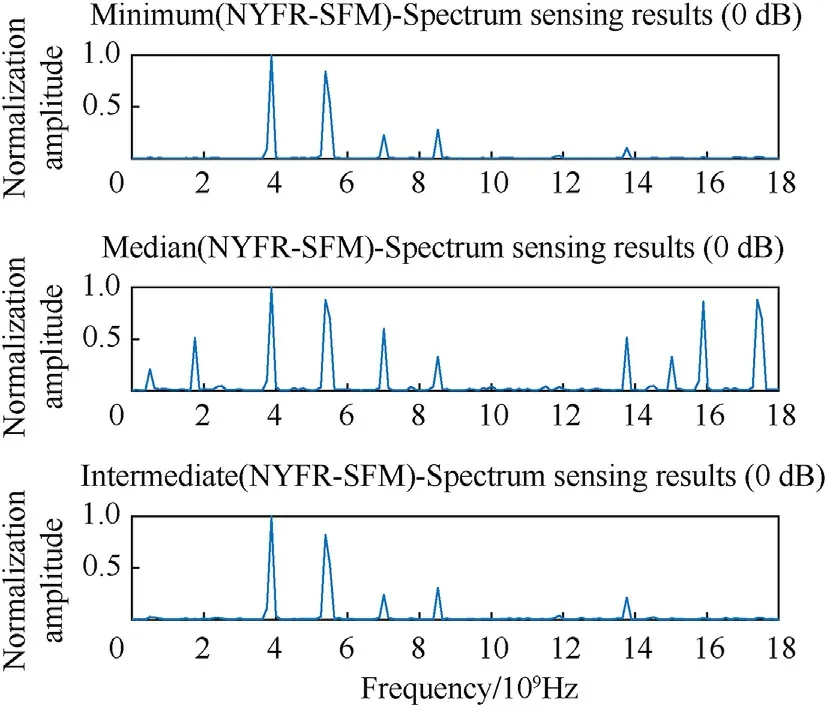
Fig.25.Proposed architecture result.
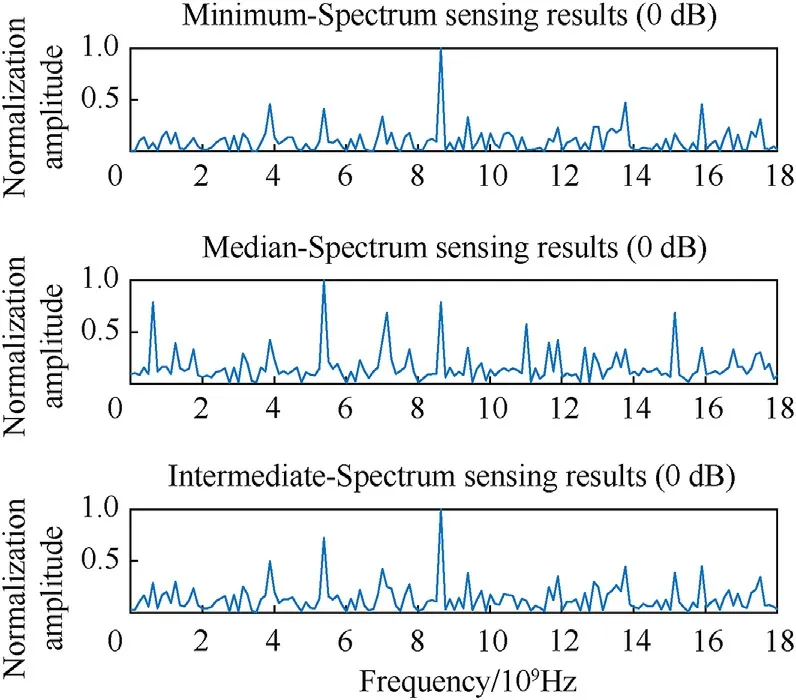
Fig.26.Reference architecture result.
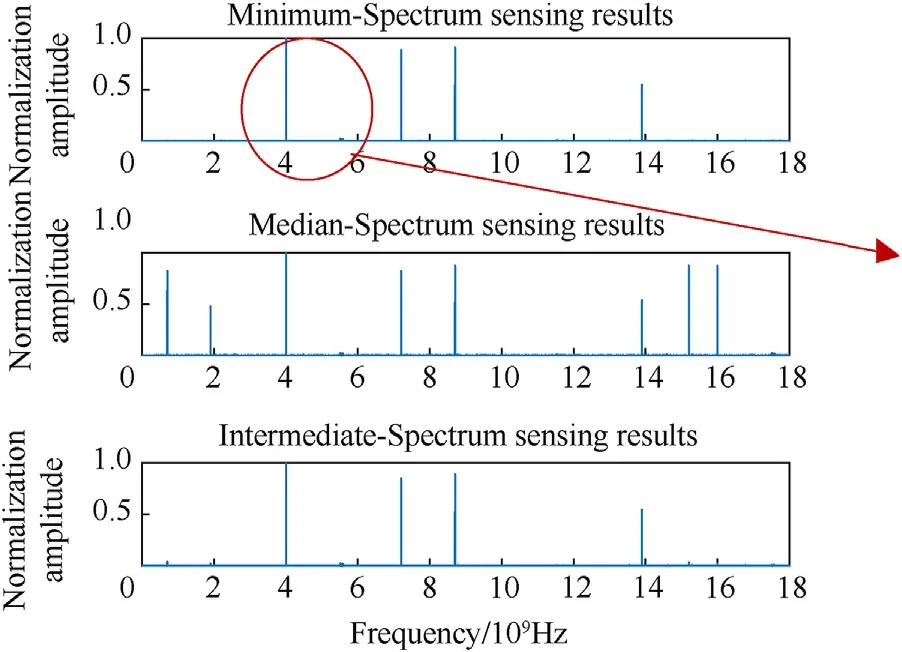
Fig.27.Spectrum sensing results.

Fig.28.Signal power detail in Fig.27 (dB).

Fig.29.Proposed architecture result.
The result of extracting all target subchannels is shown in Fig.31.When applying the energy matching method to the spurious signal located infremi= 300 MHz,NZ=0 should be obtained, but the calculation result isNZ=2,as shown in Fig.32.Therefore,it can be concluded that the signal in this frequency grid is a spurious peak.From Figs.29-32 we can conclude that the proposed method can effective deal with the fifth multisignal case in Section (3)

Fig.31.Extracting all subchannels.
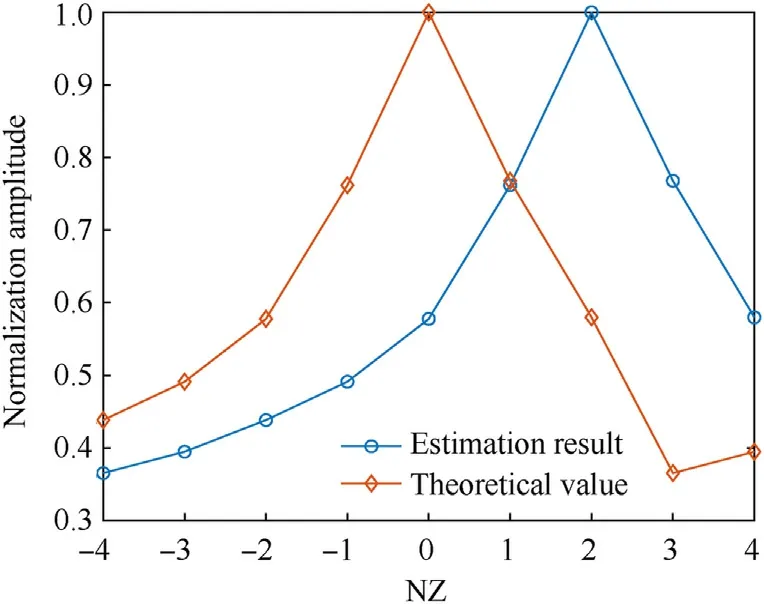
Fig.32.NZ matching result.In summary, the architecture proposed in this paper has good multisignal processing and spurious peak elimination capabilities.
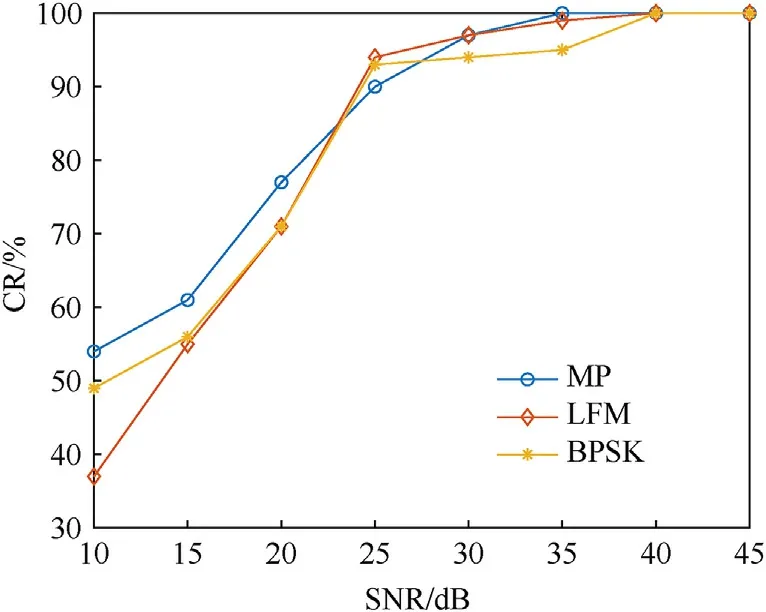
Fig.33.MWC signal-band index estimation.
In the classical MWC architecture,unlike the design proposed in this paper,each sampling path uses the same sampling rate,so the MWC has to perform complex signal reconstruction calculations.In general, CS-based reconstruction methods require SNRs in the range of tens of decibels.A newer scheme was proposed by Ref.[27]to estimate the signal band index without reconstruction.Fig.33 shows the simulation results of the estimation accuracy, and the simulation parameters are the same as those in Section 4.1.The figure shows that the correct estimation of the signal band index requires at least a SNR =25 dB to achieve 90% accuracy.This is much higher than the SNR required by the proposed scheme.
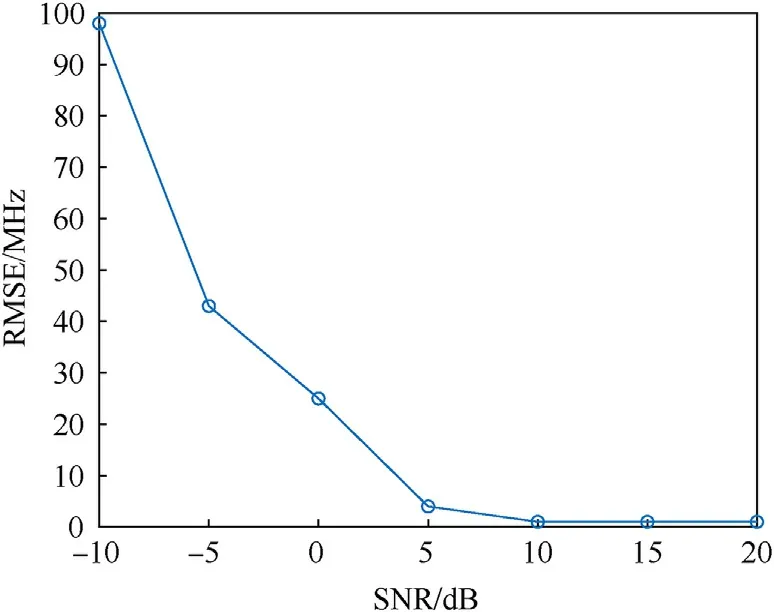
Fig.34.CRT-MWC frequency estimation RMSE.
Additionally,some scholars have proposed a multisampling rate MWC frequency estimation scheme based on the CRT [28] similar to the scheme in this paper, but this scheme also requires a high SNR.Fig.34 shows the RMSE simulation results of its frequency estimation.Optimal accuracy is achieved at SNR =10 dB,which is far higher than the SNR required by the scheme in this paper,which is shown in subsection 4.2.As a result,the scheme proposed in this paper is more noise-adaptive than the MWC.
The simulation results in this section demonstrate that the proposed scheme performs better in multiple signal processing and low SNR environments than other similar schemes.
5.Conclusions
A multipath NYFR architecture with a step-sampling rate for the different paths is proposed.The different numbers of digital channels for each path are designed based on the CRT.Then, the detectable frequency range is divided into multiple frequency grids; in this way, the NZ of the input can be obtained by sensing these grids.Additionally, high-precision parameter estimation is performed by utilizing the characteristics of the NYFR.Through the above analysis, the following conclusions can be drawn:
(1) The proposed architecture can extract signal information with high accuracy and no ambiguity.The effectiveness of the scheme is verified by simulation experiments.
(2) The proposed architecture solves the problems of common NYFR-based or improvement schemes.Most importantly,for a signal whose frequencies are located at multiples of the sampling frequency, the information loss problem is addressed by the architecture proposed in this paper.Signal aliasing problems are also relieved.
(3) NZ estimation by the NYFR requires an average SNR of nearly -7 dB; meanwhile, the signal modulation type must be known.Under the same simulation conditions, the proposed scheme can achieve the NZ estimation correctly atSNR=-21 dB without considering the signal modulation type.Furthermore, the computational complexity of the NZ estimation is reduced.
(4) Step-sampling is a new sampling scheme, but existing sampling schemes have problems such as difficulty in improving accuracy, the existence of spurious peaks, multisignal processing,and broadband signal processing.In this paper,stepsampling is improved and combined with the NYFR to improve the frequency estimation accuracy without information loss, spurious peaks are eliminated, and the multisignal problem is solved.
(5) The architecture has the potential to measure the direction of arrival.Meanwhile, array signal processing can improve the noise immunity of the system;thus,further research will be conducted in this direction.
Declaration of competing interest
The authors declare that they have no known competing financial interests or personal relationships that could have appeared to influence the work reported in this paper.
Acknowledgments
This work was supported by the Key Projects of the 2022 National Defense Science and Technology Foundation Strengthening Plan 173 (Grant No.2022-173ZD-010) and the Equipment Pre-Research Foundation of The State Key Laboratory (Grant No.6142101200204).

- Defence Technology的其它文章
- The interaction between a shaped charge jet and a single moving plate
- Machine learning for predicting the outcome of terminal ballistics events
- Fabrication and characterization of multi-scale coated boron powders with improved combustion performance: A brief review
- Experimental research on the launching system of auxiliary charge with filter cartridge structure
- Dependence of impact regime boundaries on the initial temperatures of projectiles and targets
- Experimental and numerical study of hypervelocity impact damage on composite overwrapped pressure vessels