
Experimental and numerical study on protective effect of RC blast wall against air shock wave
2024-02-29 08:24XinzhNianQuanminXiXinliKongYingkangYaoKuiHuang
Defence Technology 2024年1期
Xin-zh Nian , Quan-min Xi , Xin-li Kong , Ying-kang Yao , Kui Huang
a State Key Laboratory of Precision Blasting, Jianghan University, Wuhan, 430056, China
b Hubei Key Laboratory of Blasting Engineering, Jianghan University, Wuhan, 430056, China
c Hubei (Wuhan) Institute of Explosion and Blasting Technology, Jianghan University, Wuhan, 430056, China
d College of Defense Engineering, Army Engineering University of PLA, Nanjing, 210007, China
e Institute of Defense Engineering, AMS, PLA, Luoyang, 471023, China
Keywords: Blast wall Shock wave Diffraction Overpressure Protection
ABSTRACT Prototype experiments were carried out on the explosion-proof performance of the RC blast wall.The mass of TNT detonated in the experiments is 5 kg and 20 kg respectively.The shock wave overpressure was tested in different regions.The above experiments were numerically simulated, and the simulated shock wave overpressure waveforms were compared with that tested and given by CONWEP program.The results show that the numerically simulated waveform is slightly different from the test waveform,but similar to CONWEP waveform.Through dimensional analysis and numerical simulation under different working conditions,the equation for the attenuation rate of the diffraction overpressure behind the blast wall was obtained.According to the corresponding standards, the degree of casualties and the damage degree of the brick concrete building at a certain distance behind the wall can be determined when parameters are set.The above results can provide a reference for the design and construction of the reinforced concrete blast wall.
1.Introduction
Blast wall is an important facility for preventing blast air shock wave.Reinforced concrete blast wall which is usually set around important targets has the advantages of high resistance and good protection effect[1].Complex reflection and diffraction occur when shock wave acts on reinforced concrete blast wall, which reduces the overpressure of shock wave at the protection target behind the blast wall.
The flow field formed by the explosion shock wave when meeting obstacles is complex.The analysis of the reflection overpressure and diffraction overpressure of the blast shock wave is an important part of the research on the accidental explosion effect that can be equivalent to TNT explosion[2].It can provide reference for the design of protective structures, the safety evaluation of military ammunition and civil blasting equipment depot [3-5].It can also provide reference for investigation of explosion accidents[2,3].
In view of the explosion shock wave load problem, related research results have been reported.
Sielicki [6] conducted experiments and numerical simulations on the failure modes of brick walls under explosive loads.The masonry walls exposed to the actual and a computational blast wave action are examined.Weli [7] et al.evaluated the safety of masonry wall subjected to explosive loads based on material modeling methods.Xu[8]et al.studied the protective effect of the gabion wall against the explosion shock wave.They test the explosion shock wave overpressure on the surface of the wall and at a certain distance behind the wall through experiments.The equation for predicting the overpressure behind the wall was also given.Zhou[9]et al.studied diffraction process of the air shock wave and blast load on the surface of the structure behind the obstacle by numerical simulation method.Based on the scaling test,Rose et al.[10,11] analyzed the distribution of the shock wave diffraction overpressure behind the rigid wall, and evaluated the weakening effect of the rigid blast wall on the shock wave overpressure.Through scale test and dimensional analysis, Chapman [12] established a prediction model for reflecting overpressure at a certain height on the surface of the structure behind the rigid wall.Jin[13],Hao[14],Zong[15]and Xiao[16]respectively carried out research on the dispersion and reduction mechanism of the blast shock wave by the steel column wall.The research shows the shock wave is laterally reflected and diffracted between two adjacent steel columns, and the reflected and diffracted waves cancel each other,which can weaken the shock wave.Esa [17] studied a blast load mitigation systems based on redirecting the waves propagation through hollow tubes.Hajek [18,19] proposed multiple arrangements and shapes of concrete barriers for faster energy dissipation and effective reduction of the damage and injuries caused by the explosion.
Many scholars have carried out research on the explosion-proof mechanism of protective structures made of composite or ordinary materials.Asprone [20] and Hua [21] studied the explosionresistant performance and mechanism of GFRP and carbon fiber composite panels, respectively.Hussein et al.[22,23] studied the blast resistance of wood-sand-wood walls and OBE walls, and analyzed the dynamic response of the walls under blast loading.In Hussein’s experimental research, reductions in blast pressure behind the OSB wall of over 20% were observed.Studies have shown that explosion-resistant structures made of traditional materials such as water body or steel plate-sand have good dispersion properties for blast shock waves[24,25].
In the research and the blast resistant construction design, it is necessary to determine the blast load on the structure surface and the shock wave overpressure around the structure through experiments [26].In this paper, the numerically simulated overpressure is compared with that tested and computed by CONWEP.The diffraction overpressure distribution behind the blast wall is also analyzed.The results can provide references for similar experiments and research.
2.Explosion-resistant experiment of the blast wall
The blast wall built for explosion-resistant experiment is a reinforced concrete structure.It is 6 m long,0.4 m thick and 2.5 m high.Figs.1 and 2 show the exterior of the blast wall and the reinforced cage built respectively.Fig.3 is the reinforcement diagram of the RC blast wall.
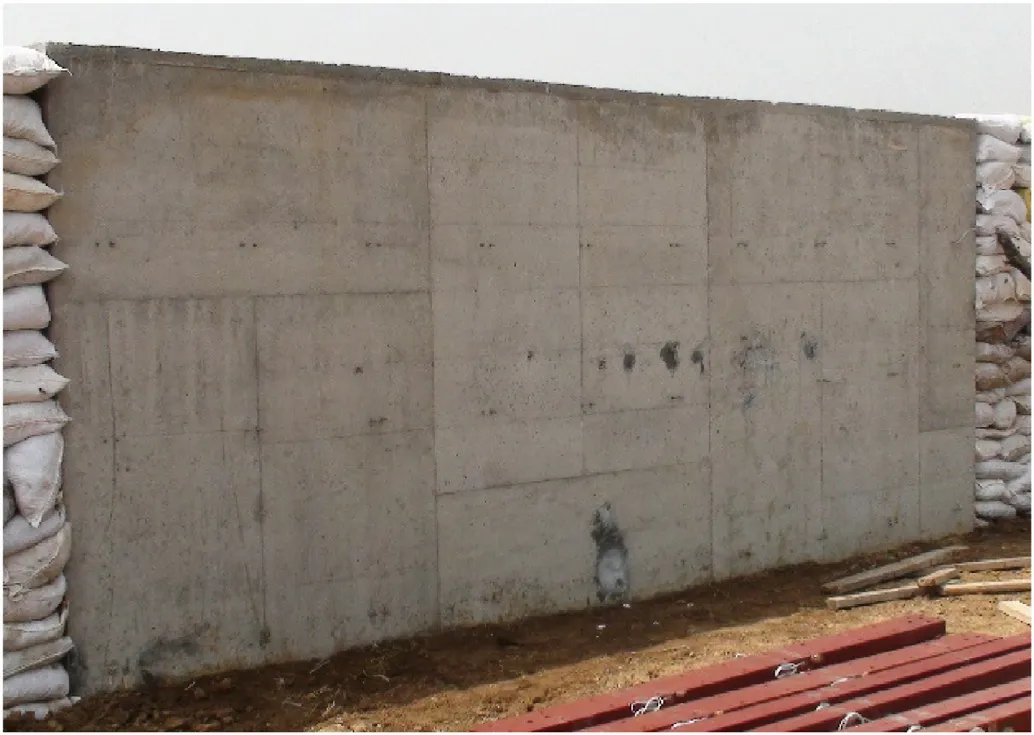
Fig.1.The reinforced concrete blast wall.
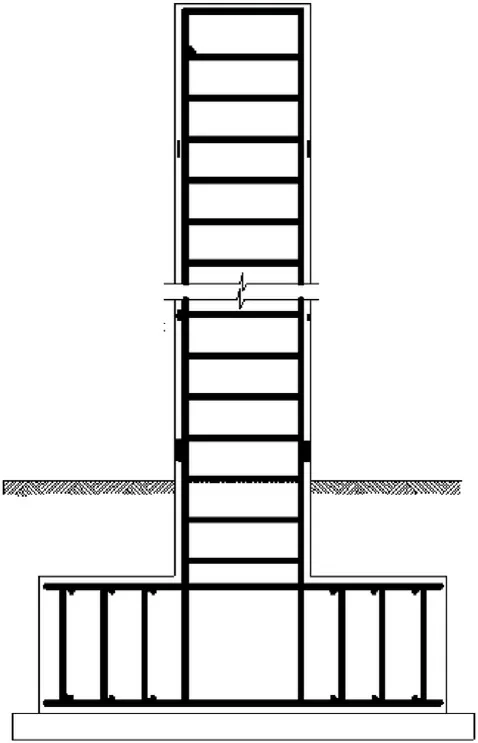
Fig.3.Reinforcement diagram (side view).
The test items include the shock wave reflection pressure on the surface of the blast wall,the shock wave pressure near the ground at a certain distance from the explosive and the shock wave diffraction overpressure near the ground in a certain range behind the wall.TNT explosive is placed on the ground and on the central axis of the wall at 3 m from the RC blast wall.Fig.4 shows the layout of the test site.The sensors for the test of the air shock wave overpressure near the ground were fixed on the ground, and the surface of the sensors was flush with the ground,as shown in Fig.5.Fig.6 shows the reflection pressure sensors located on the RC blast wall.Fig.7 is a shock wave reflection overpressure sensor installed on the RC blast wall.

Fig.4.Layout plan of shock wave incident pressure measuring points (mm).

Fig.5.Arrangement of the overpressure sensor in the free field.
3.Numerical simulation
3.1.Model introduction
In numerical simulation, AUTODYN was used to analyze the ground explosion shock wave propagation and the interaction process between the explosion shock wave and the RC blast wall.The multi-material Euler algorithm is used to analyze the explosion shock wave propagation in the free field.
Because 3D model will lead to a large number of air units,which multiply the solution time and may also lead to overflow of computer memory, it is effective to simplify the 3D model into a 2D axisymmetric model to simulate the flow field of the shock wave acting on the blast wall under appropriate conditions[8].In the 2D axisymmetric model,the plane projection of the wall is an annular shape.Compared with the cuboid wall in the test,the diffraction of the shock wave on both sides of the wall is ignored.It is necessary to analysis the differences between the 2D model and the 3D model.
Fig.8 shows the comparison of overpressure decay rates when 5 kg TNT exploded on the ground 3 m away from the wall.The length,thickness,and height of the blast wall in the simulation are 6.0 m, 0.4 m, and 2.5 m, respectively.In Fig.8, the overpressure decay rate of the 3D simulation gradually increases with the scaled distance behind the wall.The increase goes down when the scaled distance exceeds 2.57 m/kg1/3.The overpressure decay rate of the 2D simulation also increases gradually with the scaled distance behind the wall, and tends to go down when the scaled distance exceeds 4.33 m/kg1/3.When the scaled distance behind the wall is in the range of 0.82-4.04 m/kg1/3,the 3D simulation result is larger than the 2D simulation result.When the scaled distance exceeds 4.04 m/kg1/3, the 3D simulation result is smaller.
When 20 kg TNT exploded on the ground at a distance of 3 m from the wall, overpressure decay rates got by 3D model and 2D model are also different, as shown in Fig.9.Where the scaled distance is 0.52-1.70 m/kg1/3, the 3D simulation result is larger than the 2D simulation results.Where the scaled distance exceeds 1.70 m/kg1/3, the 3D simulation result becomes smaller.The overpressure decay rate of the 2D simulation increases gradually with the scaled distance behind the wall,and the increase shows no signs of going down.

Fig.6.Layout of reflection pressure measuring points on the blasting side of RC blast wall (mm).
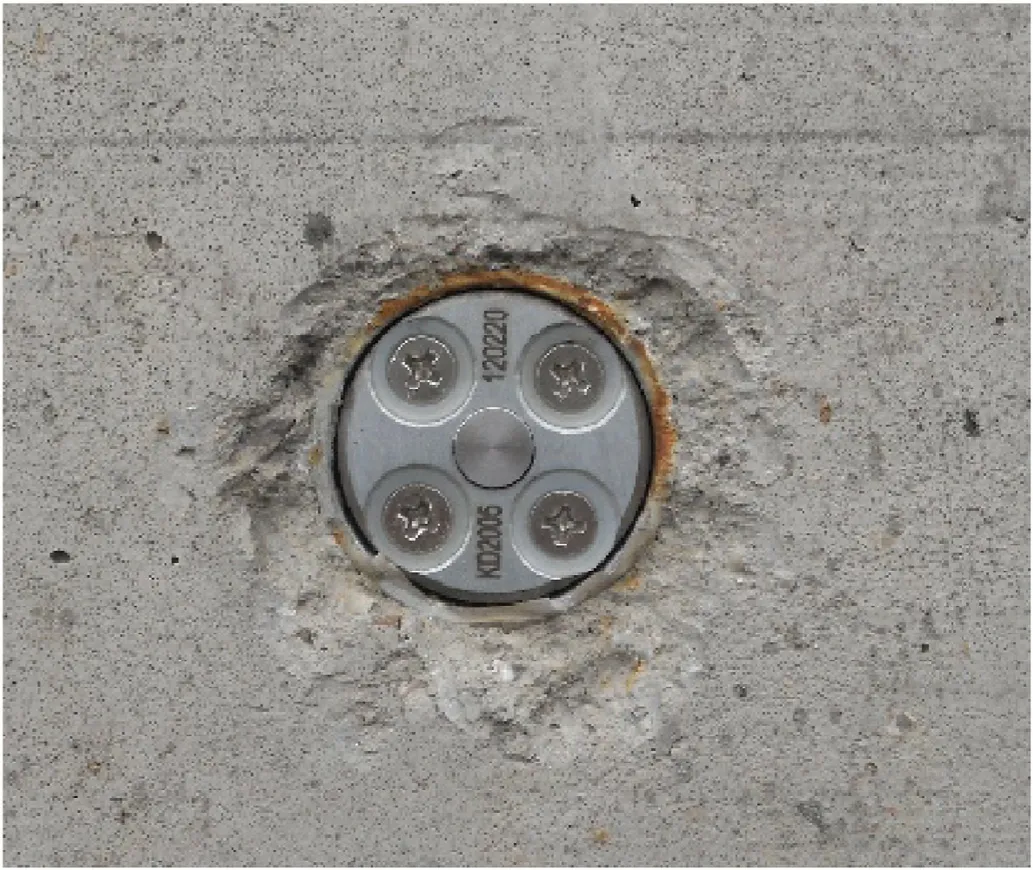
Fig.7.Reflection pressure sensor installed on Wall Two tests were conducted.The TNT mass was 5 kg in the first test and 20 kg in the second.
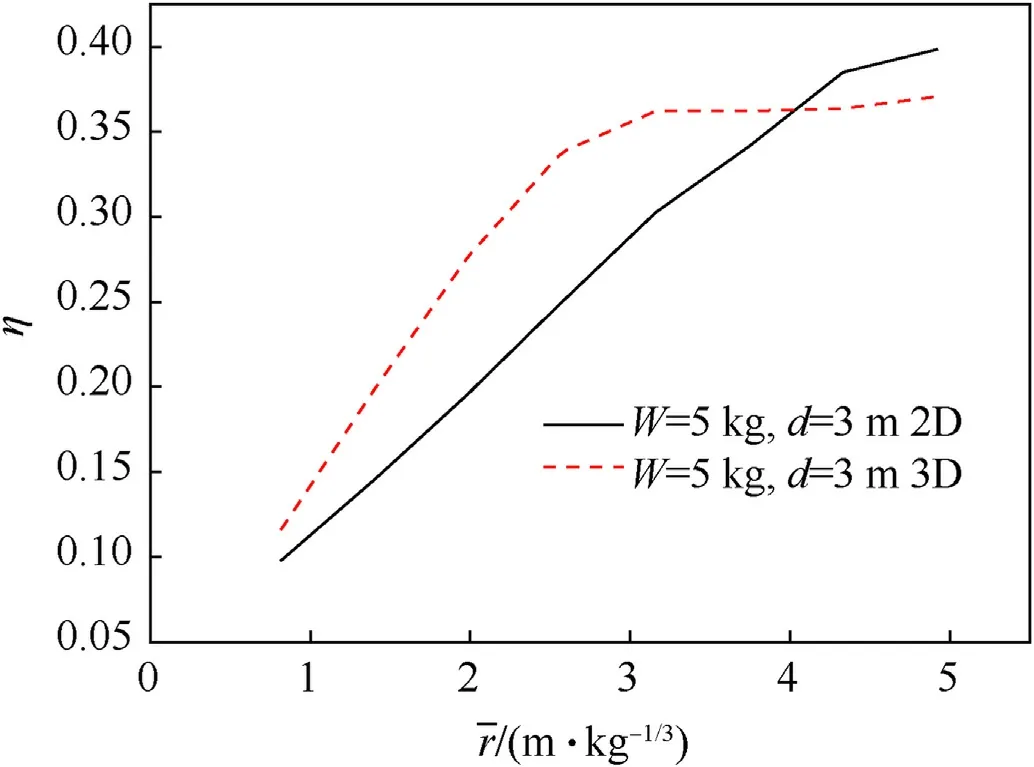
Fig.8.Comparison of overpressure decay rates (W = 5 kg, d = 3 m).

Fig.9.Comparison of overpressure decay rates (W = 20 kg, d = 3 m).
The above comparison reflects the differences in the reduction effect of the annular wall and the cuboid wall on the shock wave.The reason may be the difference in the propagation path of the shock wave caused by the setting form of the blast wall, which makes the explosion energy discharge and dissipation process different.The related mechanism needs to be further studied.Despite the differences between the 3D model and the 2D model,2D numerical simulation results can still be used as a reference.The advantages of the 2D model are as follows.Firstly,the 2D model can use small size grid to ensure calculation accuracy.Secondly, it has low demand for computing resources and high computing efficiency.Combined with the above reasons, the 2D axisymmetric model is adopted in this study.The 3D numerical simulation will be carried out in the further studies.
For simulating the propagation of the air shock wave, a 2D axisymmetric model is established.The model includes explosives,air domains and soil domains, as shown in Fig.10.Except the symmetry axis,outflow boundaries are set both for the air and the soil domains.The height of the shock wave overpressure measuring points near the ground is 0.2 m from the ground.
For analyzing the interaction process between the explosion shock wave and RC blast wall, the fluid structure interaction algorithm is used.A 2D axisymmetric model including explosive, air domain, soil domain and concrete blast wall is established, as shown in Fig.11.Outflow boundaries are also set both for the air and soil domains except the symmetry axis.
The shock wave peak overpressure and impulse are greatly affected by the mesh size.Referring to Xu's research[8], the mesh size in the simulation is set to 10 mm.
3.2.Material model
3.2.1.Air
Air is modeled by equation of state being ideal gas as follows:
wherepis the overpressure,γ is a constant,ρairis air density and e is the specific internal energy.ρair= 1.225 kg/m3and γ = 1.4.The initial internal energy of the air is 2.068 × 10⁵kJ/kg。
3.2.2.TNT
TNT high explosive is modeled by JWL equation of state which has the following form:
wherepis the overpressure,v is the specific volume,e is C-J energy/unit volume, A, r1, B, r2and ω are the material constants.The parameter values in the AUTODYN material library are as follows:A = 3.7377 × 10⁵MPa,B = 3.7471 × 10³MPa, r1=4.15, r2= 0.9,ω = 0.35,e = 6.0 × 10³MJ/m3.
3.2.3.Sand
The sand is represented using the compaction EOS and the MO Granular strength.
In the model,the reference density of sand is 2.641×10³kg/m3.The other parameters of sand can be found in the material library of AUTODYN [27].
3.2.4.Concrete
The concrete is represented using theP-α equation of state and the RHT model.The P-α equation of state was used to describe the relationship between pressure, density and internal energy of porous materials under strong dynamic loading conditions as
Fig.10.Air shock wave propagation model.

Fig.11.Interaction model between blast wall and shock wave.
where ρpis the density of the porous material,A1,A2,A3,B0,B1are undetermined coefficients, ρ0is the reference initial density of the solid material andedenotes the specific internal energy.is the relative volume change and is represented by the following form
where α is material porosity and is defined as
where vp,vsare the specific volume of the porous and solid material at the same pressure and temperature.
The RHT model takes into account the strain hardening and material softening responses of concrete, as well as the ratedependent hydrostatic tensile strength properties.
The main parameters of the equation of state of the concrete material are as follows:ρ0is 2.75×10³kg/m3,ρpis 2.314×10³kg/m3,A1is 3.53×10⁷,A2is 3.96×10⁷,A3is 9.04×10⁶,B0is 1.22 andB1is 1.22.The parameters of the equation of state and the RHT model are detailed in the AUTODYN material library [27].
3.2.5.Reinforcement
In 3D model, a reinforced concrete split model can be established,that is,the steel and concrete are modeled separately.In the 2D model,there are certain difficulties in the separate modeling of steel bars and concrete, mainly due to the equivalence of stiffness between the two-dimensional axisymmetric model and the 3D model,and the settings of the vertical steel bars and horizontal tie bars of the blast wall.In order to simplify the modeling, with reference to Ref.[28], the effect of reinforcement is simulated by appropriately amplifying the tensile strength of concrete in the simulation.The tensile strength is estimated to be 6.0 MPa.
4.Analysis and discussion
4.1.Comparison of shock wave incident overpressure waveforms
CONWEP program includes the normal phase parameter calculation model of explosion shock wave adopted by TM5-855-1[29], which has high authority and reliability [8,17].In this paper,the incident overpressure and reflected overpressure of shock wave given by CONWEP program are referenced and compared with the test results and simulation results.
Fig.12(a) shows the comparison of the incident overpressure near the ground when 5 kg TNT exploded.It can be seen from Fig.12(a) that at 3 m from the explosion center, the test original peak overpressure is 0.31 MPa, which is smaller than the value 0.37 MPa given by CONWEP program and the simulation value 0.39 MPa.
Fig.12.Comparison of incident overpressure at different distance: (a) W = 5 kg, d = 3 m; (b) W = 20 kg, d = 7 m.
Fig.13.Shock wave diffraction overpressure image.
Fig.12(b) shows the overpressure waveform near the ground 7 m away from the explosion center during 20 kg TNT explosion.It can be seen that the peak value of the test original overpressure is 0.17 MPa,which is very close to CONWEP value(0.16 MPa)and the simulation value (0.16 MPa).
The waveforms obtained by the numerical simulation are in good agreement with the waveforms given by CONWEP program.The arrival time of the simulated overpressure is slightly earlier than the arrival time of the overpressure given by CONWEP.
Fig.13 shows the image of the shock wave propagating after bypassing the blast wall.It can be clearly seen that the shock wave is reflected on the ground after bypassing the blast wall, the combination of diffracted wave and reflected wave will form mach wave at a certain distance behind the wall.
After the ground explosion of 20 kg TNT at 3 m away from the wall,the explosion face of the blast wall is complete and there is no obvious damage to the concrete,as shown Fig.14.
Fig.15(a) shows the attenuation trend of the incident overpressure peak value near the ground with the horizontal distance when 5 kg TNT exploded.The numerical simulation and CONWEP values are larger than the test values at 3 m away from the explosion center.At horizontal distances of 5 m, 7 m and 9 m, the numerical simulation and CONWEP values are relatively close to the test values.
Fig.15(b) shows the attenuation trend of the peak incident pressure with horizontal distance when 20 kg TNT exploded.At the horizontal distance of 3 m, the test value was 1.62 MPa, which is larger than CONWEP value (1.09 MPa) and the simulated value(1.4 MPa).At horizontal distances of 7 m,9 m,the simulated values,CONWEP values and the test values are close.
4.2.Comparison of the reflected overpressure
Fig.16(a)corresponds to the reflected overpressure waveform of shock wave on the wall when 5 kg TNT is located 3 m away from the wall during ground explosion.At the height of 0.22 m in the middle of the RC wall, the original peak value of the test reflection overpressure is 3.24 MPa.CONWEP value and the simulated value are 1.57 MPa and 1.66 MPa,respectively.The test value is significantly larger than CONWEP value and the simulated value.The numerical simulation waveform has a short rising edge and a fluctuating falling edge.On the other hand, the rising edge of CONWEP waveform is steep and the falling edge is smooth.
Fig.14.The RC blast wall after explosion.
Fig.16(b) shows the reflected overpressure waveform corresponding to 20 kg TNT explosion at 3 m away from the wall.There are differences between the simulated waveform, the test waveform and CONWEP waveform.The overpressure peak values got from the test,CONWEP and the numerical simulation are 7.72 MPa,6.19 MPa and 8.69 MPa, respectively.
The normal reflection coefficient obtained by numerical simulation is compared with that calculated by CONWEP.The selected measuring point is at a horizontal distance of 3 m from the explosion center and a height of 0.22 m on the RC blast wall.
The reflection coefficient is defined as
Fig.15.Comparison of incident overpressure attenuation: (a) 5 kg TNT; (b) 20 kg TNT.

Fig.16.Reflection overpressure comparison: (a) 5 kg; (b) 20 kg.
where λ is the reflection coefficient,Pfis the peak reflected overpressure, andPis the peak incident overpressure.
Table 1 shows the reflection coefficient.It can be seen that the reflection coefficient obtained by numerical simulation is relatively close to that calculated by CONWEP.
4.3.Diffraction overpressure behind walls
4.3.1.Diffractionoverpressurewaveform
During the test,the sensors at 2 m,4 m,and 6 m behind the wall obtained data.After judgment, the shock wave overpressure data measured at 4 m behind the wall is found to be invalid in 5 kg explosion experiment, and the shock wave overpressure data measured at 2 m and 6 m contain abnormal signals.For the 20 kg TNT explosion experiment, the shock wave overpressure data measured at 2 m and 6 m behind the wall are invalid,and the shock wave overpressure data measured at 4 m behind the wall containsabnormal signals.By analyzing the overpressure amplitude and positive pressure action time,the shock wave overpressure signals were intercepted from the data containing abnormal signals, so that the shock wave overpressure signal can be further analyzed.
Table 1Reflection coefficient comparison.
Fig.17 shows the filtered overpressure signal of the diffraction shock wave measured at 2 m behind the wall in the 5 kg TNT explosion experiment.The cutoff frequency of the low-pass filtering is 2000 Hz.After filtering, the rising edge of the tested overpressure waveform is no longer abrupt but a little slow.The simulated diffracted wave at the same position obviously has a slow rising edge,and its boost time is about 0.5 ms.This phenomenon may be related to the mesh size used for numerical simulations.
Fig.17.Overpressure at 2 m behind the wall (5 kg TNT).

Fig.18.Overpressure at 6 m behind the wall (5 kg TNT).

Fig.19.Overpressure at 4 m behind the wall (20 kg TNT).
Fig.18 shows the diffraction overpressure signal measured at 6 m on the ground behind the wall during the 5 kg TNT explosion experiment.Fig.19 shows the diffraction overpressure signal measured at 4 m on the ground behind the wall during the 20 kg TNT explosion experiment.
It can be seen from Figs.18 and 19 that there are still jitter in the shock wave overpressure signals after low-pass filtering,which will affect the interpretation of the peak values of the measured shock wave overpressure.The waveforms of the simulated diffraction overpressure and the test results have some differences but also have certain similarities.
4.3.2.Protectiveeffectoftheblastwallonshockwave
The peak overpressure of air shock wave corresponding to different distances of TNT ground explosion can be calculated by Eq.(7) [30].
Fig.20.Overpressure weakening for setting the RC blast wall.
wherePis the peak incident overpressure of ground explosion shock wave,105Pa;Wis TNT mass,kg;Ris the horizontal distance from explosion center, m.
In the experiment of the 5 kg TNT explosion, the measured overpressure near the ground at 2 m and 6 m behind the wall is 14.3 kPa and 11.3 kPa, respectively.The free field overpressure calculated by Eq.(7) at the corresponding distance is respectively 122.4 kPa and 42.7 kPa,it can be calculated that the corresponding overpressure attenuate rates at these two places are 0.12 and 0.26,respectively.
In the test of 20 kg TNT explosion, the measured overpressure near the ground at 4 m behind the wall is 54.5 kPa.The free field overpressure calculated is 122.4 kPa, corresponding an overpressure attenuate rate of 0.33.
Fig.20 shows the incident overpressure of the blast shock wave on the flat ground calculated by Eq.(7).It can be seen that the overpressure near the ground behind the wall is significantly reduced when the blast wall is installed, indicating that the installation of the RC blast wall can effectively weaken the shock wave.
4.3.3.Diffractionoverpressureattenuation
Define shock wave overpressure attenuation rate
where η is the attenuation rate of the shock wave overpressure,Pwis the shock wave overpressure near the ground behind the wall when the blast wall is set,and P is the peak incident overpressure of ground explosion shock wave.
As shown in Fig.21, the parameters related to the shock wave overpressure behind the blast wall mainly include the explosive massW,the horizontal distancedbetween the blasting face of the wall and the blasting center, the heighthof the wall, and the horizontal distancerbetween the measuring point behind the wall and the blasting face of the RC blast wall.

Fig.21.Relative position of the blast wall and TNT (side view).
Through dimensional analysis [12], the function form for calculating the overpressure attenuation rate of the shock wave behind the blast wall is determined
whereKare undetermined coefficient, α, β, γ are undetermined exponents respectively.
Based on the comparison with the test results, numericalsimulations under different working conditions are carried out to determine the overpressure attenuation rate distribution behind the wall.The numerical simulation conditions are listed in Table 2.
Table 2Numerical simulation conditions.
After analyzing and simulating different working conditions,the maximum overpressure attenuation rate with the height of 0.2,1,2 and 3 m at the same distance are selected.The overpressure attenuation rates behind the wall corresponding to different working conditions are shown in Figs.22-24.
Eqs.(10)-(12) obtained by fitting are applicable to the prediction of diffraction overpressure decay rate at different distances behind the blast walls when explosives explode on the ground at a certain distance from the blast walls.
For Eq.(10),R2statistic is 0.92.The application range of Eq.(10)is:d/W1/3ranges from 0.74 m/kg1/3to 0.93 m/kg1/3,h/dranges from 1.25 to 2.25,r/W1/3ranges from 0.74 to 8.36 m/kg1/3.
Fig.22.Overpressure attenuation rate versus scale distance behind wall: (a)W = 10 kg, d = 2 m; (b)W = 20 kg, d = 2 m.
Fig.23.Overpressure attenuation rate versus scale distance behind wall: (a)W = 20 kg, d = 4 m; (b)W = 60 kg, d = 4 m.
Fig.24.Overpressure attenuation rate versus scale distance behind wall:(a)W=20 kg,d = 6 m; (b)W = 100 kg, d = 6 m; (b)W = 200 kg, d = 6 m.
For Eq.(11),R2statistic is 0.85.The application range of Eq.(11)is:d/W1/3ranges from 1.02 to 1.47 m/kg1/3,h/dranges from 0.625 to 1.125,r/W1/3ranges from 0.51 to 6.64 m/kg1/3.
For Eq.(12),R2statistic is 0.90.The application range of Eq.(12)is:d/W1/3ranges from 1.03 to 2.21 m/kg1/3,h/dranges from 0.42 to 0.75,r/W1/3ranges from 0.34 to 5.90 m/kg1/3.
Figs.25-27 show the fitting effects.It can be seen that the values calculated by the equations are basically consistent with the simulated values.
By fitting all the simulated data, the following formula of the shock wave overpressure attenuation rate is obtained
R2statistics is 0.87.Eq.(13) is applicable to the calculation of shock wave diffraction overpressure attenuation rate within 20 m behind the wall when the wall height is less than 4.5 m.
When the parameters (W,d,handr) are determined, the diffraction overpressure of shock wave at a certain distance behind the wall can be calculated by using Eq.(13).Table 3 shows the comparison between the test results of the explosion resistance experiment of gabion wall carried out by Xu[8]and the calculation results of Eq.(13).
Table 4 shows the comparison between the prediction results of the formula and the test results in this paper.It can be seen that the diffracted overpressure behind the wall calculated by Eq.(13)are in good agreement with the test results in this paper.For 5 kg TNT explosion, the predicted overpressure at 2.4 m behind the wall deviates greatly from the test results, because the filtering has a certain effect on the tested peak overpressure at this place.
Based on the comparative analysis, Eq.(13) can predict the shock wave overpressure within 20 m behind the wall when the wall height is less than 4.5 m.
5.Case study
In practice, the shock wave overpressure behind the blast wall can be calculated by Eqs.(13)and(7),then the degree of casualties and the damage degree of the building can be determined according to the corresponding overpressure standard.
Tables 5 and 6 respectively list the overpressure standards corresponding to the degree of casualties[31]and the damage degree of brick concrete structures [32].The specific analysis conditions are listed in Table 7.
It can be seen from Table 7 that when 20 kg TNT is 2 m away from the blasting face of the wall and the wall height is 2.5 m,the peak overpressure at 20 m behind the wall is 21.8 kPa.While the wall height is 4.5 m, the peak overpressure at the same position becomes 13.6 kPa.Compared with the casualty standard, the personnel will suffer minor injuries in both cases.Compared with the damage standard of brick concrete structures, the structure at 20 m behind the wall will suffer mild damage in both cases.
Fig.25.Fitting effect: (a) d/W1/3 = 0.93 m/kg1/3; (b) d/W1/3 = 0.74 m/kg1/3.

Fig.26.Fitting effect: (a) d/W1/3 =1.47 m/kg1/3; (b) d/W1/3 =1.02 m/kg1/3.
When 100 kg TNT explodes at 4 m away from the wall, the overpressure at 18 m behind the wall corresponding to the wall height of 2.5 m and 4.5 m is 53.2 kPa and 33.0 kPa respectively,and there are serious injuries and moderate injuries to personnel at the corresponding positions respectively.According to the damage standard of brick concrete structures,the structure at 18 m behind the wall under these two conditions will suffer serious damage and moderate damage.
When 300 kg TNT explodes at 6 m away from the wall, the overpressure at 16 m behind the wall corresponding to the wall height of 2.5 m and 4.5 m is 106.3 kPa and 66.1 kPa respectively,and the personnel at the corresponding position are seriously injured.Compared with the damage standard of brick concrete structures,the structure at 16 m behind the wall will collapse and suffer serious damage respectively.
6.Conclusions
In this paper,the explosion-proof prototype experiments of the RC blast wall were carried out.The shock wave overpressure data in different areas were tested, and the explosion process was simulated by AUTODYN.The numerical simulation results were compared with the test results and the results given by CONWEP.
(1) The simulated free-field overpressure waveform has a certain similarity compared to the waveform which is tested and given by CONWEP.
(2) There is a certain difference between the simulated reflected overpressure waveform and the tested waveform.The shock wave overpressure reflection coefficients obtained by numerical simulation is consistent with CONWEP computations.When 5 kg TNT exploded at a distance of 3 m from the wall, the shock wave overpressure reflection coefficients computed from simulation and CONWEP are 4.3 and 4.0,respectively.When 20 kg TNT exploded at 3 m from the wall,the reflection coefficients computed from simulation and CONWEP were 6.2 and 5.7, respectively.
(3) In 5 kg TNT explosion experiment, the measured overpressure near the ground at 2 m and 6 m behind the wall is 14.3 kPa and 11.3 kPa, respectively.The free field overpressure at the corresponding distance is respectively 122.4 kPa and 42.7 kPa, so the corresponding overpressure attenuate rates at these two places are 0.12 and 0.26,respectively.In the experiment of 20 kg TNT explosion, the measured overpressure near the ground at 4 m behind the wall is 54.5 kPa.The overpressure in the free field at the corresponding distance is 122.4 kPa, and the corresponding overpressure attenuate rate at this location is 0.33.
(4) The simulation results of different working conditions show that within 20 m behind the wall, the overpressure attenuation rates of the diffraction shock wave generally increase with the increase of the scaled distance.
(5) Through dimensional analysis and regression, the equation for the diffraction overpressure attenuation rate is established, which can be used to analyze the shock wave diffraction overpressure in a certain range behind the wall.
Fig.27.Fitting effect: (a) d/W1/3 = 2.21 m/kg1/3; (b) d/W1/3 = 1.29 m/kg1/3;(c) d/W1/3 =1.03 m/kg1/3.
Table 3Comparison of the calculated overpressure with the test results.
Table 4Comparison with the test results in this paper.

Table 5Overpressure corresponding to the degree of casualties.

Table 6Overpressure corresponding to the damage degree of brick concrete structures.
Table 7Degree of casualties and damage degree of building behind the blast wall。.
Declaration of competing interest
The authors declare that they have no known competing financial interests or personal relationships that could have appeared to influence the work reported in this paper.
Acknowledgements
This work has been funded by Key R & D Projects in Hubei Province(Grant No.2020BCA084) and Innovative Group Project of Hubei Natural Science Foundation (Grant No.2020CFA043).

- Defence Technology的其它文章
- The interaction between a shaped charge jet and a single moving plate
- Machine learning for predicting the outcome of terminal ballistics events
- Fabrication and characterization of multi-scale coated boron powders with improved combustion performance: A brief review
- Experimental research on the launching system of auxiliary charge with filter cartridge structure
- Dependence of impact regime boundaries on the initial temperatures of projectiles and targets
- Experimental and numerical study of hypervelocity impact damage on composite overwrapped pressure vessels