
Micro defects formation and dynamic response analysis of steel plate of quasi-cracking area subjected to explosive load
2024-02-29 08:24ZhngqingZhouchnDuXiaoWangHuilingJiangQiangZhouYulongZhangYuzhLiuPiZhang
Defence Technology 2024年1期
Zhng-qing Zhou , Z-chn Du , Xiao Wang , Hui-ling Jiang , Qiang Zhou ,Yu-long Zhang , Yu-zh Liu , Pi-z Zhang
a Research Institute of Macro-Safety Science, University of Science and Technology, Beijing,100083, China
b School of Civil and Resource Engineering, University of Science and Technology Beijing, Beijing,100083, China
c School of Mechanical Engineering, Nantong University, Nantong, 226019, China
d China North Industry Advanced Technology Generalization Institute, Beijing,100089, China
e China Academy of Ordnance Science, China
Keywords: Explosive load Quasi-cracking area Micro defects Steel plate Dynamic response Numerical simulation
ABSTRACT As the protective component, steel plate had attracted extensive attention because of frequently threats of explosive loads.In this paper, the evolution of microstructure and the mechanism of damage in the quasi-cracking area of steel plate subjected to explosive load were discussed and the relationships between micro defects and dynamic mechanical response were revealed.After the explosion experiment,five observation points were selected equidistant from the quasi-cracking area of the section of the steel plate along the thickness direction, and the characteristics of micro defects at the observation points were analyzed by optical microscope (OM), scanning electron microscope (SEM) and electron backscattered diffraction (EBSD).The observation result shows that many slip bands (SBs) appeared, and the grain orientation changed obviously in the steel plate,the two were the main damage types of micro defects.In addition, cracks, peeling pits, grooves and other lager micro defects were appeared in the lower area of the plate.The stress parameters of the observation points were obtained through an effective numerical model.The mechanism of damage generation and crack propagation in the quasicracking area were clarified by comparing the specific impulse of each observation point with the corresponding micro defects.The result shows that the generation and expansion of micro defects are related to the stress area(i.e.the upper compression area, the neutral plane area, and the lower tension area).The micro defects gather and expand at the grain boundary,and will become macroscopic damage under the continuous action of tensile stress.Besides,the micro defects at the midpoint of the section of the steel plate in the direction away from the explosion center (i.e.the horizontal direction) were also studied.It was found that the specific impulse at these positions were much smaller than that in the thickness direction, the micro defects were only SBs and a few micro cracks, and the those decreased with the increase of the distance from the explosion center.
1.Introduction
As the basic protective structural component, steel plate is widely employed on construction,bridges,armored vehicles,ships,and other large-scale structural engineering [1-3].However, the localized explosion load caused by near-field explosive could cause deformation,destruction,or structural performance degradation of steel plate,resulting in the threats to the human life and property.Therefore, as one of the basic problems of structural explosion damage,the response of metal plate under air-explosion loads has been widely concerned by academia and industry in recent years[4-7].
Over the past several decades, most experts and scholars have studied the explosion damage of metal plate by theoretical analysis,experiment, and numerical simulation [8-14].From macroscopic level,Shishegaran et al.evaluated the resistance of steel plate shear walls(SPSW)[15]and reinforced concrete panels(RCPs)[16]under explosive loads using nonlinear finite element analysis and surrogate methods.The effect of several design parameters on the maximum deflection and damage of the two under explosive loads has been evaluated.The results showed that the cross-section in the y-direction and the plate thickness have the most significant effects on the maximum deflection of SPSWs and the explosive weight and distance from the explosive have the most impact on the RCP failure, respectively.Nawar et al.[17] used LS-DYNA software to study the dynamic response of PSCs (perforated steel columns) under different levels of blast threats.Extensive explicit finite element (FE) analyses were carried out to investigate the effect of various parameters.The results of the comparative study showed that the damage and toughness decreased when the support condition changed from pinned to fixed ends through the two stages of loadings.Micallef et al.[18] presented an analytical formulation for the permanent plastic deformation of a circular plate subjected to an explosion load.A series of numerical simulations were obtained by using ABAQUS and excellent correlation with the derived analytical results (within 15% accuracy) are obtained.Gan et al.[19] used field experiments and numerical methods to study the damage mode and mechanism of U-ribbed stiffened plates under close blast load.The damage modes of the single U-shaped stiffener are well identified by the combination of damage number, maximum incident angle,and relative stiffness.
From microscopic level,Geffroy et al.[20]observed the fracture morphology of a high purity ferritic-pearlitic DH36 steel plate under the spherical explosion load, the results showed that the fracture is characterized by shear ductile fracture.Ning et al.[21]observed the fracture modes of Ti6321 titanium alloy plate with different microstructures.Under the 300 g explosive, the fracture modes included shear fracture,tensile fracture,and mixed ductile/brittle fracture.Rajendran and Narasimhan [22] observed the characteristics at the fracture location of HSLA steel plates.The Scanning Electron Microscopic (SEM) examination of dimples at the fractured surfaces suggested that crack propagation was caused by the coalescence of micro voids.Liu et al.[23] studied the dynamic deformation of finite steel plate under high velocity impact of copper explosively formed projectile by using a variety of microscopes.Morphology analysis of fracture surfaces demonstrated that the mild carbon steel target exhibits excellent brittle features that material fails mainly along the cleavage facets on the rear surface of target under strong impact of explosively formed projectile.Until now, some efforts have been paid at the analysis of deformation and fracture modes of metal plates from macroscopic and microscopic levels [24,25].
In conclusion, in order to explore the damage and cracking mechanism of steel plates with large deformation and cracking subjected to explosion load, a lot of studies have been carried out from the perspective of overall macroscopic damage and microscopic morphology of crack.However,the observed locations are all at the macroscopic cracking sites, which cannot reflect the accumulation degree of defects and the development process of cracks before the formation of macroscopic cracking.Meanwhile, the damage mechanism of microstructure,such as dislocation slip and grain deformation, and their relationships with macroscopic mechanical response are seldom studied.
In this study, a protective material with a wide range of applications,i.e.the Q345 steel,was selected as the research object,and the microstructure damage types of quasi-cracking area were observed by optical microscopy (OM) and scanning electron microscopy (SEM).Electron backscattering diffraction (EBSD) technique was used to observe dislocation slip and grain changes, and the mechanism of microstructure deformation was revealed.The mechanical parameters of the material were obtained by numerical simulation,and the relationships between the dynamic mechanical response and microstructure damage of the steel plate in different directions were discussed.The results reveal the damage evolution and mechanism of microstructure in the quasi-cracking area before the formation of macro cracks, and provide theoretical basis, data support, and method guidance for predicting and preventing damage propagation and improving the protection ability of materials.
2.Experiments and numerical simulation
2.1.Specimen preparations and explosion experiments
This explosion experiment was carried out in a closed chamber with a volume of about 300 m3(see Fig.1(a)).The normal Q345 steel was selected as the target plate,and its chemical composition is shown in Table 1.The schematic diagram of the experiment is illustrated in Fig.1(b),the length,width,and thickness of the target plate were 200, 200, and 20 mm, respectively; The diameter and height of cylindrical RDX(RDX 95wt%,wax 5wt%)were 54 mm and 52 mm,respectively.The RDX was placed 20 mm above the center of the steel plate, and was detonated by using the detonator with JH-14 booster.
From Fig.1(c),a circular crater with radiated trace can be found on the surface of the steel plate after the explosion.To determine the degree of deformation,the target plate was cut along the yellow dashed line by using the wire electrical discharge machining,and a quarter plate was selected for subsequent experiments.The deflection of the target plate measured by vernier caliper(accuracy of 0.02 mm), the distance-deflection curve was given here.
2.2.Microstructure’s observation
The target plate after the explosion is shown in Fig.2(a), the plate was cut into small pieces for further study the difference of damage at different locations.According to the damage condition,the plate was cut into 7 samples of size 12 × 12 × 20 mm3(i.e.length × width × thickness) along the yellow line by wireelectrode cutting method.The perpendicular section damage of 0# and 1# samples were preliminarily observed with the zoomstereo microscope (SZM7045).
After that,the microscopic morphology of sample 0#along the thickness direction and the center of sample 0-6# section was studied by the following methods.Each sample was grinded from 400#to 2000#sandpaper,polished with a size from W0.5 to W3.5 polishing paste in turn,and etched with 4%nitrate alcohol solution.After grinding, polishing, and etching, each Q345 sample was observed by using optical micrography (OM, MTF2000) at 200 magnifications;The deeper observations were conducted by using scanning electron microscope (SEM, JSM-7001F) which equipped with a high-performance electron back-scattered diffraction(EBSD)detector (Pegasus XM2).The EBSD scanning area was 860 × 860 μm2, and the step size was 2 μm.
2.3.Model building and numerical simulation
The nonlinear dynamic analysis program LS-DYNA was used to establish a finite element model (FEM).The arbitrary Lagrange-Euler (ALE) algorithm was used to analyze the dynamics of fluidstructure coupling.
The air was modeled with a linear polynomial Equation of State(EOS) for linear internal energy, which is given by
Fig.1.Schematic diagram of this explosion experiment:(a)The closed chamber;(b)The schematic diagram of target plate and explosives;(c)Deformation of the target plate and its deflection curve.

Table 1The chemical composition of this Q345 steel (wt%).
where
C0-C6are the constants related to the material properties,C1=C2=C3=C6= 0.
ρ0Is the initial density,Eis energy density, namely energy per unit volume.
The parameters[26] are shown in Table 2.
The Jones-Wilkins-Lee (JWL) EOS [27] was implemented to describe the RDX, which is defined as follow:
where.
Pis the product pressure;
eis the energy per unit volume;
υ is the relative volume of the gas products to the initial explosive state;
A,B,R1,R2,ω are constants.
Fig.2.Schematic diagram of Q345 steel plate cutting and sample preparation:(a)The cut Q345 steel plate was divided into seven identical samples (named 0# to 6#); (b)Section diagram of 0# sample; (c) Section diagram of 1# sample.
Table 2The Linear polynomial EOS coefficients of air.
Cylinder tests were performed to obtain the JWL-EOS parameters (see Fig.3 (a)).According to the results of the wall radial velocity in cylinder tests, the parameters were determined by iterating these variables in LS-DYNA hydrocode simulations until the experimental values were reproduced (see Fig.3 (b)).The obtained JWL-EOS parameters [28] are shown in Table 3.
The Johnson-Cook(JC)strength model was used to describe the dynamic behavior of metal materials.The JC constitutive equation[29] is given as follows:
where.
Yis the dynamic yield stress of the material;ε is the equivalent plastic strain; έ is the equivalent plastic strain rate; έxis the reference strain rate;A1,B1,C,nandmare material parameters;Tmis the reference temperature;T0is the melting temperature.
The Q345 steel has strict production standards in China,i.e GB/T 1591-2008[30].The parameters of Q345 steel[31]were obtained by universal material testing machine, Hopkinson press bar experiment (SHPB) and Gleeble thermal simulation testing machine[31].The values of material parameters of Q345 steel plate are shown in Table 4.
3.Results
From Fig.2(b), the damage distribution of 0# sample was uneven along the thickness direction: Multiple crack modes with different damage degrees can be observed in the cross section of the 0# sample.Compared with the upper part near the explosive load, the lower part was seriously damaged: The Y-shaped chasm almost throughout the sample, the canyon-like large fissures, and the fine cracks.Furthermore, as the distance from the explosion center increased,the damage gradually decreased(i.e.along the red arrow in Fig.2(b) and (c)).In order to explore the microscopic quasi-cracking mechanism of the target plate, the parts of the sample close to the cracked area were selected for microstructure observation, and the results were as follows:
Table 3The JWL-EOS parameters of RDX.
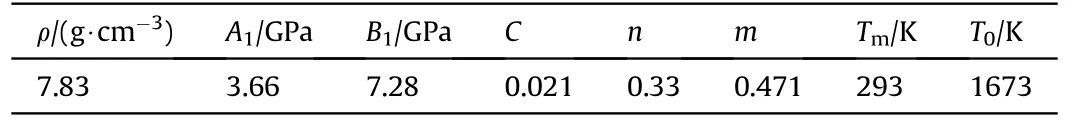
Table 4Johnson-Cook parameters of Q345 steel.
3.1.Microstructures observation by optical microscope (OM)
Fig.4(a) shows the original morphology of grains of Q345 steel plate.It can be observed that the main microstructure of Q345 steel was ferrite.The characteristics of grain boundary were obvious,with a small number of pearlites around.The proportion of the grain size at the range of 80-85 μm was the highest,i.e.12.5%(see Fig.4(b)), and the average grain diameter of original sample was 89.98 μm.After explosion impact, to study the changes of microstructure along the thickness direction of Q345 steel, the different locations were selected for observation.
The midpoint near the edge of the upper part of the 0#sample was taken as the first observation point (namedPa), and the rest four observation points were vertically selected (namedPb,Pc,Pd,Pe,respectively),with the distance between each point being about 4 mm (see Fig.5(f)).At the magnification of 200 × , the characteristics of explosive damage of Q345 steel at the microscopic level could be divided into the following types (see Fig.5(a)-(e)):
(1) Type I:Crack and hole.The explosive impact caused the steel plate to crack and form large cavities(i.e.holes).The range of defect areas of crack and hole were 6152.95-12633.69 μm2and 1050.33-1557.45 μm2respectively.They scattered mainly in the lower section of the sample;
(2) Type II: Black/dark grey area.The small dark irregular areas were isolated on the sample section surface,which could be pearlites or small cavities or both,and the damage area was about 124.15-544.54 μm2.It was difficult to distinguish under OM;
(3) Type III: Deformed grain.The explosive impact caused the grain to be pressed and deformed.The change of grain can be quantitatively obtained by analyzing it with EBSD (the corresponding content will be elaborated later);
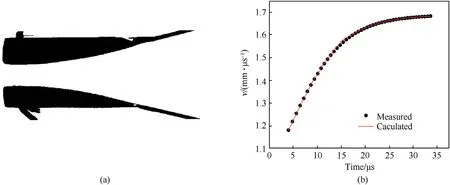
Fig.3.Acquisition of experimental parameters: (a) Expansion diagram of copper tube in cylinder test; (b) The comparison between simulation results and test results.
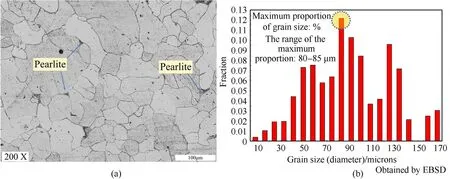
Fig.4.Original microstructure of Q345 steel: (a) OM figure of original sample; (b) Grain size of original sample.
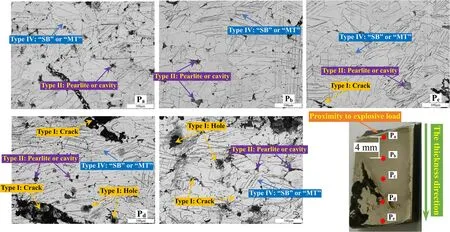
Fig.5.Selection and OM figures of the observation points of 0# sample: (a)-(e) OM figures of Pa-Pe; (f) Five observation points were chosen on the section of 0# sample.
(4) Type Ⅳ: “Parallel line”.Many parallel lines in different directions were observed on the perpendicular sections.Those are generally interpreted as the traces of either slip bands(SBs),mechanical twins(MTs),or a combination of both[32].On this sample,these parallel lines may be dominated by SBs accompanied by a small number of MTs.
As can be seen from Fig.5(a)-(c), many cavities and “parallel lines” can be seen at the first observation point, the surface morphology of Pband Pcwere relatively smooth, mainly “parallel lines”.However, compared with the former, the damage of Pdand Pewere serious,with large cracks and holes(see Fig.5(d)and(e));Besides, it seems that the number of “parallel lines” gradually increased and the spacing decreased.The results showed that the damage of the lower part of the steel plate is more serious under the explosive load.
3.2.Microstructures observation by scanning electron microscope(SEM)
At the same lower magnification, the “parallel lines” cannot be clearly observed,the observation effect of SEM was not as effective as OM here[33](see Fig.6(a)and(b)).The dark irregular areas(i.e.explosive damage Type II)in the OM cannot be judged as pearlite or cavity defect, it was difficult to determine its specific defect type;While, it can be identifided by SEM at higher magnifications (see Fig.6(c)).Therefore, it is necessary to use scanning electron microscopy (SEM)for further observation (see Fig.7).
Fig.7(f) shows the microscopic morphology of original Q345 steel by SEM with magnification of 1000 (i.e.1000 × ).It can be observed that, apart from a few small cavities which be caused by the production process of steel plate,the surface morphology of the original sample was smooth and there was almost no damage within grains.Grain boundaries,layered pearlite(ferrite/cementite)can be clearly identified.After the explosion, the section morphology of the sample had obviously changed.
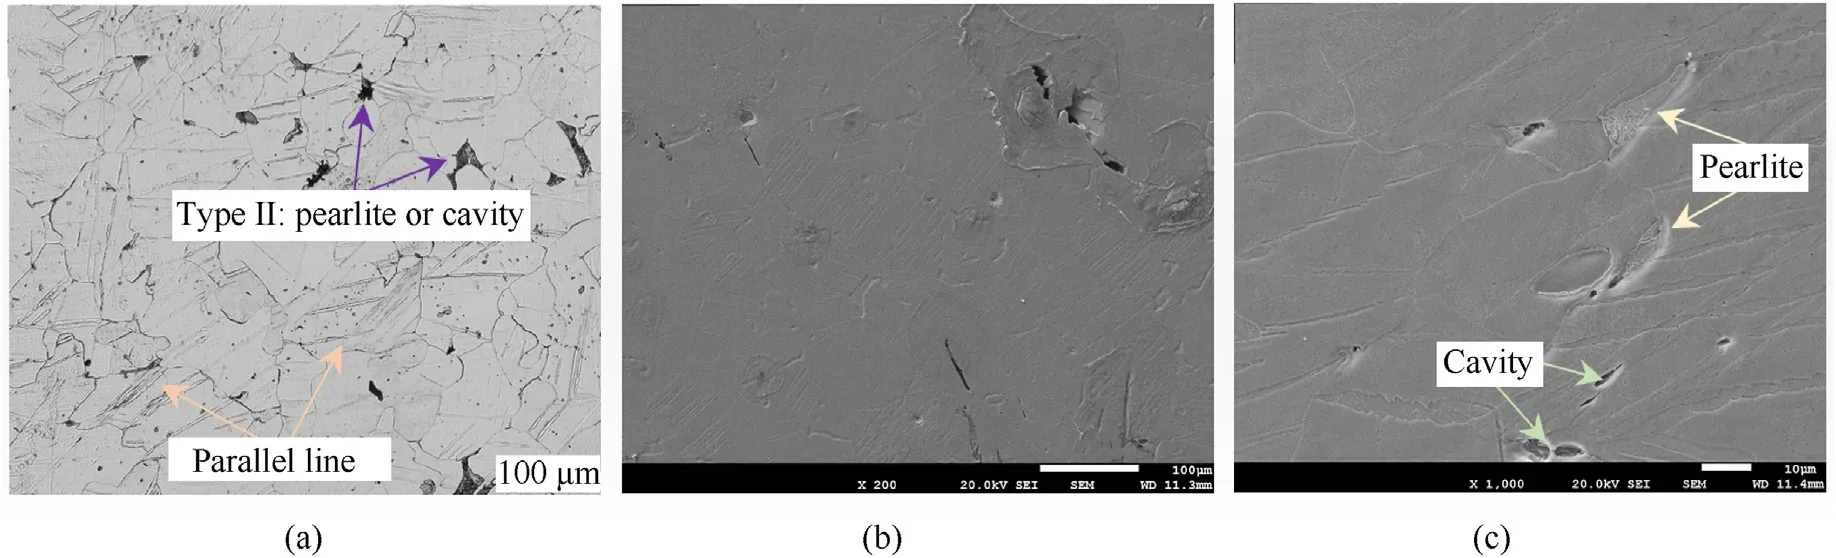
Fig.6.Microscopic figures of the 0#sample:(a)The OM figure of the sample under 200×;(b)The SEM figure of the sample under 200×;(c)The SEM figure of the sample under 1000×.
From Fig.7(a)-(c), there were many strip structures with multiple parallel lines(i.e.Type Ⅳ),and cavities and voids(i.e.Type II)can be found at Pa, which were consistent with OM observation results.The orientations of strip structures on both sides of grain boundary could be related to the orientation of grains on both sides:when the orientation difference of adjacent grains was small,the strip structures are connected at the grain boundary with the same direction [34] (see Fig.7(a)); When the orientation of adjacent grains difference was large, the strip structure presented a certain angle[35]at the grain boundary(see Fig.7(c)).In addition,four intersecting strip structures in different directions was found in Fig.7(b),it could indicate that four slip systems were initiated in the grain [36].
Shao et al.[37]reported that the increase of dislocation density hardened the slip band so that more slip systems could be activated at the next weakest plane,which may lead to microscopic damage.Damage characteristics can be observed from Fig.7(d)that the large elliptic cavity had a long axis length of about 86.38 μm and a short axis length of about 39.88 μm,and there were also small voids and micro cracks in the interior.In addition, the section morphology was observed to become rougher along the direction of thickness,with deeper grooves and many irregularly shaped peeling pits and micro voids.In Fig.7(e), micro cracks cracked at intersections of grain boundaries and then extended along grain boundaries.Because under the high temperature generated by the explosion,the grain boundary region was weak and the crack always spread along the direction of low resistance, so intergranular cracks may occur [21,38,39].Therefore, the more serious damage of the lower section of the steel plate could be caused by the increase of slip system.
3.3.Microstructures observation by electron backscattered diffraction (EBSD)
The target plate had obvious damage and deformation under the action of explosion impact, which inevitably led to changes in the original material structure.Five observation points of 0# sample section were characterized by EBSD.
Fig.8 shows the EBSD grain orientation diagrams of the original sample and different observation points.The color of different grains in the original sample was obviously different, which indicated that the orientations of grains were different.However,within the same grain,the color is uniform(see Fig.8(f)).But after explosion,it can be observed from Fig.8(a)-(e)that the color inside the grain changed obviously,which proved that the large grains are broken and refined to form small grains with different orientations.In addition,many black irregular areas can be seen in Fig.8(d)and(e), these could be holes, voids, cracks, and other volumetric defects.Meanwhile, with the increase of deformation, many dislocations were generated, and the storage energy increased, so the EBSD calibration rate of the samples decreased.Therefore,the areas with micro defects on the sample section cannot be indexed effectively by the EBSD system and appear black in the results.
Some studies [26-32] have shown that the strip structures in section 3.1 (i.e.damage Type Ⅳ) were SBs or MTs.The strip structures could be observed by OM and SEM, but the specific composition cannot be determined.Therefore, the constitutions of strip structure were further explored by the contrast figure.obtained by EBSD technique (see Fig.9).In original sample, the surface morphology was regular without damage (see Fig.9(f)).However,strip structures were observed in samples of metal plates after the explosion.The SBs and MTs can be clearly distinguished here.Apart from a small number of MTs (i.e.red line-{111}, green line-{110}),the strip structures on the surface of the observation points were mainly composed by SBs (the dark grey lines).
As grain boundary is the interface between adjacent grains,generally, according to the size of the phase difference between adjacent grains,the grain boundary with orientation difference less than 10°is called low angle grain boundary (LAGB), and the misorientation angle more than 10°is called high angle grain boundary (HAGB) [40].The fraction of misorientation angle at the original sample and each observation point are shown in Fig.10.
The distribution of misorientation angle of original Q345 steel sample is random.The HAGB accounted for about 90%of the total,and the misorientation angle around 50°accounted for the highest proportion, about 11.5% (see Fig.10(f)).However, after being subjected to explosive load, the misorientation angle changed obviously along the thickness direction.The distribution of misorientation angle at each observation point shows similar selective distribution characteristics [41], that was, the first three observation points in the range of 2-5°and 62-65°, the last two observation points in the range of 2-5°and 43-46°show“bimodal” distribution characteristics, respectively (see Fig.10(a)-(e)).
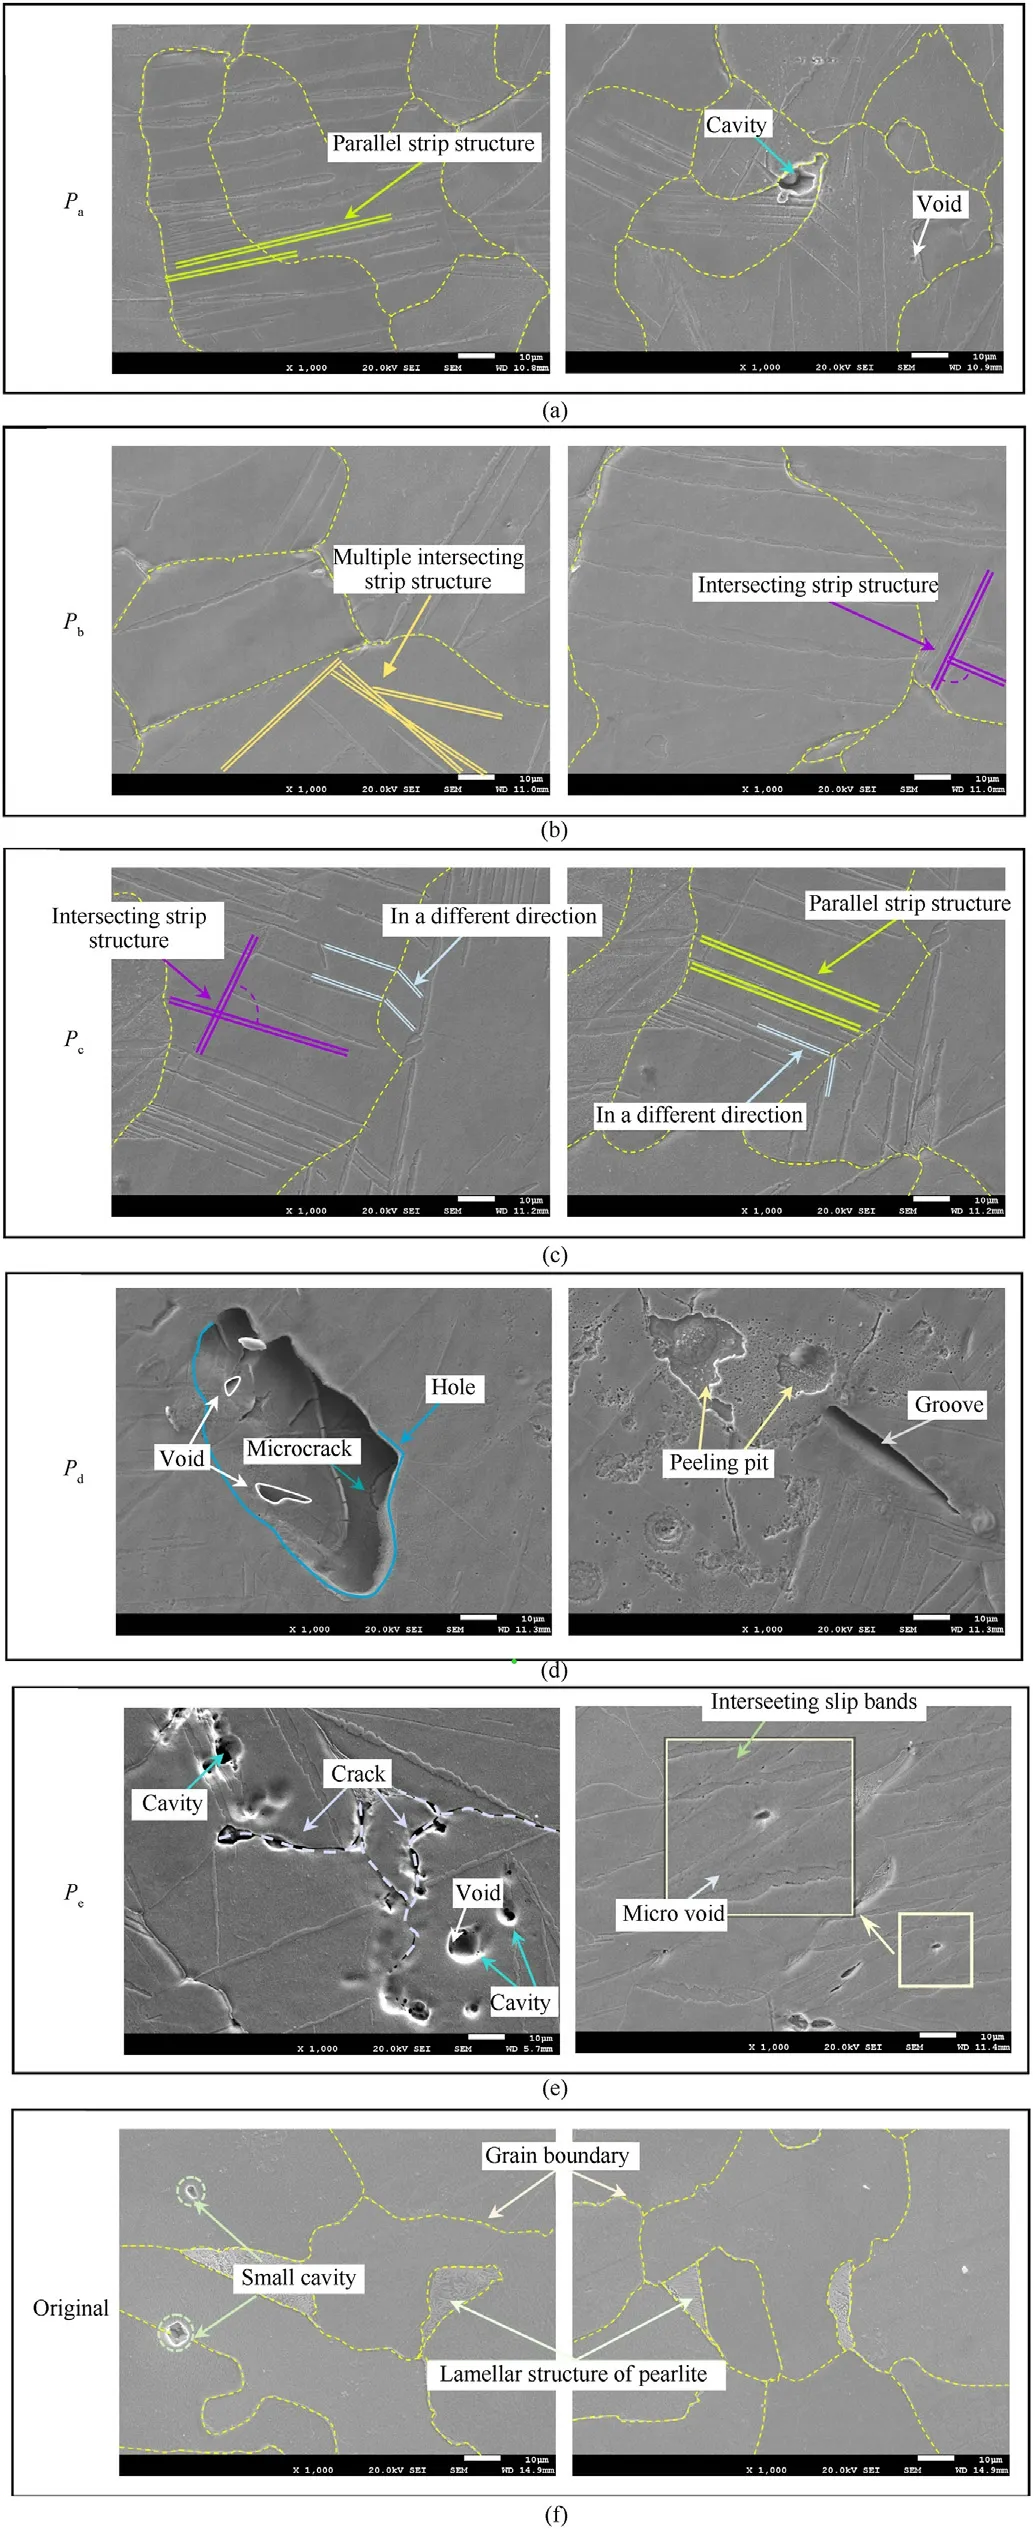
Fig.7.SEM figures of the original steel plate and 0# sample: (a)-(e) SEM figures of Pa-Pe under 1000×; (f) SEM figures of original target plate under 1000×.
In Fig.10(b)and(c),the number of LAGB increased significantly(account for about 54.3% and 55.1%, respectively), combined with Fig.9(b) and (c), no obvious twins were found in the samples, so slip atPbandPcwas the main deformation mode.Dislocation slips leaded to the change of misorientation angle within grains,but the those of grains changed only by slip were very small.Therefore,the proportion of LAGB was higher at these two positions.What’s more, HAGB at Pa, Pdand Peaccounted for large proportion (see Fig.10(a), (d), and 10(e)), which indicated that the misorientation angle between grains at these positions was larger, and the deformation was more serious.
3.4.Microstructures observation of the center of 0-6# samples section
The explosive damage of Q345 steel plate along thickness direction was studied in the preceding chapters.Meanwhile, the damage of target plate also seems to decrease with away from the explosion center (see Fig.2).Here, the perpendicular section of 0#-6# samples were selected as the observation areas.To study the microstructure of sample from explosion center, one observation point was uniformly selected at the midpoint of each perpendicular section (named Qa-Qg, respectively).Sections of samples were polished and polished(see Fig.11),and the following studies were carried out by OM, SEM and EBSD.
In Section 3.1, the damage types of steel plate along the thickness direction were divided into four types (i.e.Type I-Ⅳ).The figures of partial obse rvation points(Qa,Qb,Qc,and Qe)away from the explosion center direction are shown in Fig.12.Compared Fig.12 with Figs.4 and 7,it can be found that the partial damage had the same types in these two directions (i.e.Type II-Ⅳ).But the difference is that the former did not have volumetric defect at these points, (i.e.Type I, large cracks and holes).Meanwhile, as the distance from the center of the explosion increased, the damage showed a tendency to reduce which could be reflected in the following two phenomena:
First,the number of parallel lines in the strip structure(i.e.TypeⅣ) decreased with the distance away from the explosion center(see OM in Fig.12).The parallel lines intersected,and the number of it was the largest at observation pointQa.When the distance increased toQd, the strip structures diminished and could not be observed after that.
Second, the spacing of parallel lines in the strip structure gradually increased.Ten groups’ data of the distance between parallel lines was measured in SEM figures of Qa-Qcby Image J (a measurement application).And mean value and standard deviation of those were calculated.In Table 5, the parallel line spacing of Qawas 5.543 μm,the least among all,while with the distance far from the explosion center, the spacing became larger and larger, disappearing at Qe(see SEM in Fig.12).To be more detailed,the black/dark grey areas in the figures were mainly pearlites, others were small micro voids and cracks (see SEM in Fig.12).
The EBSD results of the same observation points are displayed in Fig.13.The damage characteristics (i.e.grain orientation and misorientation angle) were similar to those in the direction away from the explosion center.
AtQa,the color of grains was the most uneven which confirmed that its damage degree was the most serious, since a lot of subgrains were formed (the LAGB accounts for about 65%).With the distance away from the explosion center, the damage degree of grains gradually reduced,and the proportion of LAGB also showed a decreasing trend.AtQe,the uniform grain color distribution proved that the grain fragmentation almost disappeared, the distribution of misorientation angle was similar to that of the original sample.In addition,it can be identified that from contrast figures that the strip structures were mainly SBs and the rest were MTs,which were the same as the direction along the thickness.
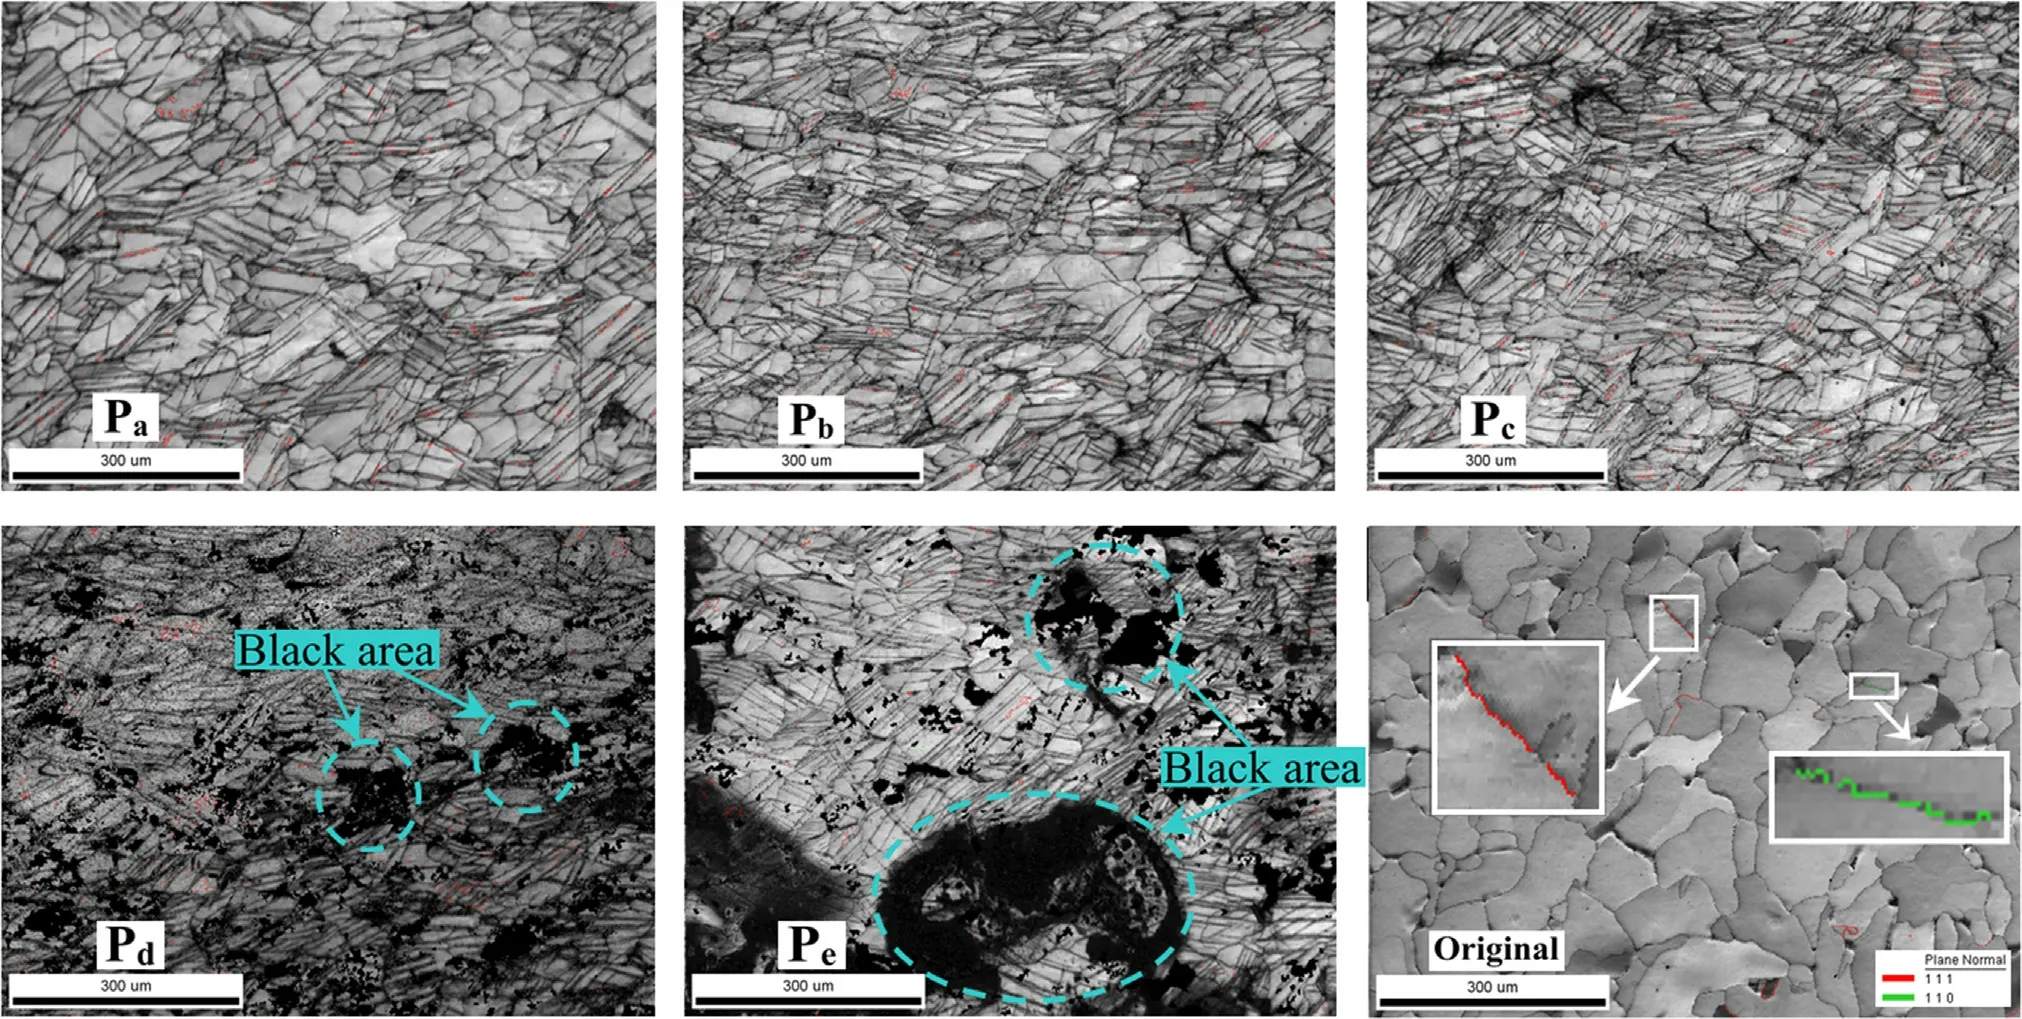
Fig.9.Contrast figures of the original steel sample and 0# sample: (a)-(e) Contrast figures of twins of Pa-Pe; (f) Contrast Fig.of twins of the original steel plate.
4.Discussion
It can be observed by OM, SEM and EBSD that under explosive load,the damage of Q345 steel plate was not uniform in thickness direction, the damage of the lower part was much more serious than that of the upper part,and the damage degree of observation points(Pb-Pe)were gradually increased.Meanwhile,the damage of plate also diminished in the direction away from the center of explosion.In order to find out the damage mechanism,the FEM was used to explore internal relations between stress,specific impulse,and microscopic damage of steel plate along different directions under the explosive load.
4.1.Mesh size selection and accuracy verification of the simulation model
The model is axisymmetric, to improve the computational efficiency, a half model was established.The displacements in all directions of the edges of the steel plate were fixed, and the model were meshed with 3D 8-node element SOLID164 (see Fig.14).The simulation results were compared with the experimental results to verify its accuracy.
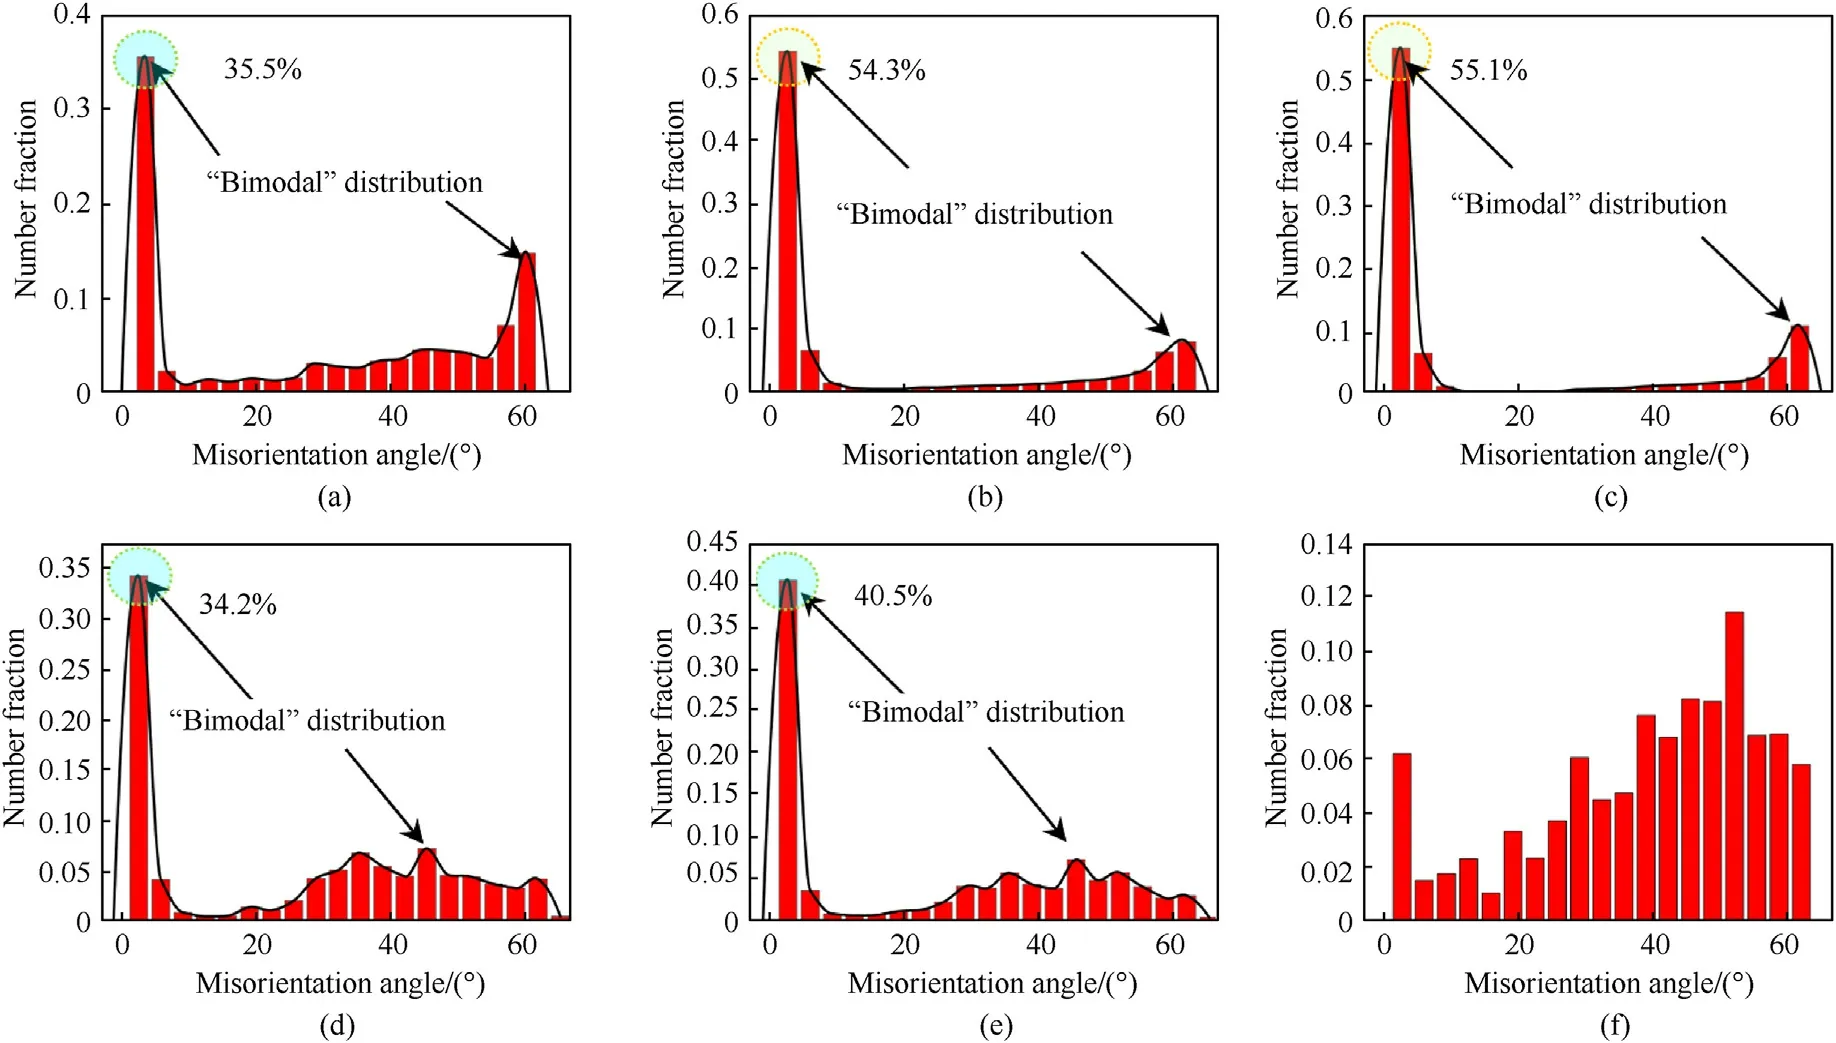
Fig.10.Misorientation angle of the original sample and observation points: (a)-(e) Misorientation angle of Pa-Pe; (f) Misorientation angle of the original sample.

Fig.11.Selection of observation points for 0-6# samples.
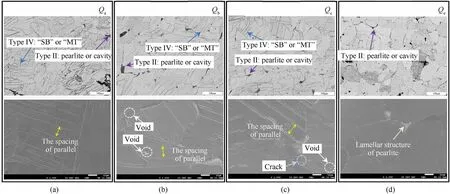
Fig.12.OM and SEM figures of observation points samples: (a)-(d) OM and SEM of Qa, Qb, Qc, and Qe.
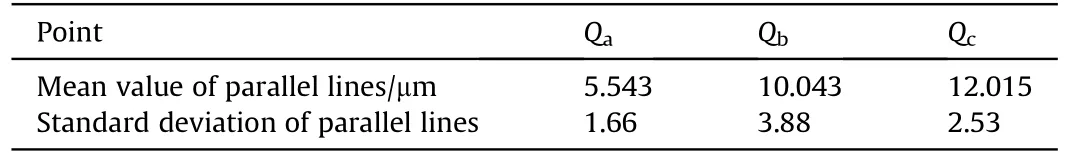
Table 5The average spacing of parallel lines of observation points.
The Q345 steel plate was simulated and analyzed with five mesh sizes(i.e.0.8,1.0,5.0,10.0,and 12.5 mm).Fig.15 shows the results of experiment and simulation with various mesh sizes.In Table 6,compared with experimental result, the mesh size of 1.0 mm had the smallest error (i.e.17.38%), and both simulation and experimental results showed that the large deformation region occurred at the center of the target plate closest to the explosive load,and the maximum deflections of the explosion surfaces were 16.4 mm and 16.5 mm,respectively.Similarly,divided the target plate in the FEM into 0-6#different samples according to the actual experiment.It can be seen from the simulation in Fig.16 results that the area with the minimum effective plastic strain was the neutral plane(approximately 4 mm from the explosion surface), corresponding to the dashed red area indicated by the orange arrow in the experiment; The stress value at the bottom of 0# sample in the simulation results was large,about 0.41,which corresponded to the large crack(chasm)at the bottom of the experimental results.The above results showed that the two had a high consistency, and verified the accurcy of the FEM.Therefore, the model with mesh size of 1 mm was finally selected.
4.2.The internal relations between stress and microscopic damage
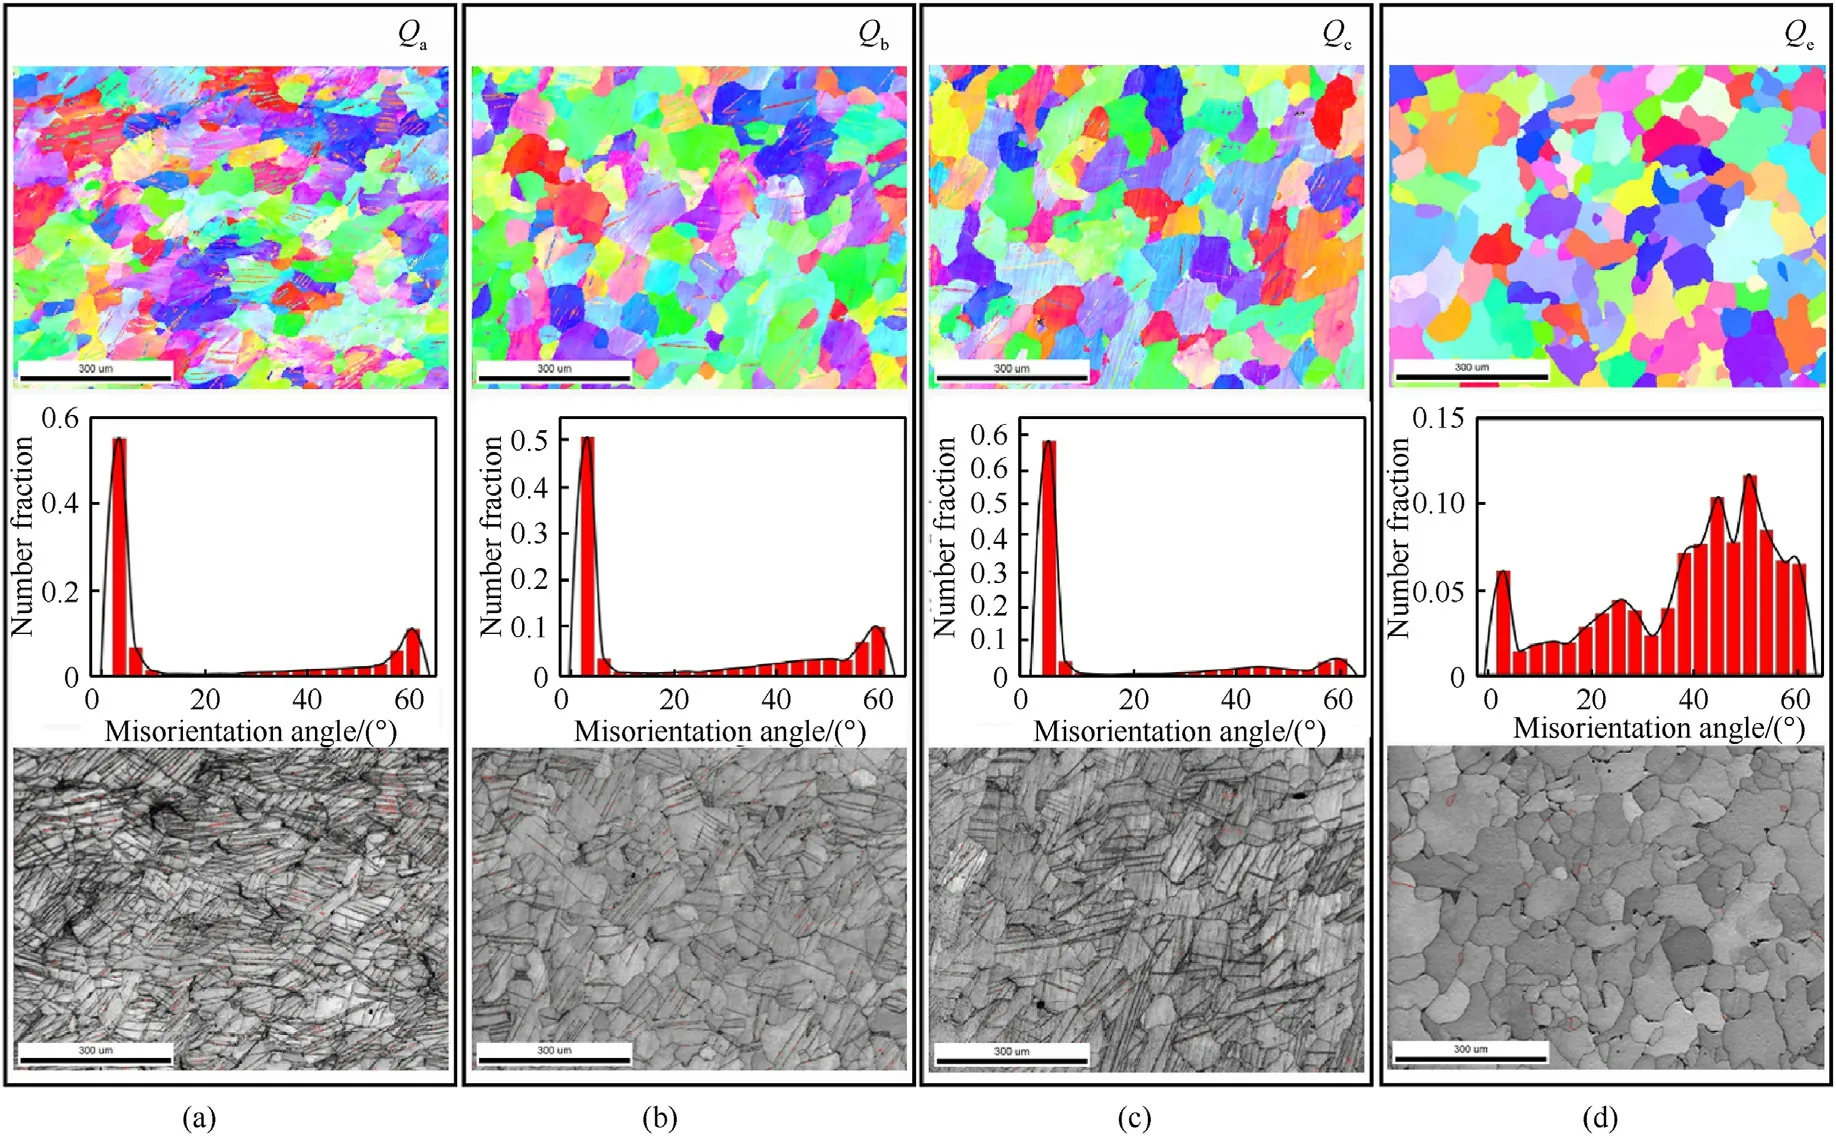
Fig.13.EBSD figures of observation points samples: (a)-(d) Grain orientation, Misorientation angle, and Contrast figures of Qa, Qb, Qc, and Qe.

Fig.14.The boundary condition of the simulation and the considered elements for steel plate: (a) Boundary condition of steel plate; (b) The considered element for steel in LSDYNA.

Fig.15.The boundary condition of the simulation and the considered elements for steel plate: (a) Boundary condition of steel plate; (b) The considered element for steel in LSDYNA.
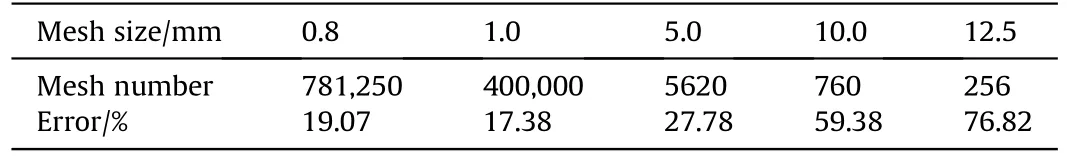
Table 6The comparison of various mesh sizes.
The 0# sample in the model was selected to find the corresponding position of the observation pointPa-Pe(see Fig.17(a)), and the parameters were extracted and compared with the microscopic experimental results.Compared with other parts,the edge of crack has obvious thinning phenomenon(see Fig.17(b)),which was a typical tensile fracture characteristic[42],so it can be judged that the steel plate has tensile fracture.
Some early studies thought that the tensile stress of the free surface was the largest and the crack would start from the free surface and spread inward [43].But for the medium or thick steel plate, under the influence of complex forces such as tensile wave and compression wave, the materials lose their one-dimensional strain characteristics and spall fracture occurs [44] (see the fine cracks in Fig.16).The short-duration and high-intensity compression wave incident from the blast surface propagated and attenuated in the plate.When it reached the free surface, the corresponding reflected tensile wave was generated, and the enhanced tensile stress appeared with the interaction between the tensile wave and the compression wave at middle of the section in the thickness direction.The tensile stress values of observation points were extracted and their stress-time history curves were drawn below.
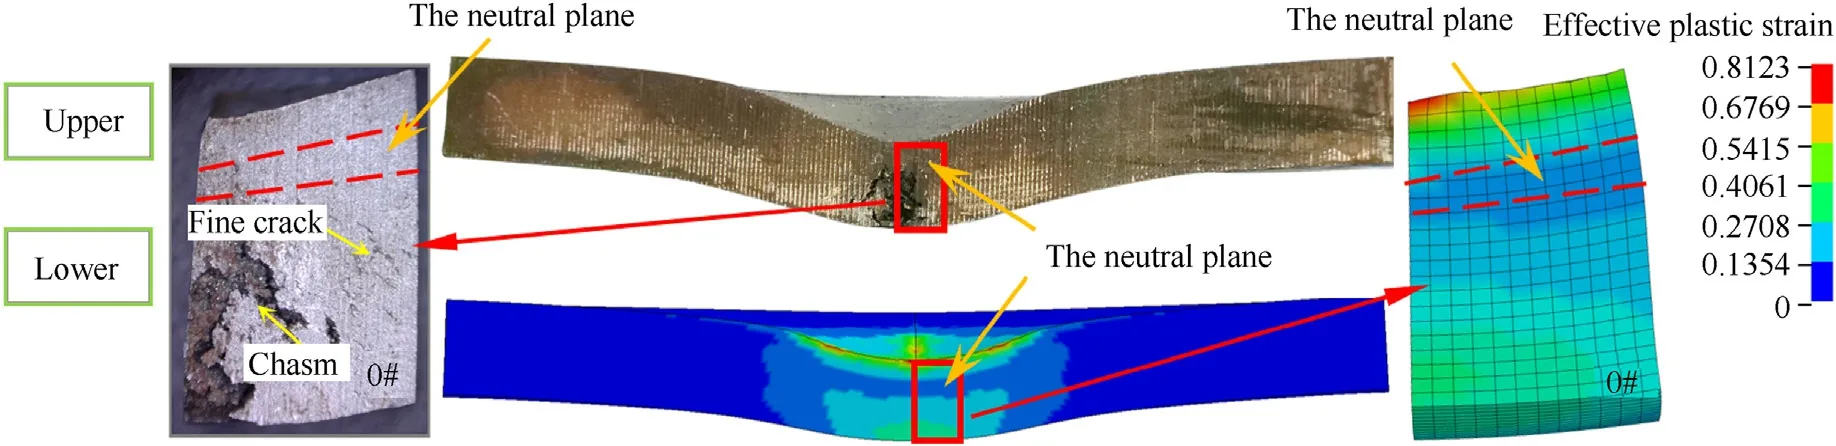
Fig.16.Schematic diagram of explosion experiment and numerical simulation.

Fig.17.FEM results of plate thickness direction: (a) Finite element model observation points selection; (b) Deflection curve of the target plate; (c) Stress areas of the steel plate.
The simulation results demonstrated the phenomenon that in the process of the explosive load acting, the maximum tensile stress appeared in the middle section of the plate (see Fig.(18)).According to the maximum stress instantaneous fracture criterion[45], the crack of the plate should be in the middle of the plate thickness direction firstly.After about 20 μs,Pawas mainly remained in the compression state,Pc,Pd, andPewere mainly remained in the tension state.As the stress wave reflected back and forth,Pb(in the neutral plane) was in the tension-compression fluctuation state, and its fluctuation period increased with the attenuation of the stress wave(see Fig.17(c)).
From the microscopic point of view,the initial crack formation is crystal slip phenomenon,which is commonly known as dislocation motion.Therefore,as can be seen in Fig.7(c),many SBs with small spacing appear at thePcobservation point.
However, the cracking process of metal is very complex, which is a dynamic process of internal damage evolution at any time and space, the material should undergo a process of damage accumulation from the influence of tensile stress to complete failure [46].The specific impulse generated by explosion and its spatial distribution characteristics are the basis of determining the damage mode and quantitatively analyzing the damage effect [47].According to the observation results of OM, SEM, and EBSD, there were more microscopic damage types near the free surface and the damage degree was more serious.Therefore, by integrating the pressure [48] of the selected observation points, the specific impulse results were obtained.
According to the effective stress-time history curve (see Fig.19(a)), it can be obtained that the stress value of each observation point dropped to the minimum after 286 μs,so the pressure of different position in this time period was integrated (see Fig.19(b)).Since the positive and negative values of the specific impulse only represents the direction, in order to visually express its magnitude, the final specific impulse value of each point was taken as a positive value and plotted in Fig.19(c).
Combining the OM, SEM, and EBSD grain orientation figures in Figs.4, 7 and 8, it can be concluded that although the specific impulse of the target plate near the explosion surface was the largest(i.e.161.93 GPa‧μs), the occurrence of micro cracks was due to the nucleation, growth, and aggregation of micro voids.Because the compressive stress had no tensile effect on the cavities,the damage of the upper part of the target plate was mainly manifested as micro voids and SBs,without obvious micro cracks.From the lower part of the steel plate(i.e.Pc-Pe),the specific impulse gradually increased,and the microscopic damage degree of the target plate gradually increased.In addition to the slip zones and cavities, the intergranular cracks, peeling pits, grooves and so on also appeared.
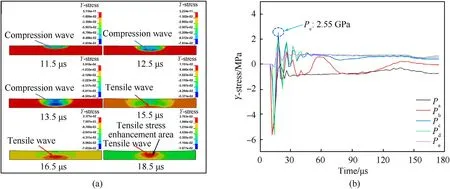
Fig.18.Stress variation of the steel plate and observations points: (a) The propagation process of stress waves; (b) Stress-time history curves of observation points.
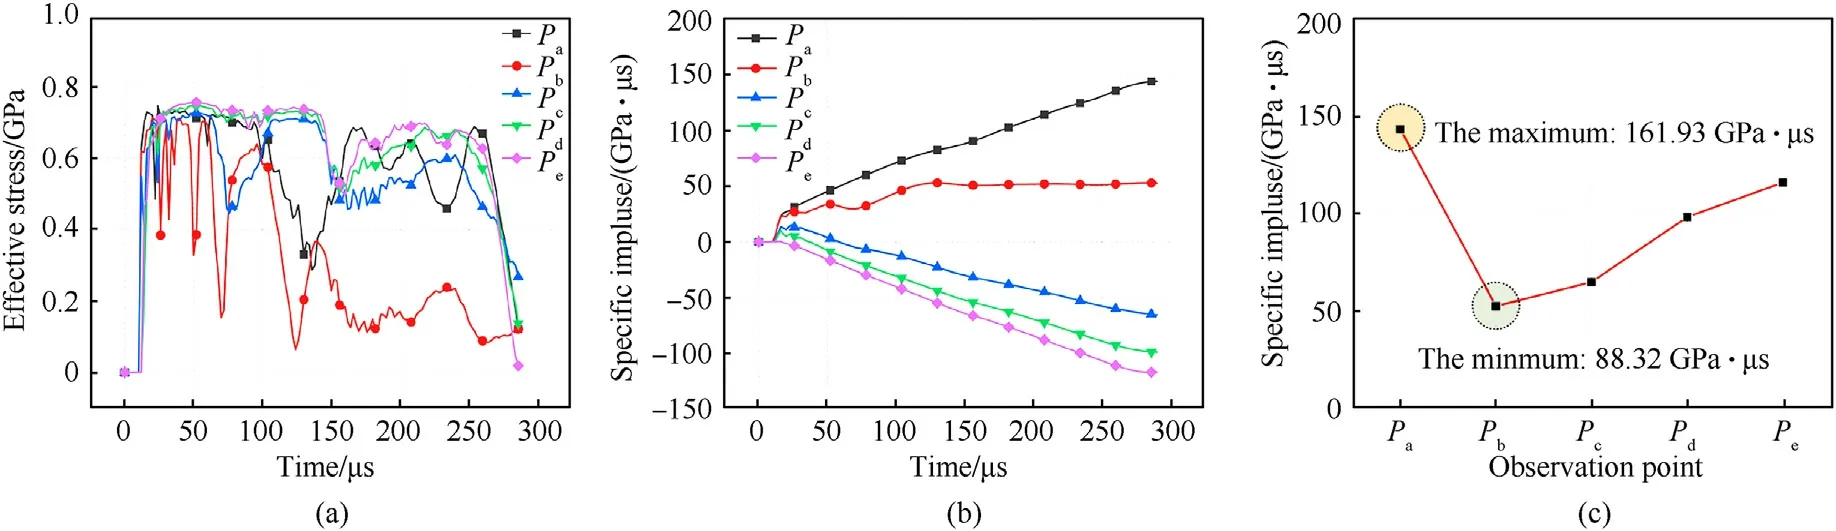
Fig.19.FEM results of plate thickness direction: (a) Effective stress of observation points; (b) Specific impulse-time history curves of observation points; (c) Specific impulse of observation points.
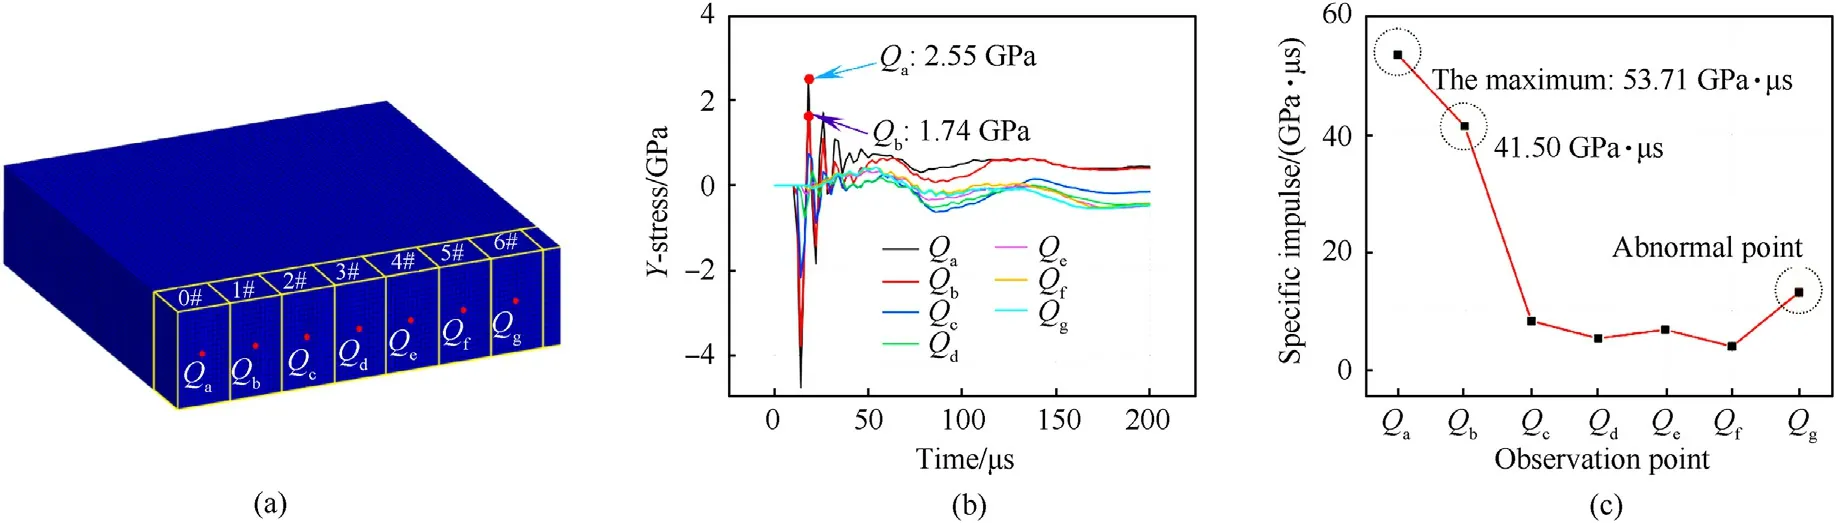
Fig.20.FEM results of plate far from the explosion center direction:(a)FEM observation points selection;(b)Stress-time history curves of observation points;(c)Specific impulse of observation points.
As a result, the microscopic damage at the bottom of the steel plate directly below the explosion center accumulated and expanded, and the micro cracks turned into macroscopic integrity failure and became cracks that can be developed.
The same methods were used to analyze the stress of the target plate in the direction far from the explosion center.Since these two positions were located directly below the explosive,the stress-time history curve (see Fig.20(b)) shows that the maximum tensile stress atQaandQbwere much higher than other positions,so cracks occurred at the two first.
By integrating the pressure ofQa-Qg,the corresponding specific impulse were obtained.Comparing the specific impulse results in Figs.19(c)and 20(c),it can be seen that the effect of shock wave on the steel plate was much smaller in the direction far from the explosion center than that along the thickness.It also showed a downward trend with the increase of the distance to the explosion center.Therefore,there were some small cracks in the middle of the first two samples(see Fig.2(b)and(c)).A large number of SBs and LAGBs were observed in the corresponding microscopic figures(see Figs.12 and 13), and only part of the microscopic damage can be observed on 2#sample.It is consistent with the data obtained from simulation results.However, the abnormal increase of specific impulse at Qgmay be due to the fact that the position was close to the edge of the target plate,and the shock wave was reflected here many times.
5.Conclusions
In this study,taking Q345 steel plate as the research object,the mechanism of micro defects generation and propagation in the quasi-cracking area under the explosive load were investigated.In the area without macroscopic damage, five and seven observation points were selected along the thickness direction and away from the explosion center, respectively.Subsequently, the microscopic damage characteristics of the plate in different directions were studied by OM,SEM and EBSD.Combined the numerical simulation results, the relationship between micro defects and macroscopic mechanical responses were obtained, and the quasi-fracture mechanism of the steel plate at the microscopic level was revealed, which can be used to prevent and predict damage expansion and improve the protective ability of protective materials.The results of this study can be summarized as follow:
(1) The Q345 steel plate had obvious bending deformation under the explosive load.In the whole process, the plate was divided into three stress areas along the thickness direction:the upper compression area,the neutral plane area,and the lower tension area.The volumetric defects (i.e.Type I)mainly appeared in the lower tension area.The other two areas were mainly characterized by cavities (i.e.Type II),grain deformation (i.e.Type III) and SBs (i.e.Type Ⅳ).
(2) According to the results of OM and SEM, there was no obvious defect except SBs in the neutral plane area.However,the number of SBs increased significantly in the other two stress areas.In the lower tensile area, more serious damage such as cavities, peeling pits, grooves and intergranular cracks were also found.And the closer to the free surface,the more serious the plate damaged.Therefore, the increase of slip system could cause the more serious damage of steel plate.
(3) According to the EBSD results, the original grains were broken and refined into small grains with different orientations under the explosive load.In the neutral plane area and its adjacent lower tension area, dislocation slip leaded to relatively small change of misorientation angle within grains,and the number of LAGB increased significantly.In the upper compression area and the lower tension area near the free surface, the misorientation between grains was larger, and the proportion of HAGB was larger.
(4) Combined with the microscopic observation and numerical simulation results,the neutral plane area was in the tensioncompression fluctuation state, and the strain was the minimum, so there was no obvious damage except the SBs;What’s more, the instantaneous tensile stress on the free surface was small, the specific impulse was large.The micro cracks and micro voids gathered and expanded at the grain boundary to become macroscopic damage, and became cracks that can be developed, and finally the fracture occurred at the free surface.The specific impact of the upper compression area was the largest, but because of pressure,the cavities and SBs failed to tear and expand,so no obvious macroscopic damage was produced.
(5) The deflection of the steel plate decreased with the increase of the distance from the explosion center.At the center of the section of each sample,except the first two samples(located directly below the explosive) had cracks, the other samples had no obvious macroscopic damage; Through microscopic observation, the SBs, grain refinement and orientation change can be seen, but disappeared at the fifth sample(about 54 mm away from the explosion center).
Declaration of competing interest
The authors declare the following financial interests/personal relationships which may be considered as potential competing interests:
Dr.BRAHMA RAJU GOLLAAssistant Professor, Dept.of Metallurgical and Materials Engg.,National Institute of Technology Warangal,Warangal-506 004,Telangana,India.Telephone(work):0091-870-245-2526, Mobile:0091-8332969389FAX : +91-870-2459547, E-mail: gbraju121@gmail.com
Acknowledgements
The work was supported by the Science and Technology Project of Fire Rescue Bureau of Ministry of Emergency Management (Grant No.2022XFZD05), S&T Program of Hebei(Grant No.22375419D),and National Natural Science Foundation of China (Grant No.11802160).

- Defence Technology的其它文章
- The interaction between a shaped charge jet and a single moving plate
- Machine learning for predicting the outcome of terminal ballistics events
- Fabrication and characterization of multi-scale coated boron powders with improved combustion performance: A brief review
- Experimental research on the launching system of auxiliary charge with filter cartridge structure
- Dependence of impact regime boundaries on the initial temperatures of projectiles and targets
- Experimental and numerical study of hypervelocity impact damage on composite overwrapped pressure vessels