
Arbitrary-oriented target detection in large scene sar images
2020-07-02 03:17ZishuoHanChunpingWangQiangFu
Defence Technology 2020年4期
Zi-shuo Han, Chun-ping Wang, Qiang Fu
Shijiazhuang Campus, Army Engineering University, Shijiazhuang, 050003, China
Keywords:Target detection Convolutional neural network Multilayer fusion Context information Synthetic aperture radar
ABSTRACT Target detection in the field of synthetic aperture radar (SAR) has attracted considerable attention of researchers in national defense technology worldwide, owing to its unique advantages like high resolution and large scene image acquisition capabilities of SAR. However, due to strong speckle noise and low signal-to-noise ratio,it is difficult to extract representative features of target from SAR images,which greatly inhibits the effectiveness of traditional methods. In order to address the above problems, a framework called contextual rotation region-based convolutional neural network (RCNN) with multilayer fusion is proposed in this paper. Specifically, aimed to enable RCNN to perform target detection in large scene SAR images efficiently, maximum sliding strategy is applied to crop the large scene image into a series of sub-images before RCNN. Instead of using the highest-layer output for proposal generation and target detection, fusion feature maps with high resolution and rich semantic information are constructed by multilayer fusion strategy. Then, we put forwards rotation anchors to predict the minimum circumscribed rectangle of targets to reduce redundant detection region. Furthermore, shadow areas serve as contextual features to provide extraneous information for the detector identify and locate targets accurately. Experimental results on the simulated large scene SAR image dataset show that the proposed method achieves a satisfactory performance in large scene SAR target detection.
1. Introduction
As an important mean of ground detection, synthetic aperture radar (SAR) possesses all-day all-weather and certain penetration capability. Therefore, SAR has been widely applied aboard in military and civilian fields [1], such as target surveillance, weapon guidance,battlefield monitoring,geodetic surveying and mapping,environmental monitoring, disaster prevention. Automatic target detection and recognition (ATDR) of SAR images can effectively obtain target information, regarded as the primary technology to achieve the above practical applications [2]. Traditional target recognition and detection methods of SAR images mainly based on template matching [3], statistical model [4], or feature space.However, with the advent of big data era, the traditional methods are difficult to meet the requirements of massive data processing in terms of efficiency and accuracy.
Since Krizhevsky et al. [5] scooped the top prize in ImageNet large scale visual recognition challenge(ILSVRC)using convolution neural network (CNN) in 2012, CNN has been widely used in classification[[6-8]]and target detection.Up to now,target detection based on CNN has achieved remarkable successes, such as R-CNN[9],Fast R-CNN[10],Faster R-CNN[11],FPN[12],which belong to two-stage detection approaches, and YOLO [13], SSD [14], DSSD[15],which belong to single-stage detection approaches.Generally,the two-stage detectors are superior to the single-stage detectors in accuracy[16],so the former is adopted more in the field of accurate identification and positioning. The RR-CNN [17] realizes multiangle ship detection by adding rotation region pooling layer and rotation border regression model in R-CNN. Yang et al. [18] propose a R2CNN++ network framework, which combines the rotation branch network with Faster R-CNN and is applied to multioriented vehicle detection with an accuracy rate of 91.75%.
CNNs are developing rapidly both in optical image and SAR image target detection.In Ref.[19],full convolution neural network is proposed and verified to be effective in SAR image target classification. In Ref. [20], DeepSAR-Net based on CNNs with normalized layer is proposed for ship detection,and achieves good results.In Ref. [21], a simple CNN incorporating multi-aspect perception technology gets an inspiring accuracy of targets recognition in MSTAR dataset. Liu et al. [22] use R-CNN to detect targets in the regions of interest(RoIs)extracted from the original image directly,and realize large scene SAR image detection. In Refs. [23,24], the efficiency of Faster R-CNN for target recognition and detection is verified in MSTAR and its extended dataset. Most of the above researches on SAR image target detection focus on single target recognition and horizontal frame localization, and often cause target loss with the simple clipping strategy of large scene SAR images. Multi-oriented target detection in scene images can not only identify the targets, but also make a strong judgment of the next dynamic of each target based on the positioning results,which is of great significance to the judgment of battlefield hostility and urban traffic monitoring.
Another way to improve the performance is multilayer fusion strategy, FPN and CMS-RCNN [25] are typical representatives. Researches show that multilayer fusion is beneficial to feature propagation and reuse, and makes feature maps consider both semantics and high resolution requirements.Kang et al.[26]apply CMS-RCNN to ship detection in space-borne SAR images and achieve an astonishing result.In addition,contextual features are often used as supplemental information of targets to reduce false alarm rate and improve recognition rate [27,28]. For SAR images, each target has its own unique shadow, which can help detectors to identify and locate targets more accurately. Thus, adding the feature of shaded part to the whole representative information seems a good way to make the target detection networks more robust.
As mentioned above, detecting targets in SAR image not only has great development space, but also faces many challenges. In this paper,we propose a contextual rotation RCNN with multilayer fusion for target detection in large scene SAR images.For clarity,the main innovations of this paper are summarized as follows:
1. For large scene SAR images, a maximum sliding cropping strategy is adopted, which increases the randomness of targets distribution and avoids the problem of over-fitting caused by small training dataset.
2. We build a novel target detection architecture based on Faster R-CNN, which is able to generate rotational bounding boxes,reduce redundant detection region and handle different complex scenes.
3. We apply multilayer fusion strategy to obtain fusion feature maps with high resolution and rich semantic information for proposal generation, and adopt rotation anchors to generate rotation proposals for the next stage, which greatly improves the detection accuracy of the network and enriches practical application value.
4. We propose an integrating shadow context strategy, which can rule out false alarms, enhance the classification and location performance of the framework,and supplement the calculation of confidence scores and bounding box regression.
The proposed method is evaluated on simulated large scene SAR images, which are randomly fused from environmental scene images and target slices in MSTAR dataset and MiniSAR dataset, and compared with other five methods.The experimental results verify the efficiency of the proposed method in target detection.
The remainder of this paper is organized as follows. Section 2 concerns the implementation details of the proposed method.Section 3 introduces dataset description, training details and evaluation metrics. Section 4 presents the specific experimental process and discusses the results. Finally, section 5 concludes the whole paper.
2. Methodology
In this section, we will detail the various parts of the proposed target detection method. Fig.1 shows the overall network framework of the proposed method, which is composed of three major components:the feature extraction network(FEN),rotation region proposal network (R-RPN), rotation region detection network (RRDN).Firstly,the original large scene image is divided into several sub-images according to the maximum sliding cropping strategy.Then semantic and high resolution feature maps are constructed by FEN based on multilayer fusion strategy for region generation.Secondly, R-RPN gets rotational regions of interest (R-RoIs) by rotation anchors, and provides high score region proposals for RRDN. Thirdly, in R-RDN, the minimum circumscribed rectangle of each proposal and the shadow region is adopted as context information together with the proposal, which can provide representative information after max pooling and R-RoI pooling for R-RDN to output the class prediction and location regression. Finally,labeled sub-images are stitched together to a scene image.
2.1. Maximum sliding cropping strategy
Normally, in order to obtain feature maps with the same size,the original images will been adjusted to a certain size before being sent to the CNN, which will lead to discarding of many pixels,resulting in information loss and sharp decline in target detection accuracy, including target missing, inaccuracy of target location,and lower confidence[29].In order to avoid the defect,cutting large scene images into a series of sub-images has been widely used in scene image detection. Since targets may be in any position of the image,the traditional strategies often cause targets missing,which results in unsatisfactory detection results.
In this paper, we use maximum sliding operation to clip large scene images into sub-images,which are sent to CNN for detection subsequently.In order to obtain higher target detection accuracy,it is necessary to ensure that every potential target is included in at least one sub-image after clipping.Absolutely,a single-pixel sliding window can get the best detection result, but it is equivalent to increasing the number of detection times artificially, which will inevitably affect the evaluation of real results in the later period,and at the same time, the time loss will increase. A large-stride sliding window can reduce time consumption and human intervention, but one target may be split into multiple blocks by adjacent sub-images, resulting in target missing. In view of the above analysis,it is necessary to select appropriate window sliding stride to minimize human intervention and time consumption without decreasing the detection accuracy. If the target size is wt× ht, and the sliding window size is z, then the sliding window stripe must satisfy the following formula:

According to Eq.(1),we take z=400 and k =310,in accordance with the principle of “minimizing human intervention and time loss without affecting the detection accuracy”. Fig. 2 shows the diagram of the maximum sliding cropping strategy.
2.2. Feature extraction network

Fig.1. Overall network framework of the proposed method.
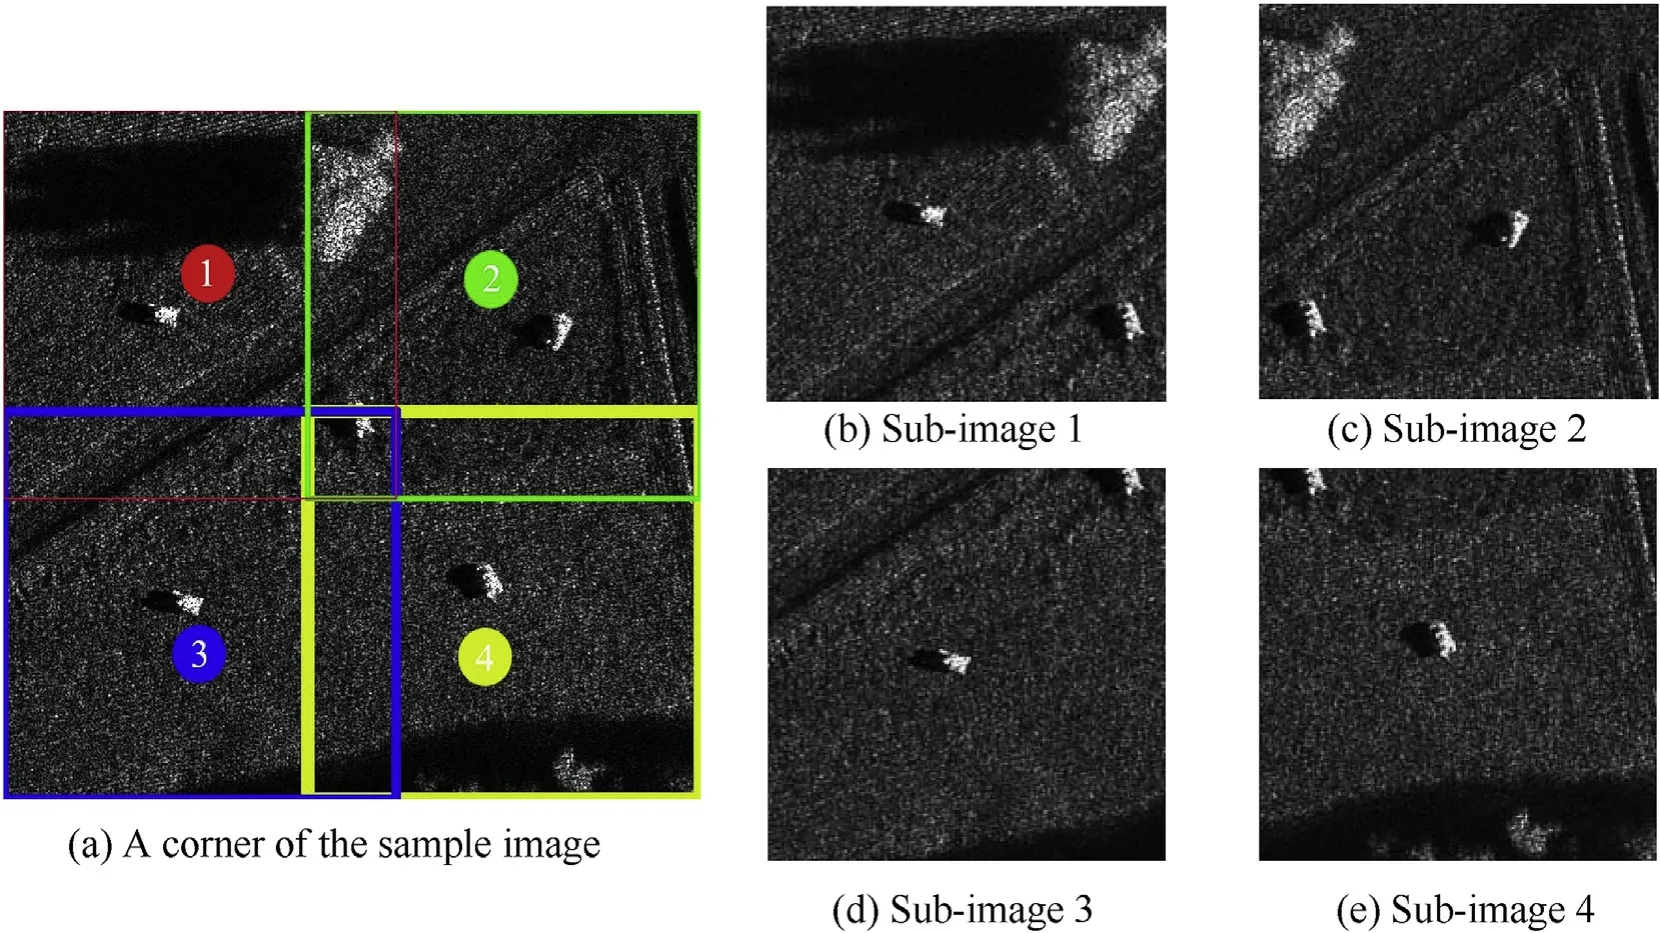
Fig. 2. Diagram of the maximum sliding cropping strategy.
In recent years,researchers have proposed six typical networks for feature extraction: AlexNet [30], VGGNet [31], GoogleNet [32],ResNet [33], DenseNet [34], SENNet [35]. For SAR image interpretation, ResNet18 have obvious advantages in recognition accuracy and time loss compared to other network structures [36]. Therefore,ResNet18 is adopted to extract features and construct feature maps in this paper,but the detection result is not very satisfactory.As we know, high-level features contain highly semantic information,but lack targets location information due to lower resolution.On the contrary, the low-level features are just the opposite. We apply multilayer fusion strategy to reprocess the feature maps constructed by ResNet18 to obtain more comprehensive and representative feature representations. As shown in Fig. 3, C2, C3,C4 are the outputs of conv2_2, conv3_2 and conv4_2 of ResNet18 respectively. In order to get more representative features, the shallow layer C2 is down-sampled by maxpooling, the deep layer C4 is up-sampled by deconvolution.Then they are compressed into a uniform space by l2normalization as P2 and P4, which are concatenated with l2-normalized C3 and fuse into P3 with more detailed information for region generation.
2.3. Rotation region proposal network
In R-RPN, a series of cursory R-RoIs is generated by rotation anchors, and each R-RoIs is accompanied by a score to determine whether it is a target or not for subsequent re-detection.The main ingredients of R-RPN will be described below.
2.3.1. Rotation bounding box
The traditional detection algorithm calibrates the target by a horizontal bounding box,which is simply recorded by coordinates of the upper left corner and lower right corner,expressed as(xmin,ymin,xmax,ymax). However, this calibration method lacks direction information, and once the target inclines, more redundant information will appear in the calibration area. Therefore, in order to locate the target more accurately, we have to redefine the representation at first. In this paper, we use five variables(x,y,w,h,θ) to uniquely redefine the arbitrary-oriented bounding box.As shown in Fig.4,(x,y)represents the coordinate of the center point,rotation angle(θ)is the angle at which the horizontal axis(xaxis)rotates counterclockwise to the first edge of the encountered rectangle,and its range is[-90°,0°).At the same time we define this side is width(w), and the other is height(h).
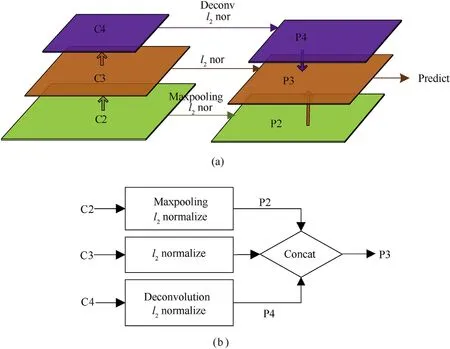
Fig. 3. The multilayer fusion strategy. (a) The stereogram; (b) the flowchart.
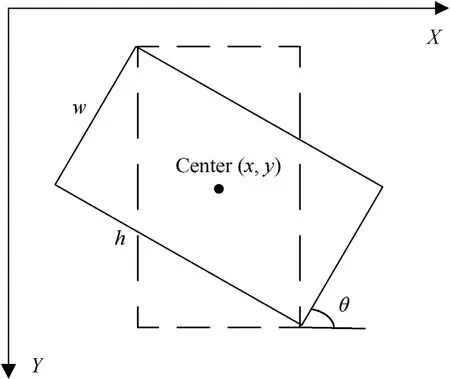
Fig. 4. General representation of rotation bounding box.
2.3.2. Rotation anchor
In the RPN phase of the two-stage detection methods such as R-CNN series and R-FCN[37],the anchors at each feature point are the initial shape of the RoIs. Properly setting anchors can help to form RoIs quickly.A rectangular anchor can generate a rectangular RoI eventually. Similarly, R-RoIs can be obtained by the rotation anchors. The scale, ratio and angle of the anchors depend on the targets being tested.
Taking into account of the characteristics of the target slices in MSTAR dataset,the w-to-h radios are set to{1:1.5,1:2,1:2.5,1,1.5,2,2.5},and the sizes of the scale are{25,30,35,40}.On this basis,we add nine angles {-10°, -20°, -30°, -40°, -50°, -60°, -70°,-80°,-90°}to generate rotation anchors.Namely,for each feature point of each feature map,there are 252 anchors(7×4×9),which will be imported into the box-classification layer and the boxregression layer in a sibling fully connected manner, and then there will be 504 outputs (2× 252) for the classification layer and 1260 outputs (5× 252) for the regression layer.
2.3.3. Skew intersection-over-union computation
In RPN, a large number of cross-boundary proposals will be generated.Therefore,to alleviate the redundancy and improve the detection performance, non-maximum suppression (NMS) is utilized to get the most appropriate proposals. For NMS, the value of the intersection-over-union (IoU) is a judgment criterion for determining whether the proposal meets the requirements. However, due to the arbitrary orientation of rotation bounding boxes,there are skew interactive areas between cross-boundary proposals,so IoU calculation on axis aligned bounding box is no longer suitable for computing skew IoU.But any overlap area between two cross-boundary bounding boxes is always a polygon. So, the skew IoU calculation method based on triangulation is proposed to address the problem [38]. The geometric principle is shown in Fig. 5. We can obtain the overlap area Soand the union area Suas follows:


Fig. 5. Skew interaction.

The skew IoU can be defined as:

2.3.4. Loss function
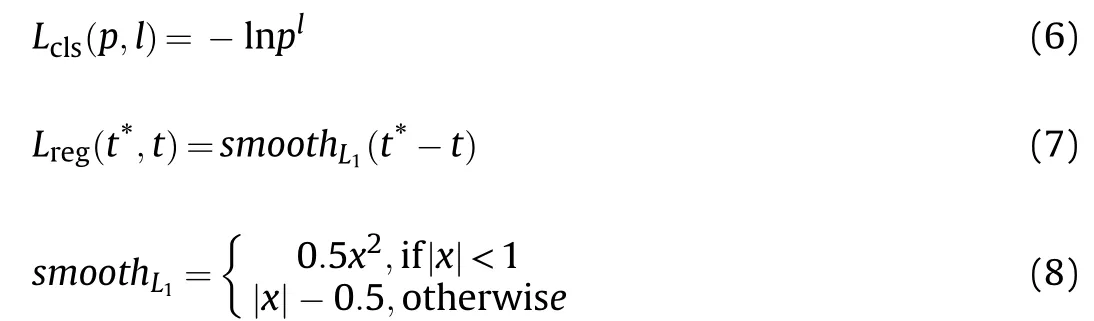
The loss function is defined as a multi-task loss L to minimize the objective function [39]. It can be computed as follows:

where piis the predicted probability of the i-th anchor calculated by the soft-max function,lirepresents the label of ground-truth,tirepresents the five parametric coordinate vector of predicted bounding box output by the regression layer,and t*irepresents the five parametric coordinate vector of ground-truth. The classification loss Lclsis log loss over two classes (background and target).The regression loss Lregis the robust loss function (smoothL1). The two task losses are normalized by Nclsand Nreg, and balanced by hyper-parameterλ. In addition, the classification loss Lclsand the regression loss Lregin Eq. (5) are defined as:
The parameterizations of five coordinates are defined as follows:
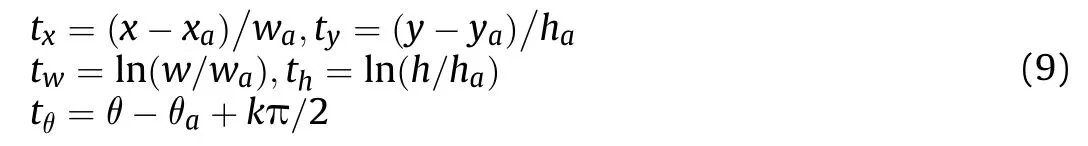

where(x,y,w,h,θ)(xa,ya,wa,ha,θa)and(x*,y*,w*,h*,θ*)denote the position coordinates of the predicted bounding box,anchor box and ground-truth box respectively. The parameter k∈Z keeps θ in the range of[-90°,0°).When k is an odd number,w and h needs to be swapped to keep the bounding box in the same position.
2.4. Rotation region detection network
R-RDN detects the proposals obtaining from R-RPN to output the eventual information of classification and location. In this section,the integrating shadow context strategy and the generation process of detection results are introduced in detail.
2.4.1. Integrating shadow context
Target detection based on contextual CNN is mostly used in face detection [25,26], human behavior detection [40], and population density estimation [41]. These researches suggest that contextual information is a critical piece to improve target detection performance, and context can greatly rule out false alarms and provide additional features for target recognition.For SAR images,both the target and the shadow are rich in target feature information,which can be used to obtain robust feature representation. Especially for target recognition and reducing false alarm in large scene SAR images, it is particularly important to increase the amount of information used for detection. Based on the above analysis, our network is designed to make explicit reference to the context information and the proposals in target detection.
As shown in Fig. 6, the integrating shadow context strategy takes the green block as the context information.The blue block is translated by the red proposal along the incident angle of the radar to the disjoint position,and the minimum circumscribed rectangle of red and blue block is context information.This strategy may not cover all the shadow sometimes but should be correct in most scenarios.And we can adjust the size of the blue block at any time according to the incident angle of the radar to adapt to various scenarios. Let the coordinate of the proposal be(xp,yp,wp,hp,θp),then the contextual region coordinate (xc,yc,wc,hc,θc) can be determined by the following equation:

Fig. 6. Integrating shadow context.

2.4.2. R-RoI pooling
In R-RDN, after the integrating shadow context strategy is implemented,proposals and the corresponding contextual regions will be ascertained.Then,R-RoI pooling and RoI pooling operations are performed for each proposal and contextual region in fusion feature maps to represent the target features and the contextual features. After two fully connected layers, they concatenates to a single feature block which is thoroughly mixed together by the next fully connected layer.Then,it is imported to the classification layer and the regression layer to compute confidence score and bounding box regression, as shown in Fig.1.
For horizontal bounding box calibration, RoI pooling is often used to obtain fixed-length feature vector from the proposal,but it is not suitable for arbitrary direction calibration algorithm. So, we use R-RoI pooling to dimension-reduce the rotation proposal. The process of R-RoI pooling is shown as follows: considering the first width edge of the rotational bounding box as the horizontal axis,we divide the bounding box with a coordinate of(xp,yp,wp,hp,θp)into 3×3 bins by a parallel grid,the size of each bin is wp/3× hp/3,then R-RoI pooling can be modeled as:

where yrjdenotes the pooled output of the j-th bin of the r-th RRoI,B(r,j) is a set of pixels belonging to the j-th bin,xiis the size of the i-th pixel.When θp= -90°,R-RoI pooling is equivalent to RoI pooling.
2.4.3. Non-maximum suppression between sub-images
As mentioned before, the large scene image will be cut into a series of sub-images before being sent to the CNN. Once the localization and classification are completed in the CNN network for each sub-image, the next task is to splice the sub-images together. However, it should be noted that the common area of adjacent sub-images may have the same targets, which will result in bounding boxes overlapping after the splicing.We execute nonmaximum suppression between sub-images(NMS-SI)to deal with this problem, after the operation of NMS is implemented in every sub-image.
Before NMS-SI, we need to determine the absolute coordinate(x*,y*) of each pixel in the large scene image, so that the subimages can be stitched together without confusion in the later stage.Suppose that the sub-image of a large scene image is the i-th from left to right and the j-th from top to bottom, (x,y) is the coordinate of any pixel in this sub-image, then (x*,y*) can be calculated by the following equation:

where k is the sliding window stripe in Eq. (1).
We handle the overlapping bounding boxes in the common region of adjacent sub-images according to the following strategies.At first, these bounding boxes are divided into several groups according to whether there are common overlapping areas or not.Then, in each group, the bounding box with the highest classification score is set as a compared box.Finally,the IoUs between the compared box and any other bounding box in the group are calculated,and the bounding boxes which have an IoU higher than a certain threshold will be deleted.Fig.7 shows each step of target detection in a large scene SAR image graphically, and in order to observe conveniently, we use red and green bounding boxes to represent the detection results of the same target in two adjacent sub-images respectively.
3. Dataset and experimental setting
3.1. Dataset and extending
In this paper, the experiments are based on the MSTAR dataset collected by the US Defense Advanced Research Projects Agency and the Air Force Laboratory, and MiniSAR dataset released by Sandia Laboratory in the United States.
At present, the MSTAR dataset is widely used in SAR ATDR algorithms test comparing. The SAR images are in spotlight model,with 0.3 m resolution and the azimuths are full coverage over 360°.The dataset is acquired by x-band, HH polarization and 0.3 m×0.3 m resolution spotlight SAR,and consists of ten types of typical military targets static slices with full aspect coverage over 360°and 100 environmental scene images. We use the slices of BMP2,T72 and BTR70 as original material,which are more standard in MSTAR. SAR images and Optical images of the three types of military targets are shown in Fig. 8.
The MiniSAR dataset contains a large number of 2510 × 1638 high-resolution urban scene SAR images,including various types of targets, such as trees, lawns, buildings, vehicles, as shown in Fig. 9(d). In the experiments, various attitude targets in MiniSAR images can be used as interference signals to verify the robustness of the network.

Fig. 7. Graphical detection process and NMS-SI.

Fig. 8. SAR images and optical images of BMP2, T72 and BTR70.
There are a total of 340 MSTAR scene images and 25 MiniSAR scene images use for experiments,which are randomly fused from environmental scene images and military target slices. Among these images,300 images of MSTAR with 2730 targets are used for training,and the remaining 40 MSTAR images with 696 targets are used as test set 1, 25 MiniSAR scene images are used as test set 2,also including 696 targets. Because in the training process, a large scene image needs to be divided into 30 sub-images, so the actual number of images used for training is 300× 30 = 9000. Similarly,test set 1 and test set 2 each contain 1200 and 1350 sub-images.Nevertheless, the number of large scene SAR images in the train set is still insufficient to obtain an excellent target detection network,so the target slices in MSTAR are used to expand the train set.If the slices in MSTAR are resized directly to the appropriate size for training, the difference of target size between the two groups will have a negative impact on network training.Therefore,we fill pixels around the slices randomly to match the size of the subimages of scene images, and choose two extended images for each slice as training samples too.Fig.9 shows the example of large scene images of MSTAR and MiniSAR,sub-images(400×400),and extended images (400×400). The specific information of train set with 15°depression angle and test set with 17°depression angle used in this paper are shown in Table 1. From the table, it can be seen that the actual size of the train set is 300× 30+ 1174 =10174.

Table 1 Composition of the experimental datasets.
3.2. Training
All experiments are done on the deep learning framework,tensorflow [42] and run on a PC with dual E5-2630v4 CPUs, a NVIDIA GTX-1080Ti GPU (11G video memory),and 64 GB RAM.
All initialization parameters in the network are randomly sampled from Gauss distribution with mean value of 0 and standard deviation of 0.01.The initial learning rate of the R-RPN is 0.001,the next learning rate is to divide the current learning rate by 10 per 20 k iterations,and the maximum number of iterations is 80 k.We train a total of 120 k iterations in R-RDN training phase with the learning rate same as R-RPN. R-RPN and R-RDN share the feature maps output by FEN and are trained in an alternating manner[23].
In order to improve training efficiency, several positive and negative samples are extracted from all anchors generated by RRPN to form a mini-batch.The anchor with an IoU higher than 0.5 and angular difference less than 15°will be taken as a positive sample.In contrast,the anchor with IoU less than 0.2 or IoU higher than 0.5 but angular difference greater than 15°will be defined as a negative sample.In R-RPN stage,a total of 256 anchors form a mini batch for training,where the ratio of positive and negative samples is 0.5. Similar to R-RPN stage, the total number of positive and negative samples is 128 and the ratio is 0.5, in R-RDN.
3.3. Evaluation metrics
An excellent target detector not only needs to perform position detection, but also can correctly classify the detected targets. To quantitatively evaluate the performance of the detector,we use the detection precision metric (P), recall metric (R), F_1 score (F_1) to assess the position detection performance and recognition rate metric(A)to evaluate the recognition performance.P measures the proportion of correct detection in all predictions, R measures the proportion of correct detection in the ground-truth, F_1 is an overall statistic of the detection performance. A measures the proportion of correct classifications in the positives. The four metrics are defined as follows:


Table 2 Numbers of BMP2, BTR70,T72 for testing.

where true-positive(TP)denotes the number of correct predictions,false-positive (FP) denotes the number of error predictions, falsenegative (FN) denotes the number of missing checks, and Ntrdenotes the number of correct classifications.
4. Experimental analysis and discussion
4.1. Recognition and detection results on original slices of MSTAR dataset
In order to verify the recognition and detection performance of the proposed network on original slices of MSTAR, we select 696 original slices of BMP2, BTR70 and T72 with 17°depression angle from MSTAR as test set for experiment,specific settings are shown in Table 2.Since the size of original slices is quite different from that of training samples, we fill pixels around the slices to 400× 400 before CNN. After the detection, the result image is cut to the original size according to the proportion, as the final result. Examples of test results, detection and recognition accuracy are shown in Fig.10, Table 3 and Table 4, respectively.
Table 3 shows that the proposed method achieves an excellent performance in the detection of original slices of BMP2,BTR70 and T72.The F_1 scores are all above 0.99,and the R values of BMP2 and BTR70 are 100%. Table 4 shows the confusion matrix of the three kinds of target recognition,in which the diagonal elements record the correct recognition number of different targets.Although there are many cross-classification errors in BMP2 and T72 due to their close features, any of the three kinds target can be correctly classified with over 90% correct recognition rate and the overall recognition rate reaches 94.81%, which fully illustrates the effectiveness of the method.
4.2. Influence of different layer combination models
As mentioned before,there are differences in spatial resolution and semantics between feature maps from different convolution layers of ResNet18, so the selection of fusion layers has a great impact on the performance of the detector, which gives themcomparative advantages and disadvantages. Besides “C2+C3+C4”multilayer fusion model used in this paper,there are“C3+C4+C5”,“C2+C3+C5”, “C2+C3+C4+C5” and so on. In this section, we use the proposed network structure with five different fusion models for target detection to verify the advantages and disadvantages of the combination of different convolution layers. The first model contains just one layer C5.The second model combines all layers of ResNet18,namely“C2+C3+C4+C5”.The third model integrates C2,C3, C5. The fourth model is the fusion of C3, C4, C5, and the final model includes C2, C3, C4.

Table 3 Detection results of 3 targets.
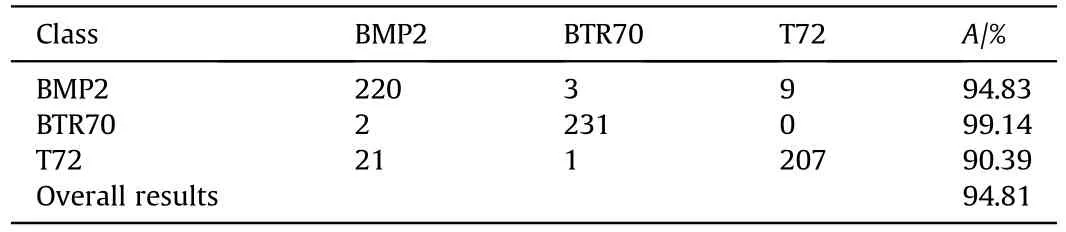
Table 4 The confusion matrix of 3 targets recognition.
Two scene images with different backgrounds are randomly selected from test set 1, each of them contains 15 targets, BMP2,BTR70 and T72, each with five, details are shown in Fig.11. Fig.12 shows the detection and recognition results of two different models on scene images. Model C5 misses 1 target and misidentifies 2.The situation improves greatly when C2,C3 and C4 are combined. “C2+C3+C4” achieves the best results in both simple and complex scene images of MSTAR. The comparison of the performance indicates that multilayer fusion strategy has a great impact on detection performance.
In order to verify the influence of multilayer fusion model more comprehensively,we perform a group of experiments on test set 1.Table 5 displays the A, P, R and F_1 scores of different multilayer fusion models. Ndetected_targetsrepresents the total number of predictions.Compared with the performance on a single layer C5,the multilayer fusion models achieve better results,especially in A and R. The performance of models “C2+C3+C4+C5” and “C2+C3+C5”which achieve more than 98%both in P and R,over 93%in A,0.98 in F_1 score, is much better than models “C3+C4+C5” and “C5”. It is not difficult to see that the models containing C2 can achieve better performance,which indicates that shallow features play a vital role in detecting networks because of its high resolution and rich target location information. Compared with other fusion structures,“C2+C3+C4”has the best performance,since the feature maps give full play to the advantages of shallow features and high-level features in target detection.The reason for discarding C5 is the highly semantic target features contain less available target location information and classification information.

Fig.10. Examples of test results on original slices. (a) (b) (c) indicates the test results of BMP2, BTR70, T72.

Fig.11. Two scene images selected from test set 1.1-5 are BTR70,6-10 are BMP2,11-15 are T72.(a)Targets distribution on simple background;(b)targets distribution on complex background.

Fig. 12. Experiment on MSTAR scene images. The blue labels and boxes represent BMP2, green represent BTR70 and red represent T72, yellow and aqua rectangles represent missing target and misidentifying targets. (a) (b) detection results of model C5; (c) (d) detection results of model C2+C3+C4.
In summary, the layer combination strategy has a profound impact on the improvement of detection performance.As for target detection in SAR images, since the sizes of most targets are small,their features are relatively simple. The combination of shallow layers from ResNet18 can acquire enough semantic features to complete the detection task,and also this is exactly why ResNet50,ResNet101, or even deeper networks are not used in this paper.

Table 5 Experimental results with different layer combination strategies.
4.3. Influence of maximum sliding strategy, multilayer fusion strategy, rotation anchors, and integrating shadow context strategy
In order to validate the influence of maximum sliding strategy,rotation anchors,and integrating shadow context strategy,a series of experiments on large scene SAR images in test set 1 are applied.Table 6 summarizes the results of 6 experiments,and then we can analyze the main role of each structure by comparing the results of different methods.Easy to know,our framework achieves the stateof-the-art performance, 96.11% in recognition rate, 99.28% in detection precision, 99.71% in recall, and 0.995 in F_1 score.
Experiment 1 is actually the basic Faster RCNN with ResNet18 as feature extraction network,which yields unsatisfactory results.On the basis of experiment 1,we add maximum sliding strategy,which improves the performance of Faster RCNN to some extent. By the way,if the targets are densely distributed,or the image size is large enough, the role of maximum sliding strategy will be moreimportant. In experiment 3, the performance of the detector has been greatly improved,due to the application of multilayer fusion,which leads to 18.37% increase in A, 5.30% increase in P, 15.95%increase in R and 0.114 increase in F_1 score. It can be seen that multilayer fusion plays a vital role in network performance. In experiment 4, rotation anchors are used to generate rotational bounding boxes, which can complete multi-oriented target detection accurately. As an aside, although the application of rotation anchor seems not improve detection performance obviously,but it still exerts great influence on observing target dynamics.As shown in Fig. 13, rotational bounding boxes not only reduce the redundancy of the target areas,but also help the observer to find targets and make further judgments easily. Experiment 5 shows that although integrating shadow context strategy does not improve the performance as much as multilayer fusion strategy,it also achieves satisfactory results compared with experiment 1, especially in A with 11.87% increase and R with 12.93% increase.
In summary, multilayer fusion strategy possesses the most obvious improvement on the overall performance of the network,followed by integrating shadow context strategy and maximum sliding strategy. Although the application of rotation anchors improves the performance unsatisfactorily, it has a greater effect on practice.

Fig.13. Comparison of two different labels.The blue boxes represent BMP2,green represent BTR70 and red represent T72.(a)Horizontal rectangular labels;(b)rotational box labels.

Fig.14. Experimental results on test set 2.The blue labels and boxes represent BMP2,green represent BTR70 and red represent T72.Purple rectangles represent private cars.(a)The scene image of a residential area; (b) the scene image of a train station; (c)(d) detection results.
4.4. Robustness analysis of the network
In order to increase the complexity of MSTAR dataset and verify the robustness of the network,a group of comparative experiments on test set 1 and test set 2 are applied without changing the settings of the training set, and the results are shown in Table 7. It can be seen from the table that the two experiments have achieved satisfactory detection results, among which A, P and R can reach over 95%,indicating that the network has certain robustness to the complex scene images. However, due to the presence of the interference signals, the detection results on test set 2 are worse than those on test set 1, FP is increased by 10, and FN is increased by 6,the declines of A, P, R and F_1 are all within 2%.
Fig.14 shows the detection results of the proposed network on test set 2. The two sample images contain 15 targets, 5 each of BMP2, T72 and BTR70, as shown in Fig. 14(a) and (b). Fig. 14(a)displays a residential area with a large number of buildings and trees,and Fig.14(b)displays a railway station with a large number of tracks,trains and private cars.Fig.14 indicates that the proposed method still maintains excellent detection performance even under many interference signals.
4.5. Comparisons with other target detection methods
In order to verify the superiority of the proposed method,Constant False Alarm Rate(CFAR)[43],Light level CNN[44],Faster RCNN[23],SSD[14]and RCNN+Fast Sliding[29]are applied to the test sets, in the meantime. All methods are run in the same experimental environment and settings. The experimental results of the six different detection methods are listed in Table 8.
First of all, we analyze the performance of the various algorithms on test set 1. The performance of CFAR is relatively poor because of its noise sensitivity.The large amount of speckle noise in SAR images makes the results of CFAR contain too much false alarm and missing alarm. The network structure of Light level CNN is relatively simple, including two convolution layers, two pooling layers and two full connection layers, which leads to 13.19% increase in P,7.04%in R and 0.102 in F_1 score compared with CFAR.But its recognition performance is worse than CFAR,because of the limited high-level semantic information contained in extracted features.Faster RCNN and RCNN+Fast Sliding deepen the network extraction layer and improve the overall performance, especially the recognition rate,but they also miss too many targets,resulting in unsatisfactory performance.SSD reduces the missing alarm and improves the recognition rate compared with the former two, but the detection results are still unsatisfactory due to the lower P value. With the maximum sliding, multilayer fusion, and the integrating shadow context,the proposed method increases by 16.78%in A, 20.02% in P,13.5% in R and 0.169 in F_1 score compared with CFAR. Our model has the lowest FN and FP and the best four evaluation metrics. The comparison experiments show that the proposed model achieves the best performance both in recognition and detection.
As can be seen from Table 8, the performance trend of the six methods on test set 2 is similar to that on test set 1, further demonstrating the above analysis. In addition, by comparing the detection results of the various methods on test set 1 and test set 2,we can see that the recognition rate does not fluctuate greatly with the improvement of the scene complexity, indicating that the change of background does not affect the target structure. On the other hand,with the increase of interference signals in the test set,P, R and F_1 of CFAR, Light level CNN and Faster RCNN decrease sharply, while the performance degradations of SSD, RCNN + Fast Sliding and the proposed method are limited.
5. Conclusions
Because of the strong speckle noise and the low signal-to-noise ratio, it is very difficult to achieve target detection in large scene SAR images. Inspired by the tremendous achievements of deep convolutional neural networks in interpretation of visible light images, deep convolutional neural networks are applied to SAR image interpretation,and a novel contextual rotation region-based convolutional neural network with multilayer fusion is proposed to achieve target detection and recognition in large scene SAR images,which employs maximum sliding strategy to segment large scene image before RCNN, adopts multilayer fusion strategy to obtain feature maps with high resolution and rich semantic information,and generates high confidence prediction boxes by rotation anchors. Additionally, shaded areas serve as context information to help the detector identify and locate the targets accurately. By comparing several sets of experiments, the validity of multilayer fusion strategy, maximum sliding strategy, rotation anchors, and integrating shadow context strategy is verified. More importantly,the robustness analysis and the comparisons with CFAR,Light level CNN, Faster RCNN, SSD and RCNN + Fast Sliding demonstrate that the proposed method has superior robustness and state-of-the-art detection performance.
Despite the best performance, the superiority of the proposed method is based on network complexity.In the future,optimization algorithms should aim at achieving excellent performance with simple network structure. At the same time, other structures of CNN can also be applied to SAR image interpretation.
Author contributions
Zi-shuo Han:Conceptualization,Methodology,Validation,Data curation, Writing-original draft preparation;Chun-ping Wang:Conceptualization, Validation, Formal analysis, Writing-review and editing, Funding acquisition;Qiang Fu:Software, Validation,Supervision.
Declaration of competing interest
The authors declare no conflict of interest.

- Defence Technology的其它文章
- Analysis of sliding electric contact characteristics in augmented railgun based on the combination of contact resistance and sliding friction coefficient
- Aerodynamics analysis of a hypersonic electromagnetic gun launched projectile
- Synergistic effect of hybrid Himalayan Nettle/Bauhinia-vahlii fibers on physico-mechanical and sliding wear properties of epoxy composites
- Study on dynamic response of multi-degree-of-freedom explosion vessel system under impact load
- An investigation on anti-impact and penetration performance of basalt fiber composites with different weave and lay-up modes
- Modeling and simulation of muzzle flow field of railgun with metal vapor and arc