
Effect of Intermolecular Interaction on Stability of Asphaltene–Hydrogen Donor System
2022-02-01 04:02SunYudongLiMaolinLiuZiyuanXiaoShengyu
中国炼油与石油化工 2022年4期
Sun Yudong; Li Maolin; Liu Ziyuan; Xiao Shengyu
(College of Chemical Engineering, China University of Petroleum, Qingdao 266580, China)
Abstract: The stability of three asphaltene–hydrogen donor systems, namely asphaltene–1-methylnaphthalene, asphaltene–tetralin, and asphaltene–decalin, with a mass ratio of 1:10 was investigated using the Turbiscan stability analyzer. The interactions between hydrogen donor molecules and asphaltene units were simulated and calculated using Gaussian and Multiwfn, and then, noncovalent interaction analysis was performed. The results showed that the stability of the three asphaltene–hydrogen donor systems decreased as follows: asphaltene–1-methylnaphthalene > asphaltene–tetralin > asphaltene–decalin. The stability differences among the three systems were due to the different interactions between the hydrogen donor molecules and the asphaltene unit. The T-stacking interaction strength between the hydrogen donor molecules and the asphaltene units decreased as follows: 1-methylnaphthalene–asphaltene unit > tetralin–asphaltene unit > decalin–asphaltene unit. Qualitative analysis indicates that the T-stacking interactions between the hydrogen donor molecules and the asphaltene units were mainly van der Waals forces, and the proportions of hydrogen bonds in the weak interaction differed among the systems.
Key words: asphaltene–hydrogen donor system; stability; interaction; gaussian; NCI analysis
1 Introduction
Heavy oil hydrogenation is limited by the coking of a large amount of asphaltene during the reaction, which can cause catalyst deactivation[1]. The addition of hydrogen donors to the reaction system results in asphaltene dispersion, and active hydrogen is released from the hydrogen donors in the reaction process[2]; hence, coke production is reduced, and the asphaltene conversion rate is enhanced.
The current studies on heavy oil hydrogenation involving hydrogen donors[3-4]could not explain the product distribution of asphaltene hydrogenation. Research on the product distribution of asphaltene hydrogenation involving hydrogen donors has been vital for the in-depth analysis of the internal relationship between the results of the heavy oil hydrogenation. The hydrogenation results can be comprehensively evaluated using the light oil yield and coke deposition data. Research has shown that a certain relationship exists between the stability of the asphaltene–hydrogen donor system and coke deposition during the reaction process[5]. This relationship allows for improving the conversion performance of the heavy oil hydrogenation process, reducing coke deposition according to the stability and influencing factors of the asphaltene–hydrogen donor system, and establishing the relationship between the coke distribution and the stability of the asphaltene hydrogenation reaction system. The Turbiscan stability analyzer can detect changes in the intensities of the transmitted light and backscattered light of asphaltene samples[6]to evaluate the stability of the samples. Gaussian, a powerful comprehensive software package in field of quantum chemical calculations, can calculate the molecular energy and energy of intermolecular interactions. Moreover, Gaussian combined with Multiwfn[7], a software package with comprehensive functions in wave function analysis, can be used to visually analyze the interaction between hydrogen donor molecules and asphaltene molecules.
In this study, the stability of the different asphaltene–hydrogen donor systems was analyzed using the Turbiscan stability analyzer, and then the stability differences of three systems were studied using quantum chemistry software such as Gaussian and Multiwfn at the molecular level.
2 Experimental
2.1 Feedstock
Asphaltene was separated from SZ36-1 vacuum residue according to SH/T 0509-2010[8]. The residue was dissolved inn-heptane (chemically pure, from Sinopharm Chemical Reagent Co., Ltd.) at a volume ratio of 1:50, and then the mixture was heated to reflux for half an hour. The mixture was filtered through low-speed quantitative filter paper (pore size 1–3 μm) after standing for 1 h in the dark. Subsequently, the filtered asphaltene was refluxed withn-heptane and toluene (chemically pure, products from Sinopharm Chemical Reagent Co., Ltd.) in sequence until the reflux liquid was colorless. The asphaltene–toluene solution was distilled and concentrated, dried at 115 °C for 3 h in oven, and the asphaltene (SZASP) was obtained. The asphaltene properties are listed in Table 1.
Table 1 Properties of SZASP
2.2 Experimental Method
Three asphaltene–hydrogen donor (ASP–HD) systems with a mass ratio of 1:10 were used in this study, namely asphaltene – 1-methylnaphthalene (ASP-1-MN), asphaltene–tetralin (ASP-TMN), and asphaltene–decalin (ASP-NAP). The (ASP–HD)-toluene solutions were prepared at a mass ratio of 1:9 and stirred magnetically for 90 min at 200 r/min at room temperature according to ASTM D7061-2012[9]. Then, 2 mL of (ASP–HD)–toluene solution was rapidly mixed with 20 mL ofn-heptane. Subsequently, 20 mL of the mixed solution was transferred into the sample cell and analyzed using the Turbiscan stability analyzer.
The Turbiscan stability analyzer (Formulaction, France), which mainly consists of a transmitted light detector, a backscattered light detector, and a pulsed near-infrared light source (λ = 880 nm), was used to evaluate the stability of solutions. The analysis was conducted at 30 °C. Scanning was conducted for 1 h, with an interval of 1 min. The Turbiscan stability analyzer could obtain the intensity changes in the transmission light or backscattered light of the sample with time, and these data were plotted in one spectrum for comparison. According to the Mie theory, the transmission light intensity of a sample is positively correlated with the particle volume concentration and the average particle size; the backscattered light intensity is positively correlated with the particle volume concentration and negatively correlated with the average particle size[10-11].
The stability parameters of the sample, including theSnumber[12]and the Turbiscan stability index (TSI)[13], can be calculated from the results of Turbiscan stability analysis. The stability of the sample is negatively correlated with theSnumber and the TSI. TheSnumber and TSI are calculated as follows:
wherenis the scanning times;Xidenotes the average value of transmission light intensity (backscattered light intensity) at different heights of the sample cell in a single scan;XTis the average value ofXi;Xi(h) is the transmitted light intensity (backscattered light intensity) at a certain scanning height in a single scan; andHis the maximum measurement height.
2.3 Computational Functional
Gaussian 09A combined with Gaussview5.0 can optimize molecular geometry and calculate the single-point energy of a molecule. The geometries of asphaltene (partial) and hydrogen donors were optimized using the B3LYP/6-31G functional, and the single-point energy of the optimized result was calculated at the B3LYP/6-311G** level. Considering the correction of intermolecular dispersion interactions, the intermolecular interaction energy was calculated using ωB97XD/6-311G**, where ωB97XD is the hybrid functional of dispersion interaction correction. The basis set superposition error was corrected via thecounterpoise method[14].
Noncovalent interaction (NCI) analysis is a visual method for studying weak interactions using the reduced density gradient (RDG) function[15]. The RDG can be used to qualitatively distinguish the different interaction types according to the differences in electron density (ρ) and electron density gradient modulus in the different interaction region. The RDG function is defined as equation (3). The relationship between the RDG value and the interaction region is given in Table 2.

Table 2 Relationship between the RDG value and the interaction region
whereρ(r) is the electron density; |∇ρ(r)| denotes the modulus of the electron density gradient.
The electron density derivative can be used to distinguish between attractive and repulsive interactions, and sign(λ2) is the function of the second largest eigenvalue (λ2) of the Hessian matrix of the electron density (ρ)[16]. Thus, sign(λ2) can be used to distinguish the types of weak interactions. The types and characteristics of the intermolecular weak interactions can be directly shown using colors to represent the different values of this function and map it on the RDG isosurfaces.
3 Results and Discussion
3.1 Stability of asphaltene–hydrogen donor system
During the determination process of transmittance, the ASP–HD system changed from transparent to turbid gradually in the sample cell from top to bottom because the asphaltene continuously aggregated and sank to the bottom over time. The variation curves of the transmitted light intensity to the sample cell height were obtained using the Turbiscan stability analyzer. For comparison, curves corresponding to different times were plotted in one figure. The change in the transmitted light intensity with the sample cell height of the ASP–HD systems with a mass ratio of 1:10 at different times (time interval 1 min) within 1 h is shown in Figure 1. The color change of the curves from blue to red represents different determination times (Figure 1).
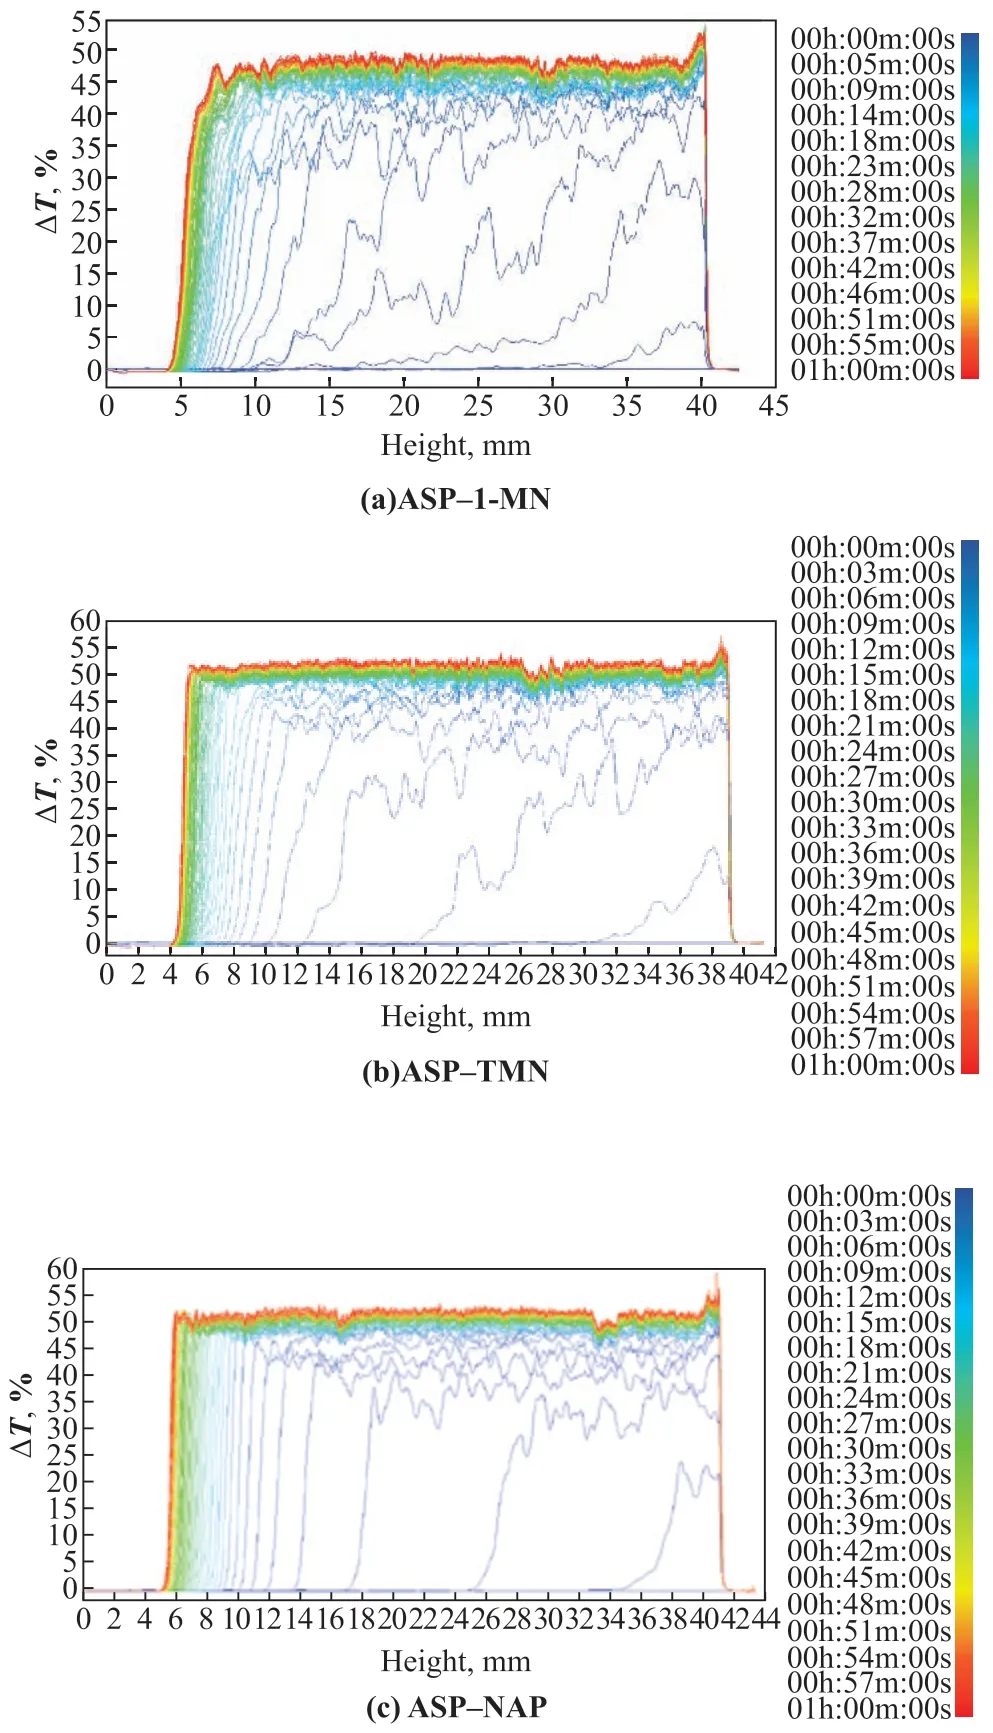
Figure 1 Transmission spectra of ASP–HD solution (ASP:HD =1:10)
The transmitted light intensity curves (Figure 1) were shifted to the left upper side, and the transmitted light intensity of the upper curves increased with time, indicating that the asphaltene in the upper part of the sample cell aggregated and sank to the bottom (Figure 1). Asphaltene sedimentation caused increased light penetration in the upper part of the sample cell, and the transmitted light intensity of the system was significantly increased, which indicates that the system was stratified owing to asphaltene aggregation.
TheSnumber and TSI characterized the stability of the solution. They can be calculated according to the determination results from Turbiscan stability analysis. The larger the TSI andSnumber, the lower the system stability. TheSnumber and TSI of the ASP–HD system are shown in Figure 2. Among the three systems, ASP-1-MN was the most stable, and ASP-TMN was more stable than ASP–NAP.
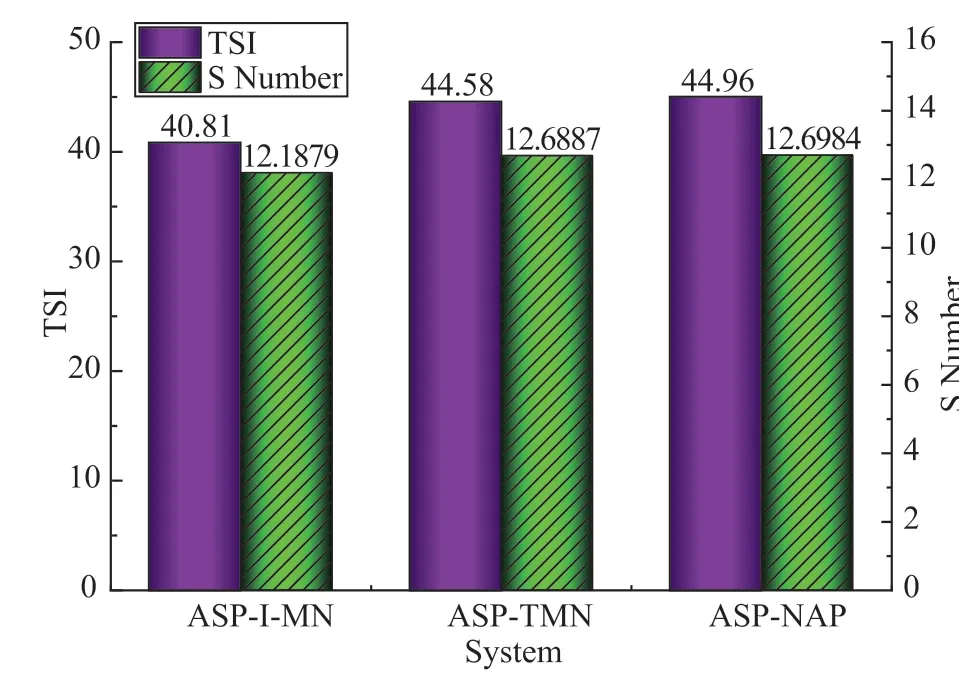
Figure 2 The TSI and S number of the ASP–HD system
3.2 Intermolecular interaction between hydrogen donor and asphaltene
The π–π interaction and asphaltene aggregation were mainly due to the polycondensation of the aromatic asphaltene structure by enriched conjugate π-electron clouds[17]. In this study, the three hydrogen donors mainly differed in their aromatic ring number; therefore, the π–π interaction between the hydrogen donor and the asphaltene unit is expected to be different. The T-shaped configuration, one of the π–π interaction configurations, comprises a weak conjugation between the electrondeficient hydrogen atom on an aromatic skeleton and the π electron cloud on the other aromatic rings. For example, among the ASP–HD systems with a T-shaped configuration, 1-methylnaphthalene could form two C-H…π hydrogen-bonded structures with the asphaltene unit, but tetralin only formed one C-H…π hydrogenbonded structure, and decalin could not form a C-H…π hydrogen-bonded structure with the asphaltene unit. Thus, the number of the C-H…π hydrogen bonds between asphaltene and the hydrogen donor was related to the number of aromatic rings in the hydrogen donor molecules. Similarly, 1-methylnaphthalene molecules could form stronger intermolecular interactions with asphaltene and easily combined with the asphaltene units to form steric hindrance, which reduced the probability of contact among the asphaltene units in a solvent, so that asphaltene aggregation was more difficult, and the ASP–HD system more stable. Compared with 1-methylnaphthalene, the tetralin molecules did not easily combine with the asphaltene units, so that ASPTMN exhibited slightly lower stability than ASP-1-MN. Similarly, ASP-NAP exhibited the lowest stability.
3.2.1 Interaction energy between asphaltene unit (partial) and hydrogen donor
In the calculation of interaction energy, the asphaltene unit was replaced with a coronene molecule to reduce computational complexity. The structure of the asphaltene unit and the interaction regions between the hydrogen donor molecule and the asphaltene unit were considered in the calculations. The single-point energy values after the geometric optimization of the molecular model are listed in Table 3.
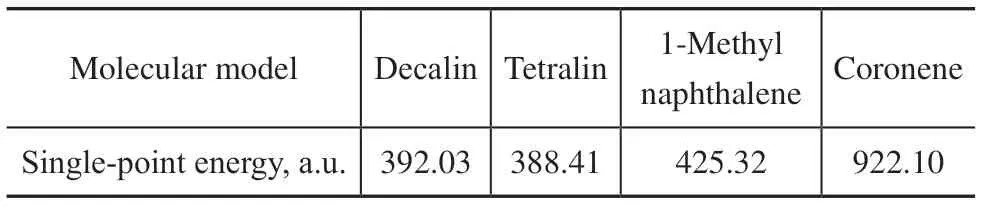
Table 3 Single-point energy of molecular model
Arunan and Gutowsky[18]reported that the ring center distance of a P-benzene dimer with a T -shaped configuration was 4.96 Å, as determined using a rotational spectrum. In the present study, the ring center distance of the ASP–HD complex with a T-shaped configuration was 4.96 Å (Figure 3). The calculated interaction energy values of the ASP–HD systems with a T-shaped configuration are listed in Table 4.The interaction energies of the three ASP–HD complexes with a T-shaped configuration decreased as follows: ASP-1-MN > ASP-TMN > ASP-NAP (Table 4). Therefore, compared with tetralin and decalin, 1-methylnaphthalene molecules could more easily combine with the asphaltene molecules, and the ASP-1-MN system was the most stable. These results are consistent with the previous conclusions.
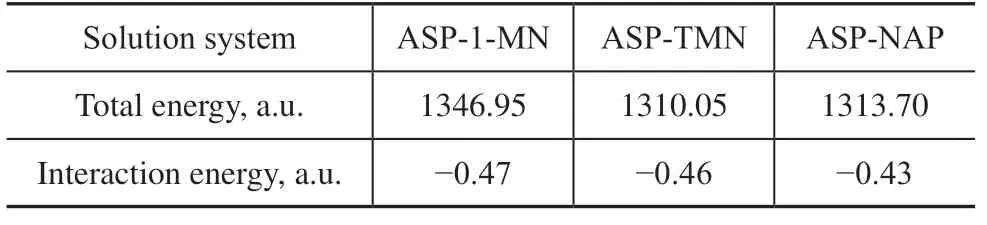
Table 4 Interaction energy of asphaltene unit (partial)-hydrogen donor molecule
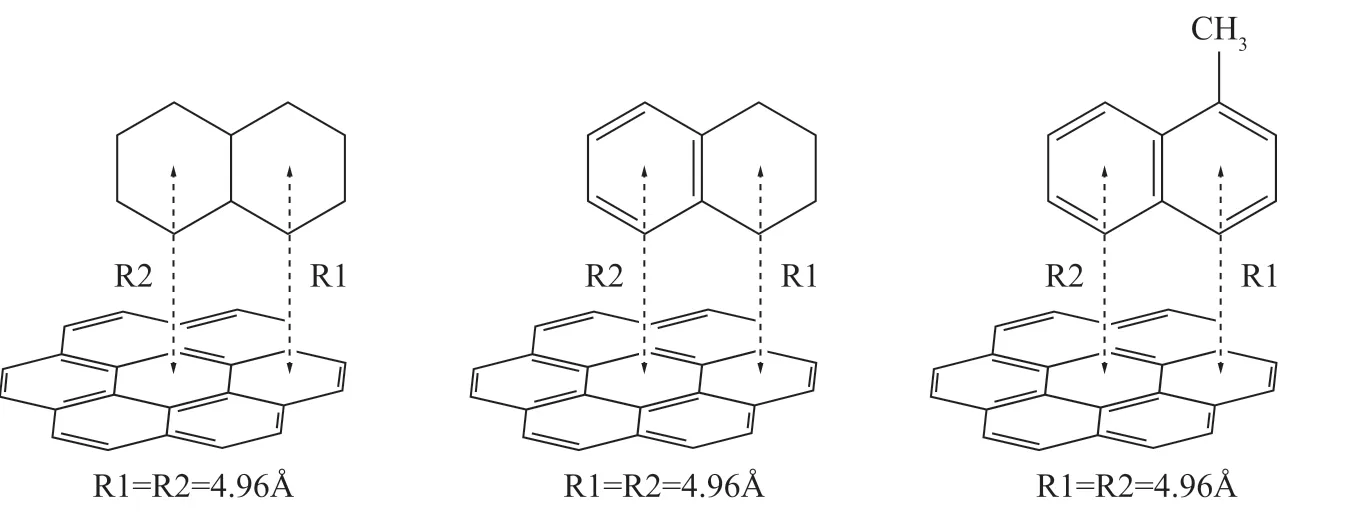
Figure 3 T-shaped configuration of ASP–HD complex
3.2.2 NCI analysis of T-shaped configuration of ASP–HD system
The types of weak interactions of the ASP–HD systems with a T-shaped configuration were distinguished according to the results of the Gaussian calculations combined with NCI analysis using the Multiwfn program[7], which can visually analyze the weak intermolecular interaction using different colors.
The RDG function of NCI analysis can graphically reveal the regions with weak interactions, and sign (λ2) can be used to further distinguish between attractive and repulsive weak interactions. Therefore, the types of weak interactions can be distinguished according to the relationship between the RDG function and sign (λ2)ρ. The chromatic isosurface diagram and the scatter diagram of sign(λ2)ρversus RDG can show the different interaction regions using different colors. Figure 4 shows the standard coloring method of the interaction on the RDG isosurfaces[16].
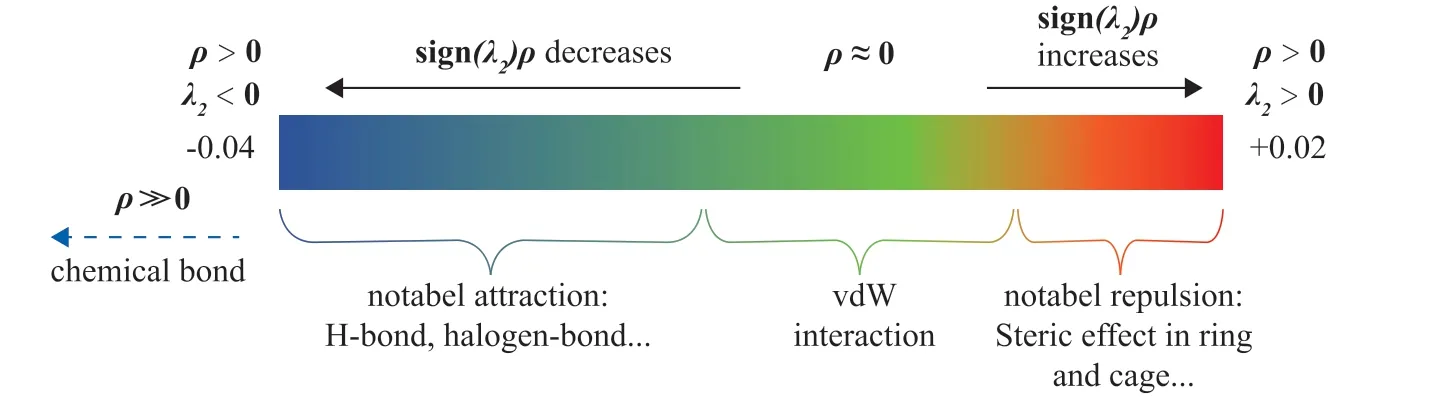
Figure 4 Standard coloring method of interaction
Figure 5 shows the colored scatter diagrams of sign (λ2)ρversus the RDGs for the asphaltene (partial)–1-methyl naphthalene, asphaltene (partial)–tetralin, and asphaltene (partial)–decalin complexes with a T-shaped configuration.
The sharp peaks near the region of sign (λ2)ρ= 0 indicate the presence of weak interactions between the 1-methylnaphthalene molecule and the asphaltene unit. These interactions were dominated by van der Waals forces, consistent with the characteristics of T-stacking (Figure 5a). Weak dispersive hydrogen bonds also occurred in the ASP-1-MN complex. The sharp peaks near the region of sign(λ2)ρ= 0 did not fully reach the bottom of the scatter diagrams owing to the absence of atom-in-molecule critical points[16]in the weak-interaction region (Figure 5b and Figure 5c), but weak interactions also probably existed between the asphaltene unit and the tetralin and decalin molecules.
Figure 6 shows the color-filled plane maps of the RDGs for the asphaltene unit (partial)–1-methyl naphthalene, asphaltene unit(partial)–tetralin, and asphaltene unit (partial)–decalin complexes with a T-shaped configuration.
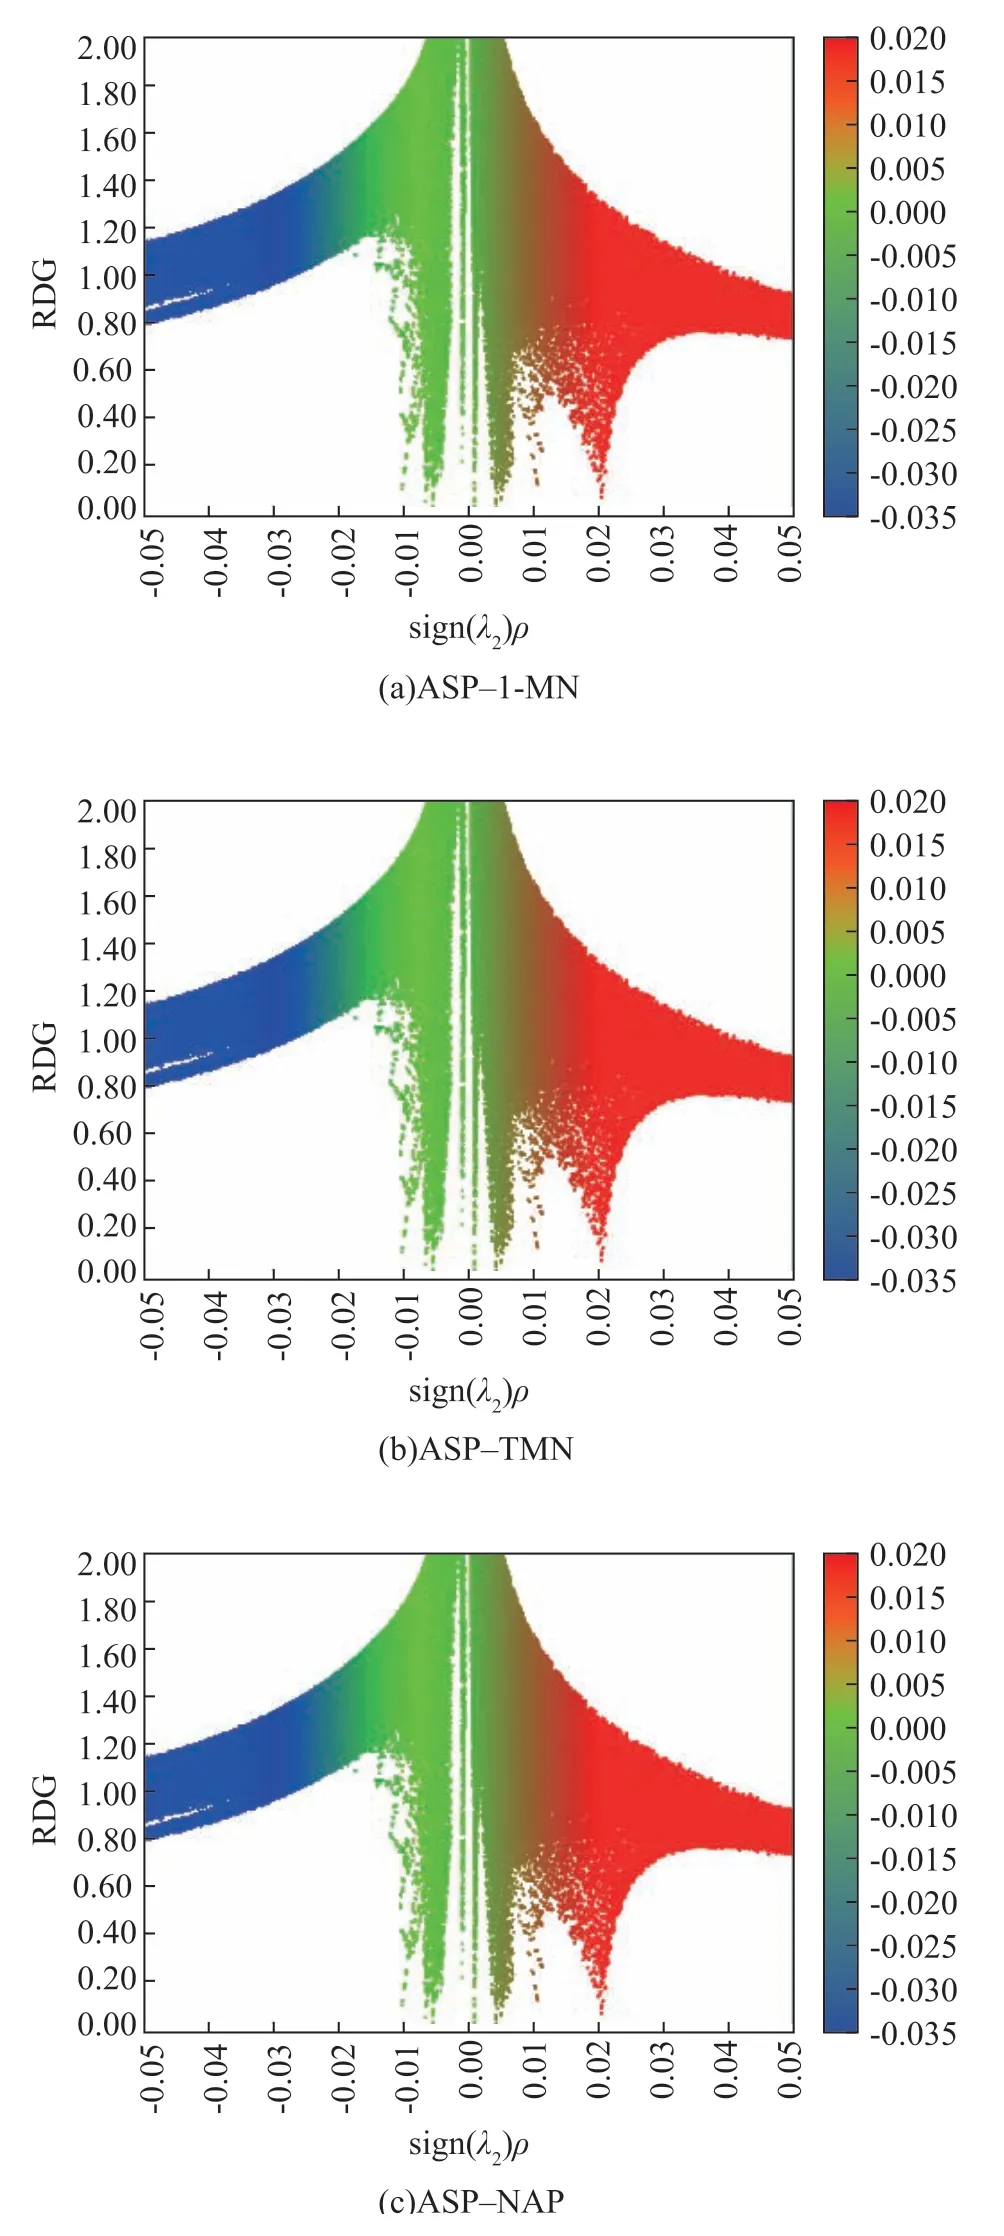
Figure 5 Scatter diagrams for RDG analysis
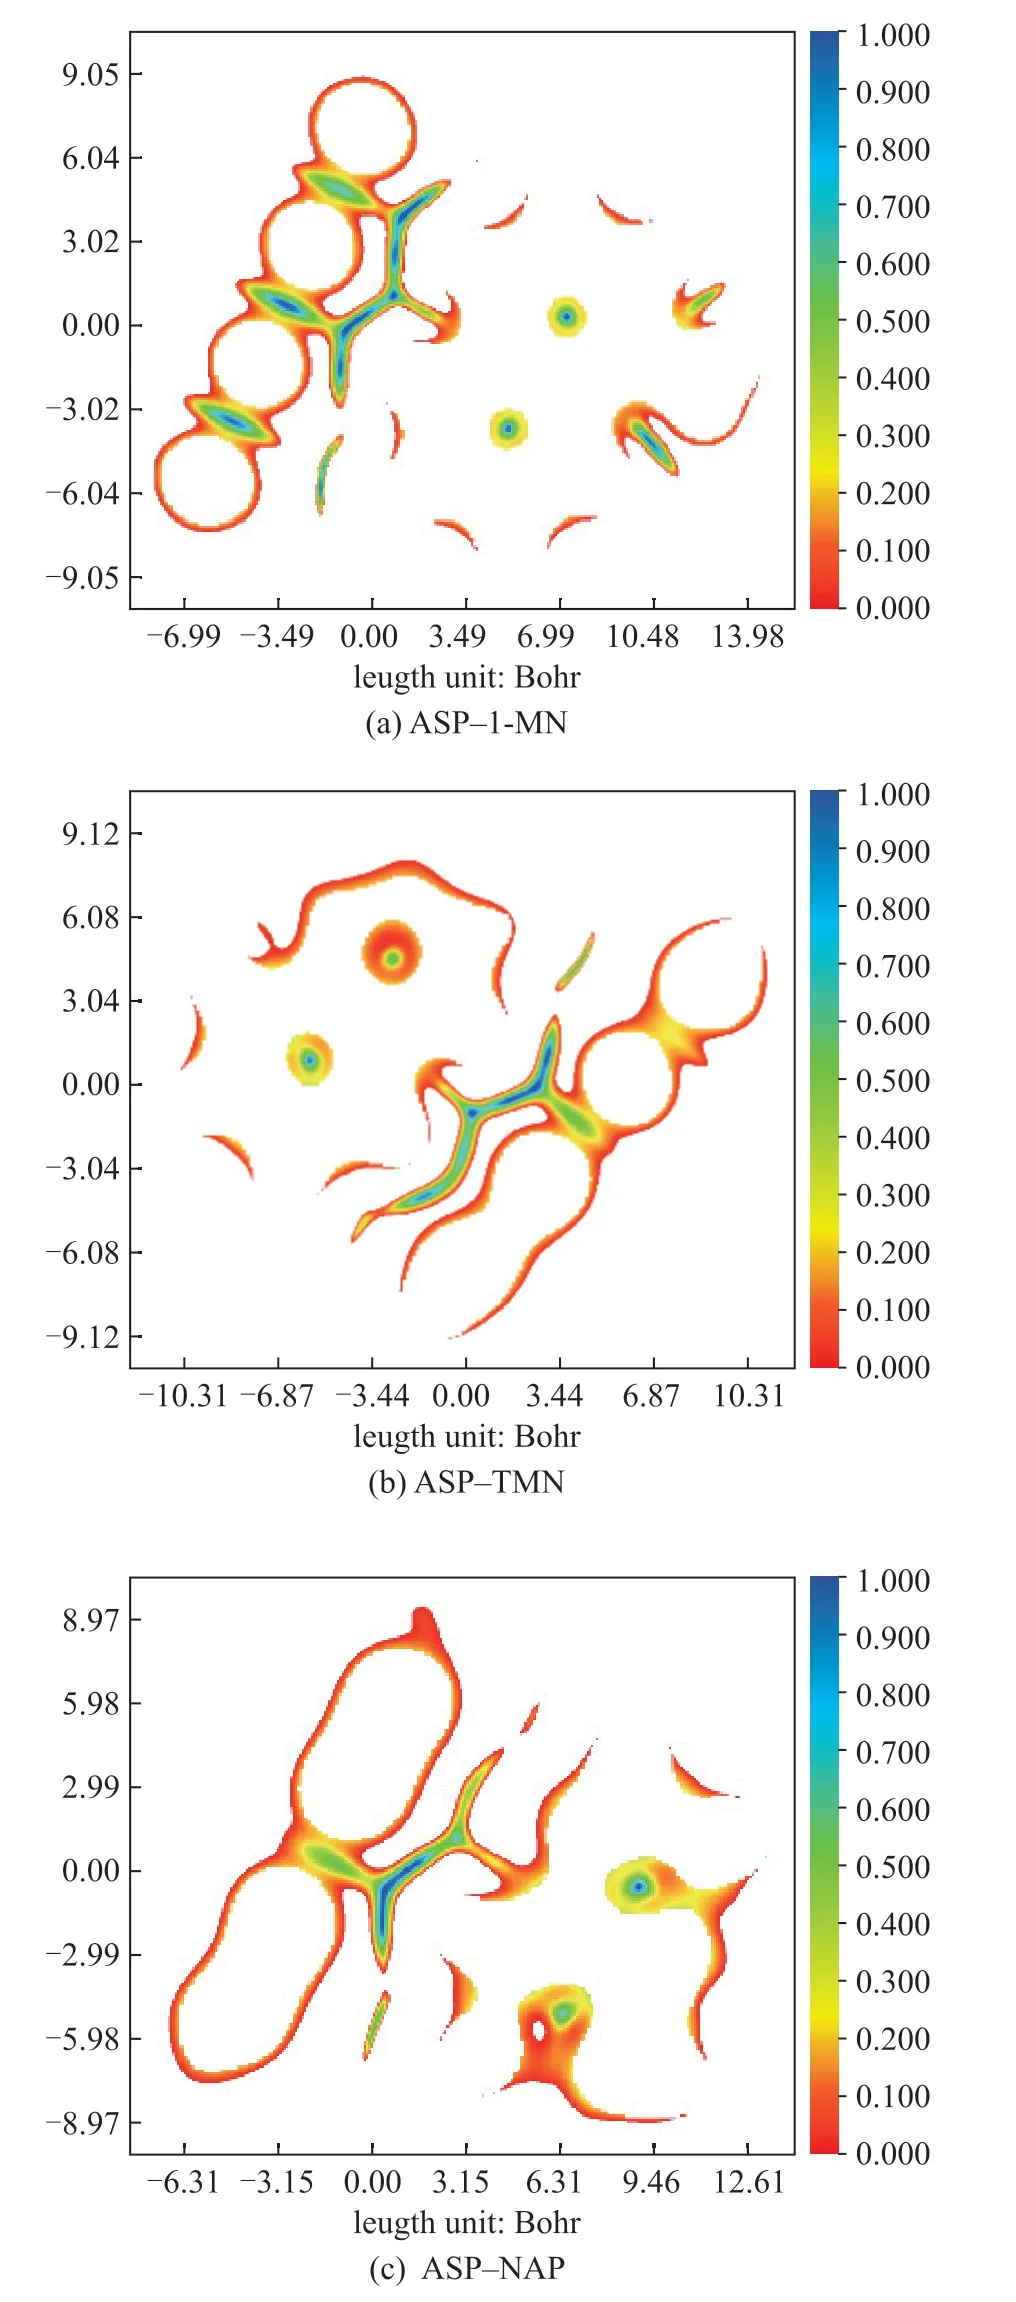
Figure 6 Color-filled plane maps of RDG
The regions of weak interactions close to the plane existed between the 1-methylnaphthalene molecules and the asphaltene units (Figure 6a). The hydrogens connected to the C4, C5 of 1-methylnaphthalene were opposite to the center of the two aromatic rings in the asphaltene unit, resulting in a region color change from blue to green, which indicates that both hydrogen bonds and van der Waals interactions existed in this region. This is consistent with the characteristics of T-stacking. Figure 6(b) shows a region of weak interaction close to the plane existing between tetralin molecules and the asphaltene units. The difference between Figure 6(b) and Figure 6(a) was the interaction region between hydrogen on the C5 of the tetralin molecules and the aromatic ring center of the asphaltene units. The electron deficiency of hydrogen on the C5 of the tetralin molecule was relatively small, and the hydrogen bond between the tetralin and the asphaltene units was weaker owing to the aromatic ring conjugation effect. Therefore, the proportion of the hydrogen bond interaction (the blue region) in this region was significantly lower. Owing to the high density of the π electrons on the central aromatic ring of the asphaltene unit (coronene molecule), weak hydrogen bonds existed between the central aromatic rings and the hydrogen atom of decalin opposite to the central aromatic ring (Figure 6c). However, no conjugation effect occurred owing to the aromatic ring absence in the decalin molecule, which endowed the hydrogen atom of the decalin molecule with electron-deficient properties. No hydrogen bond (the blue region) occurred between the outer aromatic ring center of the asphaltene unit and the hydrogen atom of the decalin molecule opposite to the outer aromatic ring center.
Figure 7 shows the molecular interaction diagrams obtained through NCI analysis for the asphaltene unit (partial)–1-methyl naphthalene, asphaltene unit (partial)–tetralin, and asphaltene unit (partial)–decalin complexes with a T-shaped configuration.
The interactions between the hydrogen donor molecules and the asphaltene units with T-stacking were mainly van der Waals forces (Figure 7). The interaction region between the 1-methyl naphthalene molecule and the asphaltene unit was dominated by the green region and had less red transition region, indicating that the weak interactions were dominated by van der Waals interactions and that asphaltene aggregation was impeded by steric hindrance. Owing to the weak interactions between the central aromatic rings of the asphaltene units and the two hydrogen atoms on the saturated ring of the tetralin molecule opposite the asphaltene unit, the corresponding RDG isosurface exhibited discontinuous small cavities. The decalin molecule, which had the most hydrogen atoms and was not a planar structure (chair conformation or boat conformation), could not form a typical T-shaped configuration with the asphaltene units; therefore, only multiple, small, and fragmented weak interactions existed in this region.
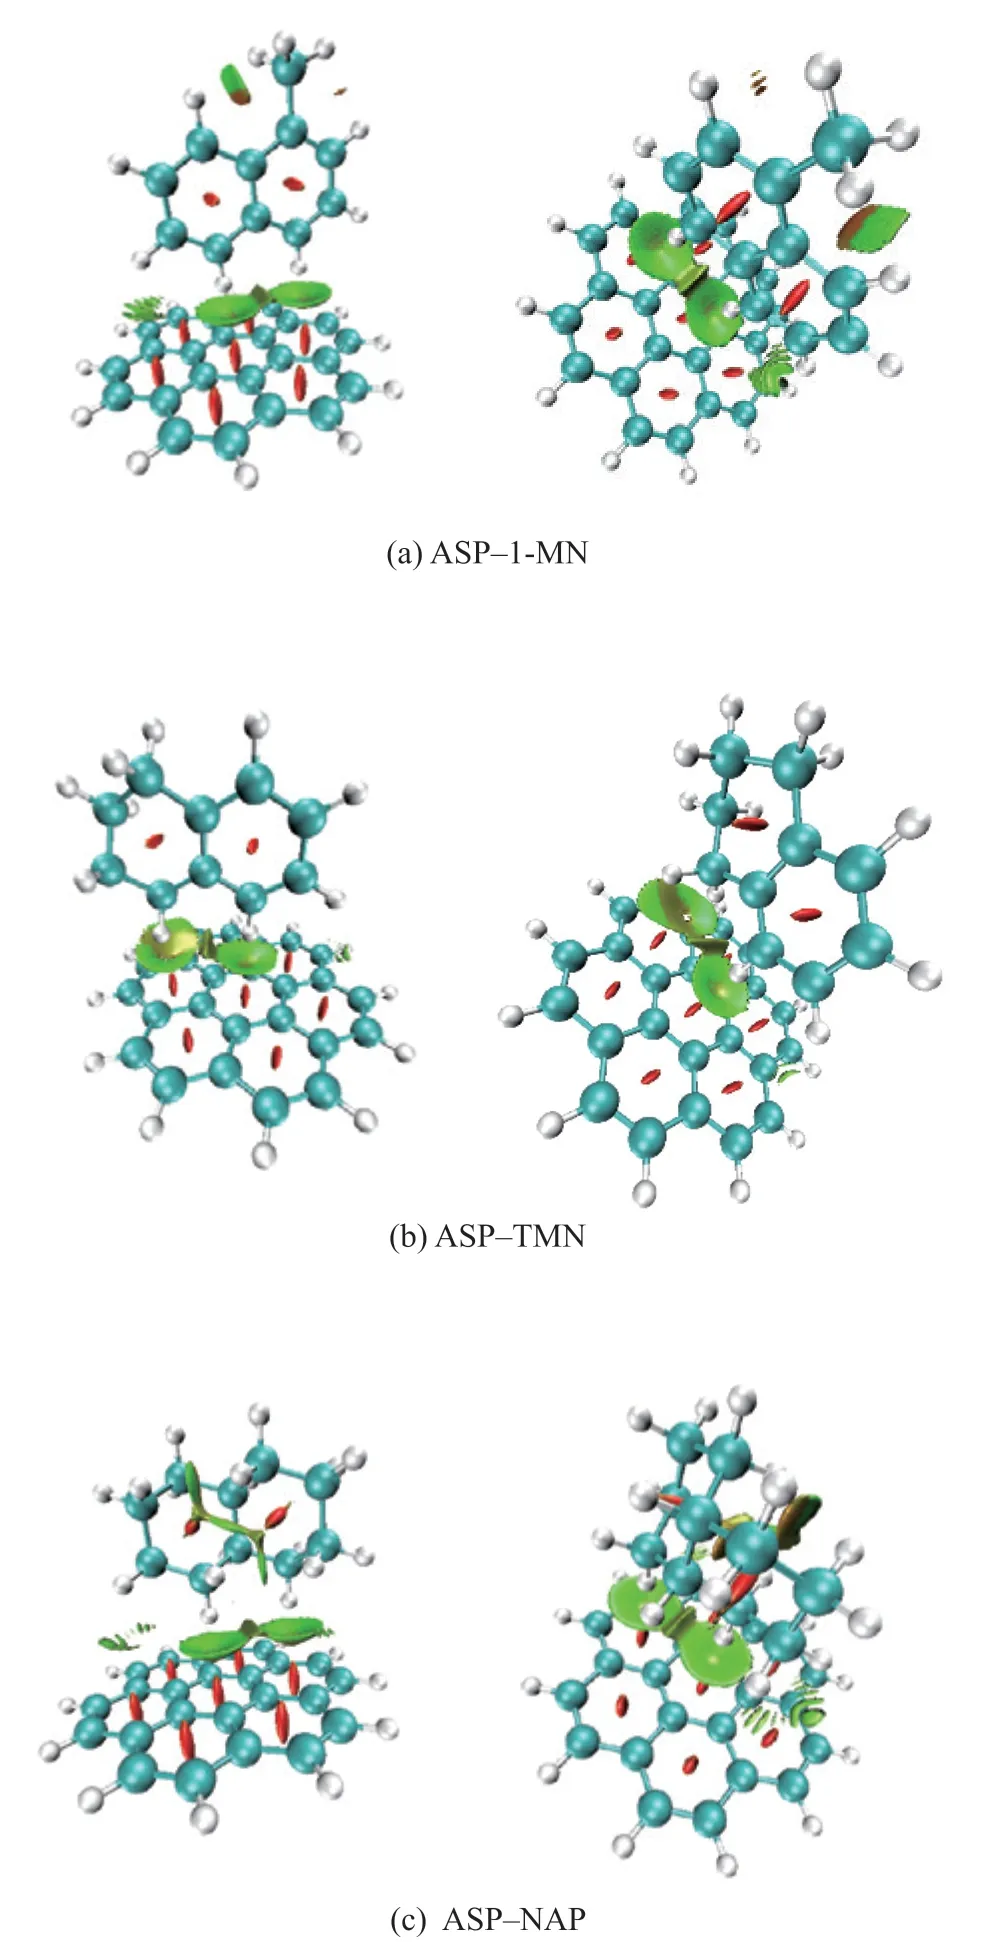
Figure 7 Molecular interaction diagrams of ASP–HD complexes
4 Conclusions
According to the results of Turbiscan stability analysis, the stability sequence of the three ASP–HD systems with a mass ratio of 1:10 decreased as follows: ASP–1-MN > ASP–TMN > ASP–NAP. The differences in the stabilities of the three systems were mainly due to the different interactions between the hydrogen donor molecules and the asphaltene units, which resulted in different collision probabilities among the asphaltene molecules.
The interaction energies of the three ASP–HD complexes with a T-shaped configuration decreased in the following order: ASP–1-MN > ASP–TMN > ASP–NAP. NCI analysis revealed that weak interactions dominated by van der Waals forces existed between the asphaltene unit and the three hydrogen donors, but the proportions of the hydrogen bonds in the weak interactions were different. The proportions of the hydrogen bonds in the weak interaction decreased in the following order: ASP–1-MN > ASP–TMN > ASP–NAP. The results of simulated calculation and NCI analysis verified the results of the stability difference of the ASP–HD systems.
- 中国炼油与石油化工的其它文章
- Synthesis and Evaluation of Microporous Metal Organic Frameworks for Light Hydrocarbon Adsorption
- Selection of Extraction Solvents for Bitumen from Indonesian Oil Sands through Solubility Parameters
- Synthesis of Hierarchical Porous Fe2O3/Al2O3 Materials and Study on Catalytic Viscosity Reduction of Heavy Oil
- Activated Carbon from Rice Husk with One-Step KOH Mechanical Mixing Activation as Adsorbent for Treating Phenolic Wastewater
- Effect of Particle Shape on Catalyst Deactivation during 2-Butene and Isobutane Alkylation of Liquid Phase in Fixed-Bed Reactor Using Particle-Resolved CFD Simulation
- Experimental and Numerical Investigation on Erosion Corrosion of the Air Cooler Tube Bundle in a Residue Hydrotreating Unit