
Activated Carbon from Rice Husk with One-Step KOH Mechanical Mixing Activation as Adsorbent for Treating Phenolic Wastewater
2022-02-01 04:05JiangBolongJiangNanShiShunjieCuiYanyan
中国炼油与石油化工 2022年4期
Jiang Bolong; Jiang Nan; Shi Shunjie,2; Cui Yanyan,2
(1. Innovation Institute for Sustainable Maritime Architecture Research and Technology, Qingdao University of Technology, Qingdao 266000, Shandong, China; 2. Institute of Environmental and Municipal Engineering, Qingdao University of Technology, Qingdao 266000, Shandong, China)
Abstract: This study investigates how large-surface-area biocarbons with high phenolic adsorption capacities can be obtained from cheap and abundant rice husk (RH). The RH is directly mixed with potassium hydroxide (KOH) and activated in a flowing N2 atmosphere, and the effects of the pyrolysis temperature and KOH to RH ratio on the structure of the obtained activated carbon adsorbents and their adsorption of p-nitrophenol and phenol are studied. The results show that the optimum pyrolysis temperature of RH is 750 °C, whereby the highest surface area of 2047 m2/g and best adsorption performance are obtained with a KOH to RH ratio of 3:1. Moreover, the obtained biocarbons achieve a maximum adsorption capacity of 175 mg/g for phenol and 430 mg/g for p-nitrophenol, which are higher than most previously reported data.
Key words: Rice husk; activated carbon; KOH activation; wastewater treatment; p-nitrophenol; phenol
1 Introduction
Phenolic compounds, which are highly toxic to human beings and the environment, are widely present in the dye, coking, pharmaceutical, gas, and petrochemical industries[1-3]. These compounds are internationally recognized as priority pollutants in water because of their high toxicity, even at low concentrations, and their stable structures, which are resistant to degradation[4]. Therefore, efficient treatment of phenolic wastewater is an urgent and challenging problem[5-6].
Many types of adsorbents, including activated carbon (AC), polymer materials (resin), and siliceous materials (clay, zeolite), have been investigated for the removal of phenolic compounds from wastewater[5]. Among these, AC has received considerable attention because of its relatively high surface area, well-developed porous structure, and variable surface chemistry[7-9]. AC has been widely used to adsorb pollutants such as CO2[10], metal ions including Cu(II)[11]and Pb(II)[12], non-biodegradable pharmaceuticals[13], and ammonia compounds[14]. ACs are synthesized from various carbon-rich precursors by physical or chemical activation. The chemical activation method is commonly used because it enables a tunable porosity and surface chemistry[15].
Among the chemical activating agents used to obtain ACs, KOH is a promising agent because it can easily produce highly microporous ACs. Kong et al.[27]have synthesized biocarbon from toona sinensis leaves activated by NaOH. They reported an adsorption capacity of 325 mg/g for a phenol solution with a concentration of 800 mg/L, with the adsorption mainly occurring through π-π dispersion interaction. Mistar et al.[28]have synthesized biocarbon from Bambusa Bulgaris striata activated by KOH. The AC produced with a ratio of char to KOH of 1:3 and a treating temperature of 800 °C has a high specific surface area of 980 m2/g. The abovementioned results show that the adsorptive performance of carbon material can be significantly improved by KOH activation.
Oginni et al.[29]compared the effects of one-step KOH activation and two-step KOH activation applied to Kanlow Switchgrass (KS) and Public Miscanthus (PM). These biomass precursors and their biochars were produced at a carbonization temperature of 500ºC before being impregnated with KOH and activated at a temperature of 900ºC for 30 min. The AC obtained using one-step KOH activation possessed the higher surface areas (1272 m2/g for KS and 1597 m2/g for PM), and exhibited better adsorption of acetaminophen and caffeine than the materials obtained using twostep KOH activation. These results indicate that the KOH activation method and temperature significantly affect the structure of the obtained ACs. Note that both one-step and two-step KOH activation involve the impregnation of the biomass precursors and their biochars with KOH and soaking at a certain temperature, followed by filtering and drying, which are time- and energy-consuming processes. In contrast, KOH activation methods that use mechanical mixing are simple, have lower time and energy costs, and do not produce waste liquid. However, the one-step mechanical KOH activation of biomass for treating refractory phenolic wastewater is still limited.
The availability of precursors is a major bottleneck of AC production. The RH obtained from agricultural waste is an inorganic–organic composite that is readily available at low cost[30]. Therefore, activated biocarbon produced from RH represents a potential candidate for porous carbon owing to its high porosity and large surface area[31]. This study considers the direct mixing of KOH with RH in a one-step KOH mechanical mixing activation method, and investigates the effects of the treating temperature and KOH to RH ratio on the structure of the obtained biocarbons and their adsorption ofp-nitrophenol and phenol.
2 Experimental
2.1 Materials
The RH used as a raw material was obtained from Inner Mongolia, China. Phenol (C6H5OH),p-nitrophenol (C6H5NO3), and KOH were purchased from Shi Jixing Corporation, Qingdao, Shandong, China. All chemicals used in this study were analytical grade.
2.2 Synthesis of ACs
The RH was activated by a very simple one-step mechanical mixing KOH activation method. The RH was washed three times with deionized water and dried at 80 °C overnight. The dried RH was then pyrolyzed at different temperatures (650 °C, 750 °C, 850 °C, and 950 °C) in an N2atmosphere to determine the optimal pyrolysis temperature for producing biocarbon. The resulting biocarbons are denoted as AC-T-0, where T is the pyrolysis temperature in °C and 0 indicates carbonization without KOH activation.
To investigate the one-step mechanical mixing method, the influence of the amount of KOH on the structure of the obtained biocarbons and their adsorption performance was studied. Different amounts of KOH were mixed with RH and treated at 750 °C for 2 h in an N2atmosphere (see Scheme 1(b)). The biocarbons prepared from KOH to RH mass ratios (x) of 1:1, 2:1, 3:1, and 4:1 are denoted as AC-750-1, AC-750-2, AC-750-3, and AC-750-4, respectively, and collectively referred to as AC-750-x.
Not a breath of wind moved, not a leaf stirred, all was silent as the grave, only on the still bosom of the lake thirty ducks, with brilliant plumage, swam about in the water
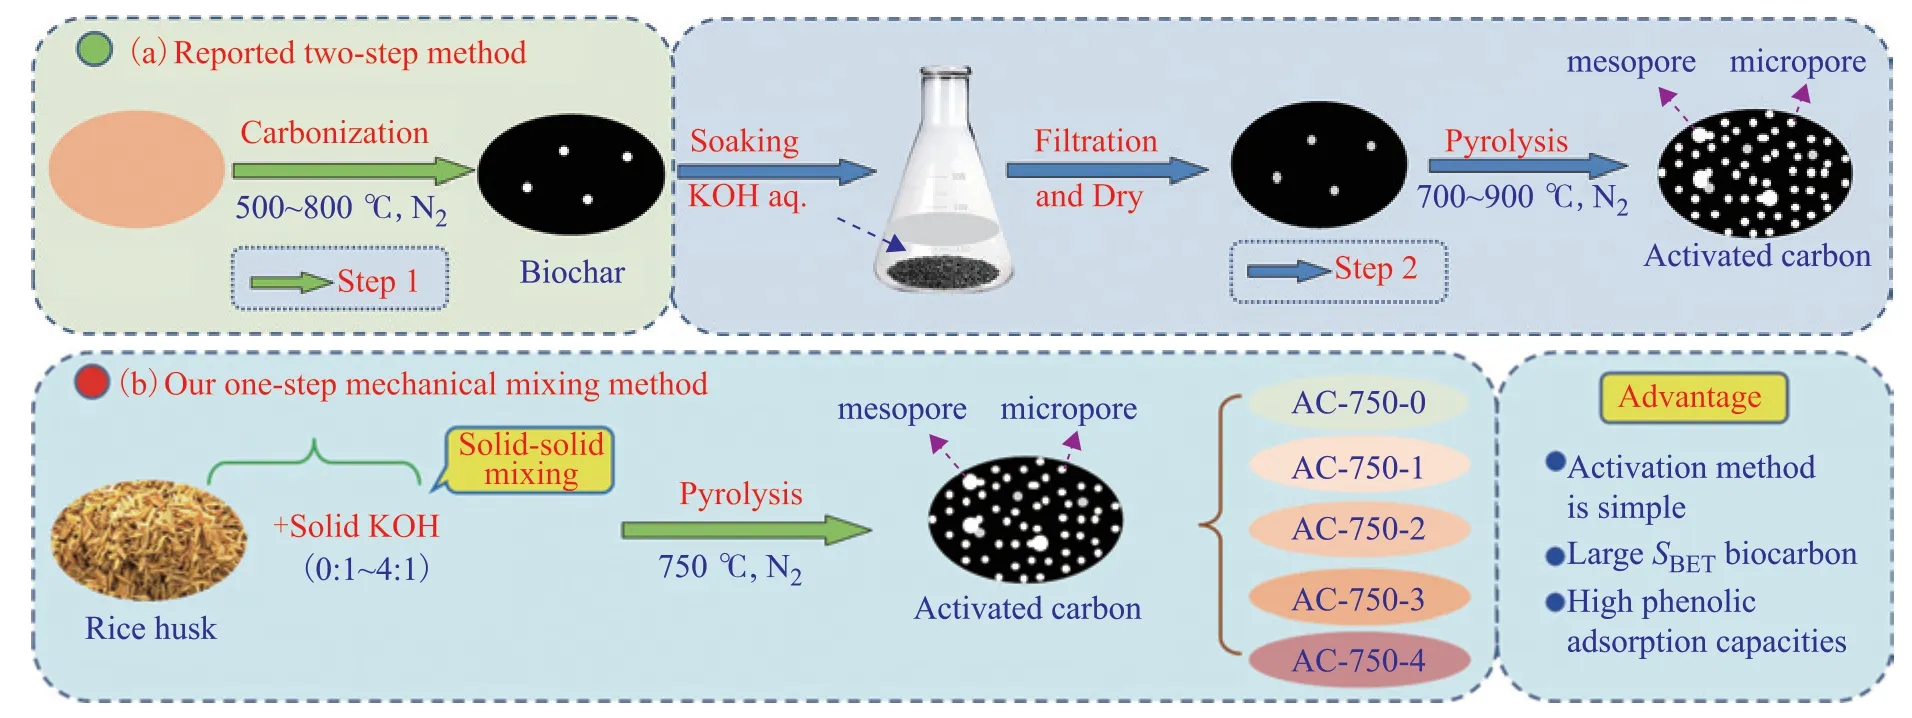
Scheme 1 Reported two-step biomass activation method (a) and our one-step mixing method for RH activation (b)
2.3 Characterization
Thermogravimetric analysis (TGA) was performed using a NETZSCH TG 209F3 instrument. The sample was placed in a ceramic crucible and heated with a ramp rate of 10 °C/min in N2.
The surface morphological details of the adsorbents were examined by scanning electron microscopy (SEM, JSM-5600LV). Transmission electron microscopy (TEM) images were obtained from an HT770TEM instrument at 100 kV. X-ray photoelectron spectroscopy (XPS) was used to obtain spectra of the adsorbents via monochromatic Mg Kα radiation (E=1253.6 eV) with a hemispherical analyzer operating at a fixed pass energy of 40 eV using an ESCALAB MKII spectrometer. The recorded photoelectron binding energies were referenced against the C1s contamination line at 284.8 eV. The Fourier transform infrared (FTIR) spectra of the catalysts were recorded with a Brook Tensor 27 Fu Liye infrared spectrometer in the optical range of 400–4000 cm−1. The typical physicochemical properties of the supports and catalysts were analyzed by N2-adsorption specific surface area measurements using the Brunauer–Emmett–Teller method (BET, Micromeritics, NOVA 2000e: Surface Area & Pore Size Analyzer).
2.4 Adsorption test
Typically, 0.05 g of as-prepared biocarbon was added to 30 mL ofp-nitrophenol or phenol solution (200 mg/L) and agitated at room temperature (approximately 25°C) for a certain time. The resulting suspension was filtered to separate the adsorbent from the phenolic solution. The filtered phenolic solution was tested by a UV-visible spectrophotometer (UV-6000T) at a certain wavelength (317 nm forp-nitrophenol and 271 nm for phenol) to determine its concentration. Each experiment was repeated at least three times, and the average values were calculated. The removal rateR(%) was calculated as

The adsorption capacityqt(mg/L) and the equilibrium adsorption capacityqe(mg/L) were calculated as
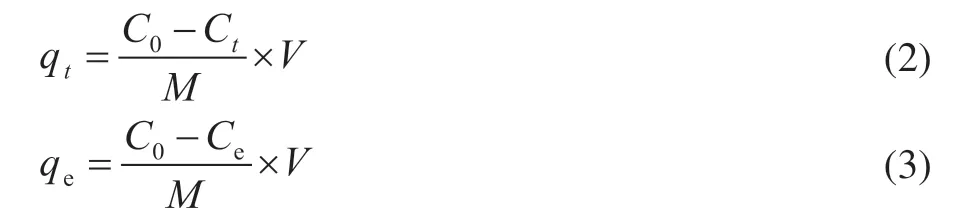
whereC0is the initial concentration of adsorbate (mg/L),Ctis the concentration at time pointt, andCeis the equilibrium concentration of adsorbate (mg/L).Mdenotes the total mass of adsorbent added to the adsorption solution (g) andVis the total volume of the adsorption solution (L).
3 Results and Discussion
3.1 Morphologies of AC samples
Figure 1 shows the SEM results of RH and AC-750-x. The morphology of RH has a very regular structure, characterized by a series of large “vascular bundle structures” (Figure 1a)[32-33]. There are few pores on the surface of RH. The morphology of AC-750-0 (without KOH activation) exhibits some pores on the surface (Figure 1b). However, as the KOH amount increases, more pores appear on the surface (Figs. 1c, 1d), which is in line with the BET results. When the ratio of KOH to RH reaches 3:1, a honeycomb structure with a relatively uniform pore structure appears (Figure 1e), showing that the pore structure is very developed. This is possibly because the KOH to RH ratio of 3:1 enables sufficient contact between the KOH and carbon, producing the optimum pore-generating ability. This is consistent with the BET results. However, when the ratio of KOH to RH increases further to 4:1, the honeycomb structure is destroyed to some extent, and the BET results show a decrease in surface area. The energy-dispersive X-ray spectroscopy (EDS) results in Figs. 1(g)–1(i) illustrate the effective removal of SiO2by KOH activation. The potassium content increases with the KOH to RH ratio because of the addition of KOH.
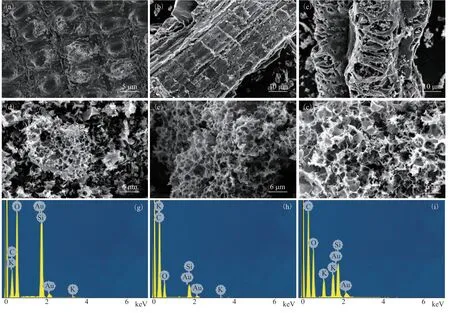
Figure 1 SEM results of RH (a), AC-750-0 (b), AC-750-1 (c), AC-750-2 (d), AC-750-3 (e), AC-750-4 (f); EDS results of RH (g), AC-750-0 (h), and AC-750-3 (i)
3.2 Structure characterization of AC samples
3.2.1 TG
To determine the pyrolysis temperature, the RH used to prepare the adsorbents was tested by TGA/DTGA; the corresponding results are shown in Figure 2. The TG curve of RH shows three weight loss zones in the ranges 30–210 °C, 210–615 °C, and 615–743 °C, respectively. Yang et al.[34]reported that the decomposition of hemicellulose and cellulose mainly happened at 220–315 °C and 315–400 °C, while the decomposition of lignin occurred in the range from ambient temperature to 900 °C. The first weight loss zone shows a weight loss of 5.0%, which can be ascribed to the evaporation of water and adsorbed water in the cell structure of RH[35]. The second zone exhibits a rapid and large weight loss of 41.0%, which is mainly caused by the decomposition of volatiles such as hemicellulose and cellulose components including small amounts of lignin. The DTG curve shows three significant peaks at 268, 351, and 371 °C, respectively. The former corresponds to the decomposition of hemicellulose, while the latter two can be attributed to the decomposition of cellulose. The third zone, which shows a rapid and large weight loss of 37.6%, indicates the decomposition of lignin and the formation of carbon structures at high temperature[24]. The DTG curve shows three significant peaks corresponding to lignin at 647, 708, and 732 °C, respectively. It is worth noting that no significant weight loss occurs at temperatures above 743 °C. Thus, the optimal pyrolysis temperature for RH might be around 743 °C.
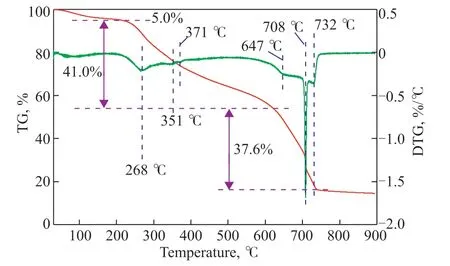
Figure 2 TGA/DTGA results for RH.
3.2.2 BET
The N2adsorption isotherms and textural properties of the AC-750-xadsorbents are shown in Figure 3 and Table 1. According to a recent International Union of Pure and Applied Chemistry (IUPAC) technical report[36], the isotherms of AC-750-xadsorbents are mainly type I with an H4 hysteresis loop of type IV. This shows that these adsorbents are microporous materials with a certain amount of mesopores[37]. As the KOH to RH ratio increases, the adsorption amount increases rapidly under low pressure (p/p0<0.1) owing to the increased adsorbent–adsorptive interactions in the micropores, which reflects the increase in micropores. The adsorption amount of AC-750-3 reaches a value of ~750 cm3/g, which is the highest among the tested adsorbents. A further increase in the KOH to RH ratio decreases the adsorption amount somewhat. Similar trends can be observed for the specific surface area (SBET). TheSBETvalue of AC-750-0 is only 259.3 m2/g with a low pore volumeVpof 0.19 cm3/g. After activation with KOH, theSBETvalue increases and reaches a maximum of 2047 m2/g with a KOH to RH ratio of 3:1, an increase of 6.9 times compared with AC-750-0 (without KOH activation). The increase inSBETis accompanied by a significant increase inVpto 1.17 cm3/g. However, when the ratio of KOH to RH reaches 4:1, theSBETvalue decreases to 1748.3 m2/g owing to over-activation. Similar results were obtained by Wu et al[38]. During the activation process, the KOH reacts with carbon according to the following stoichiometric reaction[39]:
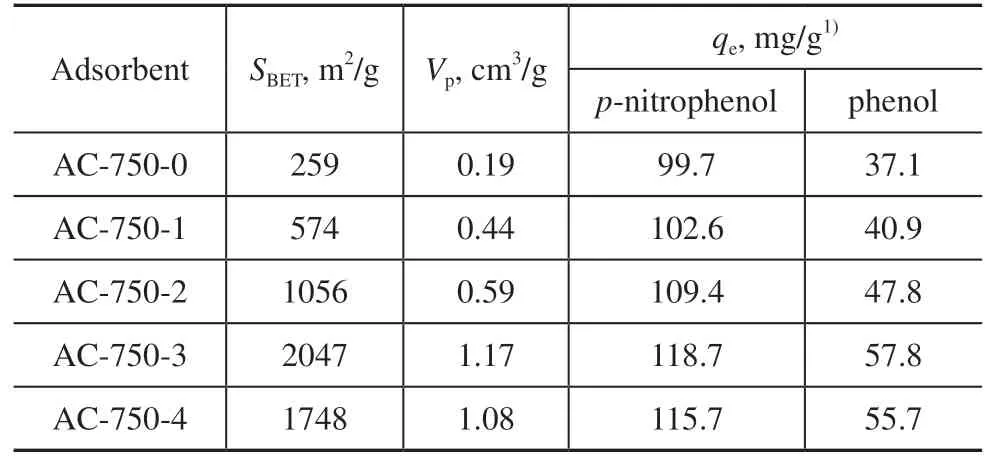
Table 1 BET data and adsorption properties of AC-750-x adsorbents
and the formed K2CO3starts to decompose into CO2and K2O at 700°C through the following reactions:
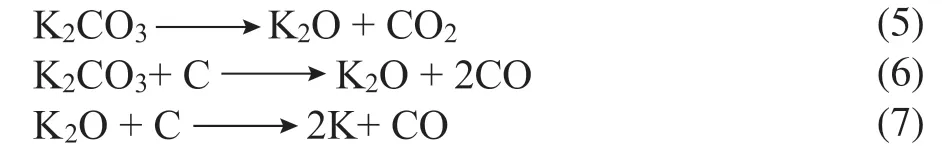
The formation of high microporosity and surface area can be attributed to the production of H2and CO2gases during high-temperature treatment. A higher KOH to RH ratio releases more H2and CO2gases. Therefore, the SBETvalue increases with increasing KOH amount, while the formation rate of micropores is greater than the disappearance rate via the above reaction, and the highestSBETis attained with a moderate KOH to RH ratio[40]. An excessive KOH to RH ratio leads to a decrease inSBETowing to the destruction of micropores through over-widening and overdevelopment. Additionally, the EDS analysis shows that the silica content of RH is high, which will affect the pore structure. Liu et al.[41]studied the effect of silica on the pore structure during KOH activation of RH. They found that the SiO2in RH preferentially reacts with KOH to produce silicate, which covers carbon and hinders the enlargement of pores.

Therefore, the SiO2in RH promotes the generation of micropores, which contributes to the increase in surface area[42]. The Si content of AC-750-xdecreases with increasing KOH and reaches 0.34% for AC-750-3, indicating that more SiO2is converted to silicate. This leads to the generation of more micropores, as confirmed by the increase in surface area with increasing KOH.
3.2.3 FTIR
The FTIR spectra were examined to study the functional group and chemical bonds of AC-750-xadsorbents. Figure 4 shows that the most remarkable broad peaks at 3600–3000 cm−1can be ascribed to O–H stretching vibrations of hydroxyl groups[43]. The peaks at 3050–2700 cm−1can be ascribed to C–Hnstretching vibrations, which come from aromatic –CH, aliphatic –CH2, and alkanes –CH3. The peak at 1619 cm−1comes from the stretching vibration of a C=C benzene ring skeleton, mainly from aromatics[44]. The remarkable peak at 1091 cm−1can be attributed to the C−O stretching peak[45,25]. The intensity of this peak is significantly weakened and slightly redshifted after KOH activation, demonstrating that KOH activation decreases oxygen-containing compounds by decomposing some organic matter in RH. The peak at 1404 cm-1, which increases with the KOH to RH ratio, can be attributed to the K–O stretching vibration of K2O. Peaks appear at 800 and 467 cm-1for AC-750-0, which can be attributed to the asymmetric stretching vibration of Si−O−Si, showing that there is a certain amount of SiO2in AC-750-0[46]. However, these two peaks are obviously weakened as the KOH amount increases, indicating the removal of SiO2with increasing KOH to RH ratio[32,47].
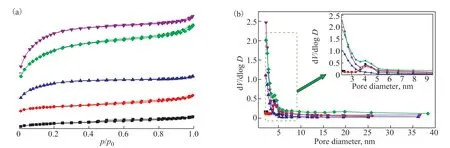
Figure 3 N2 adsorption–desorption isotherm (a) and BJH pore size distribution (b) of AC-750-x adsorbents.
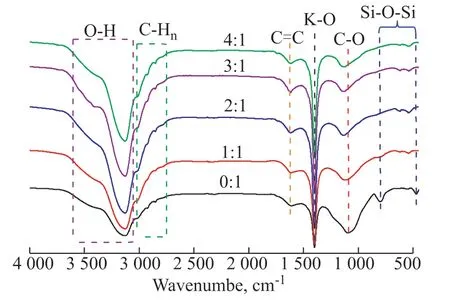
Figure 4 FTIR spectra of AC-750-x adsorbents
3.2.4 XPS
The surface functional groups of AC-750-0 and AC-750-3 were analyzed by XPS (see Figure 5). Figure 5(a) shows that the spectra of C1s is deconvolved into CI–CIV: graphitic carbon (C–C/C=C, 284.6 eV), carbon bonded with an oxygen atom in phenol, alcohol and ether (C–O, 285.8 eV), and carbon in carbonyl groups (C=O, 287.0 eV)[48]. The AC-750-0 adsorbent has a maximum peak for carbonyl groups, accounting for 56.6% of all carbon atoms[31]. On the contrary, AC-750-3 does not exhibit obvious peaks for carbonyl groups, with a maximum peak for graphitic carbon (C–C/C=C) instead. This demonstrates that KOH activation increases the hydrophobic functional group of graphitic carbon, and can therefore suppress the competitive adsorption between phenols and water, which is conducive to the removal of phenols from aqueous solution[42]. A similar phenomenon was observed by Wang et al[48]. For the O1s spectra, five main peaks can be observed in Figure 5(b)[49]. The O1s spectra show that the peak (534.7 eV) of oxygen in carboxyl groups decreases from 69.7% to zero after KOH activation. The oxygen content of AC-750-3 decreases significantly, reflecting the reduction in hydrophilic oxygen-containing groups. This result is in line with the ICP and EDS analysis.
3.3 Adsorption test
With increasing pyrolysis temperature, thep-nitrophenol equilibrium adsorption capacity (qe) and removal rate (R) for AC-T-0 first increased and then decreased, reaching maximum values at a pyrolysis temperature of 750 °C. This confirms that 750 °C is the optimal pyrolysis temperature, in line with the TGA/DTGA results. Theqeand R values of AC-750-xadsorbents with different KOH to RH ratios are shown in Figure 6. The data suggest that the adsorption performance of AC-750-ximproves significantly after activation with KOH. With increasing KOH to RH ratio, the adsorption performance of AC-750-xalso improves. As discussed in section 3.2.2, the AC-750-xsamplesare microporous materials with a certain amount of mesopores. With increasing KOH to RH ratio, more micropores are generated (Figure 3b), which enhances the specific surface area and microporosity (Table 1). Therefore, higher KOH to RH ratios are conducive to the adsorption of organic contaminants. However, when the KOH to RH ratio becomes too high, the adsorption performance decreases owing to the reduced surface area and degradation of the pore structure. The optimal values ofqeandRare achieved at a KOH to RH ratio of 3:1. Theqevalue decreases in the order of AC-750-3 (118.7 mg/g) > AC-750-4 (115.7 mg/g) > AC-750-2 (109.4 mg/g) > AC-750-1 (102.6 mg/g) > AC-750-0 (99.7 mg/g). Compared with AC-750-0 (99.7 mg/g), theqevalue is 19.1% higher in AC-750-3.
We also tested the phenol adsorption capacities of AC-750-xwith different KOH to RH ratios. The results are shown in Figure 7. For AC-750-x, the variations inRandqefor phenol with respect to the KOH to RH ratio exhibit similar trends as forp-nitrophenol, with the optimal values ofqeandRappearing at a KOH to RH ratio of 3:1. However, theRandqevalues for phenol are much lower than those forp-nitrophenol because of the presence of functional –NO2, which is an electron-withdrawing group. The negative-charged ─NO2group may improve the interaction betweenp-nitrophenol and the surface of AC through electrostatic interaction. This will be discussed in section 3.5. According to the data in Figure 7, AC-750-3 hasRandqevalues of 48.2% and 57.8 mg/g, respectively, for phenol.
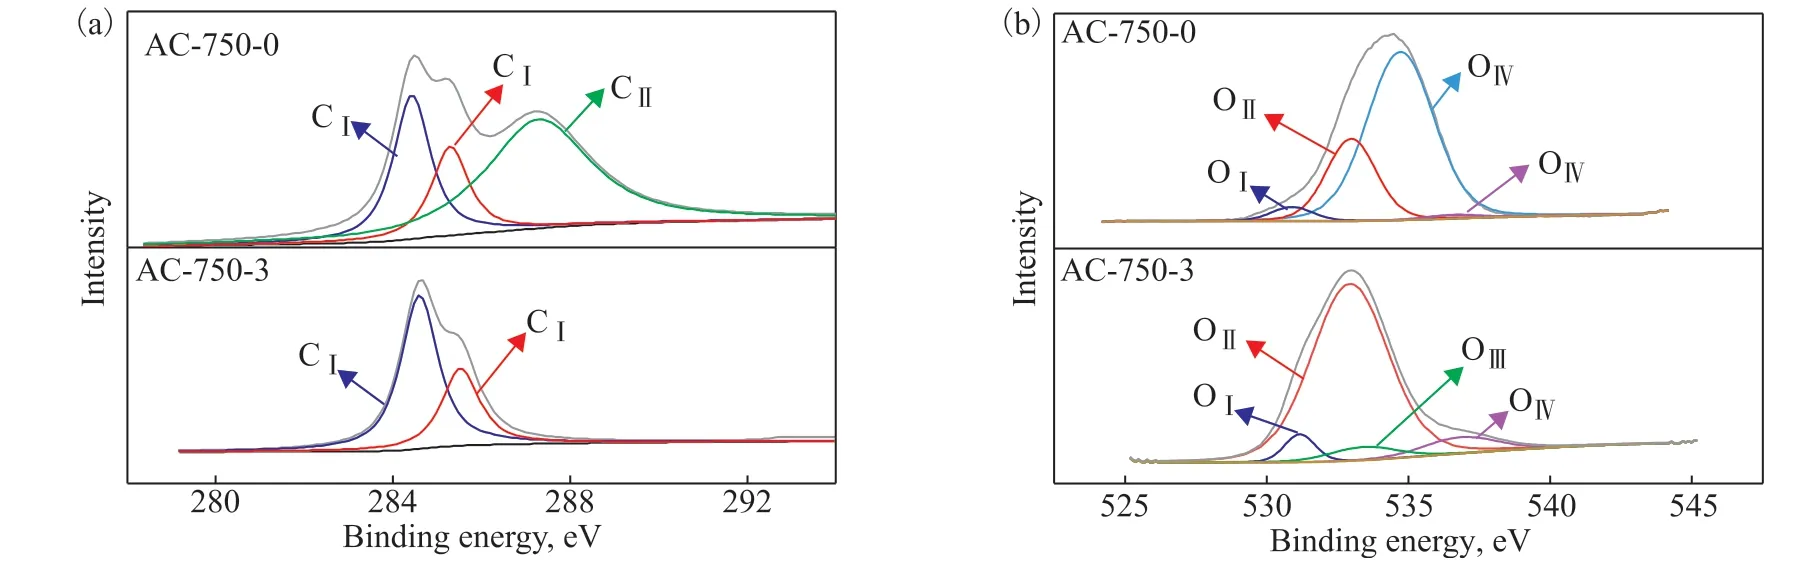
Figure 5 XPS spectra of C1 (a) and O1 (b) peaks for AC-750-0 and AC-750-3 adsorbents.
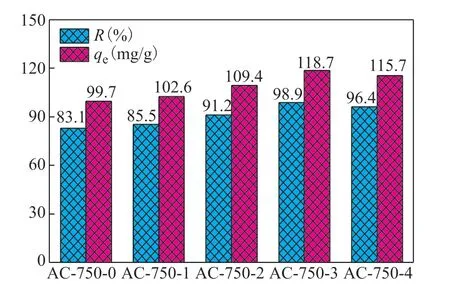
Figure 6 Influence of KOH to RH ratio on the p-nitrophenol adsorption performance of AC-750-x adsorbents (temperature of 25 °C, AC-T-0 dose of 0.05 g, initial p-nitrophenol concentration of 200 mg/L)

Figure 7 Phenol adsorption performance of AC-750-x (temperature of 25 °C, AC-T-0 dose of 0.05 g, initial phenol concentration of 200 mg/L)
3.4 Adsorption kinetics and comparison of pseudofirst- and second-order models
To gain a better understanding of the adsorption process, models of the adsorption kinetics of AC-750-3 were also studied. Pseudo-first-order and pseudo-second-order models are the most frequently used forms of kinetic models. The pseudo-first-order and pseudo-second-order models are given by Eqs. (9) and (10), respectively:

wherek1is the rate constant of the pseudo-first-order model [min-1];k2is the rate constant of the pseudosecond-order model [g/(mg·min)]; andtis the adsorption time. Nonlinear fitting of the pseudo-first-order and pseudo-second-order models was employed for the adsorption ofp-nitrophenol and phenol onto AC-750-3 adsorbent. The corresponding results are shown in Figure 8 and Table 2. According to the data in Table 2, the pseudo-second-order model (R2=0.986 forp-nitrophenol andR2=0.984 for phenol) provides a better correlation than the pseudo-first-order kinetic model (R2=0.972 forp-nitrophenol andR2=0.980 for phenol).
3.5 Adsorption isotherms
The Langmuir model was used to investigate the adsorption isotherm of phenol orp-nitrophenol onto AC-750-3. The Langmuir isothermal model is given by Eq. (11) and the Freundlich isothermal model is given by Eq. (12):
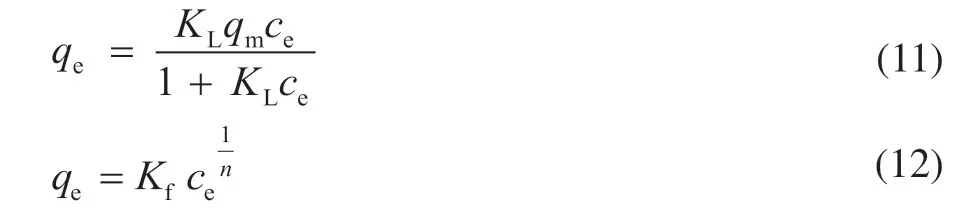
whereqm(mg/g) is the theoretical maximum adsorption capacity;KL(L/mg) is the Langmuir adsorption equilibrium constant;Kf(mg/g) is the Freundlich isotherm constant associated with the adsorption capacity; andnis an empirical parameter associated with adsorption intensity that reflects the strength of the interaction between the adsorbate and adsorbent. The equilibrium isothermal adsorptions of AC-750-3 were studied using phenol orp-nitrophenol solutions with concentrations of 100, 200, 400, 600, and 800 mg/L, respectively. The equilibrium concentration of phenol orp-nitrophenolce(mg/L) and the equilibrium adsorption capacityqe(mg/L) were examined using the Langmuir and Freundlich isotherms. As seen from Figure 9 and Table 3, the Langmuir correlation coefficients (R2) for phenol andp-nitrophenol are both higher than those of the Freundlich isotherm. This shows that the adsorption of phenol andp-nitrophenol onto AC-750-3 in aqueous solution follows the Langmuir isotherm model, which suggests monolayer adsorption characteristics. The maximum adsorption capacities (qm) forp-nitrophenol and phenol obtained from the Langmuir isotherm model are 430 and 175 mg/g, respectively.

Figure 9 Nonlinear fitting to Langmuir adsorption isotherm of p-nitrophenol (a) and phenol (b) onto AC-750-3 at 25 °C.
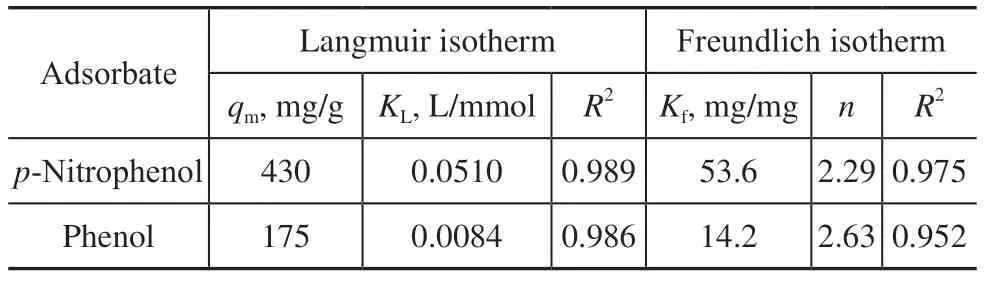
Table 3 Langmuir isotherm model and Freundlich isotherm model parameters for AC-750-3
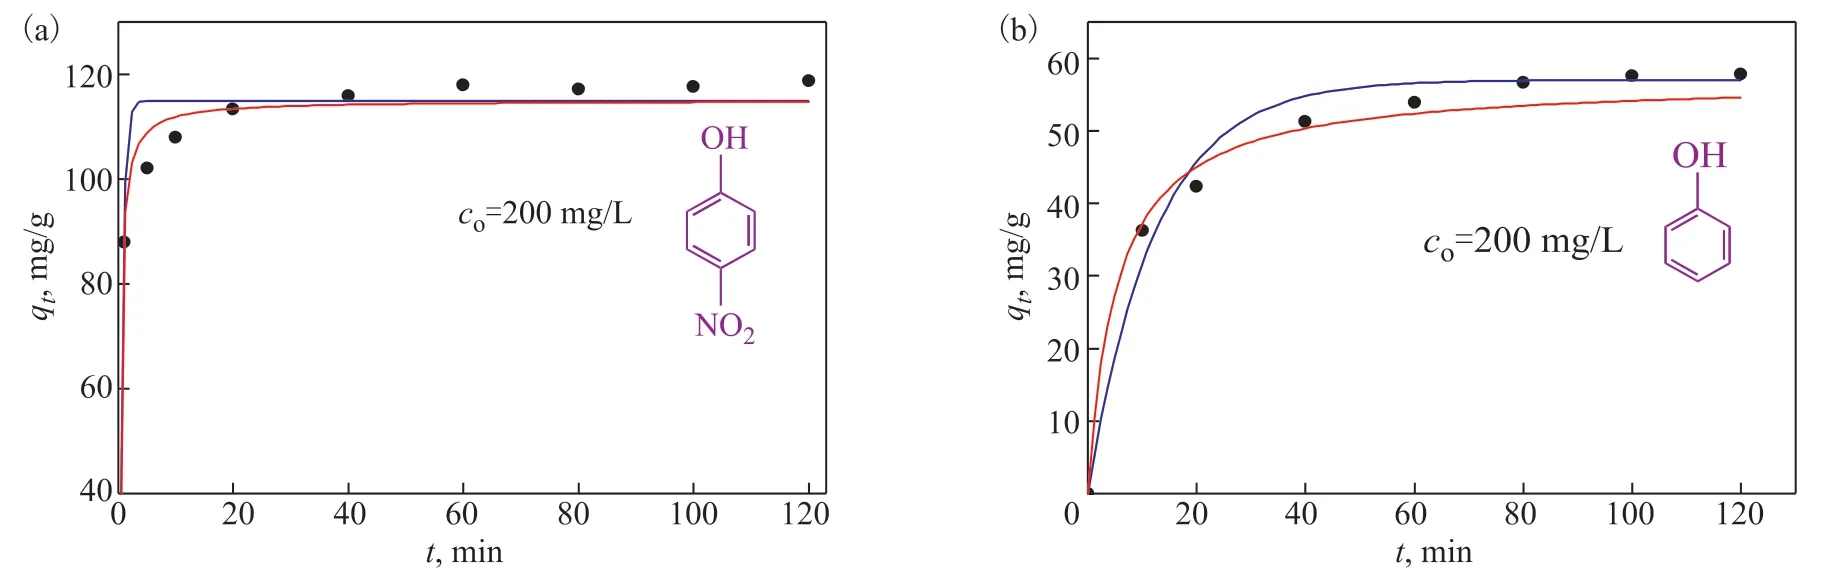
Figure 8 Nonlinear fitting to pseudo-first-order and pseudo-second-order models for adsorption kinetics of p-nitrophenol (a) and phenol (b) onto AC-750-3 at 25°C
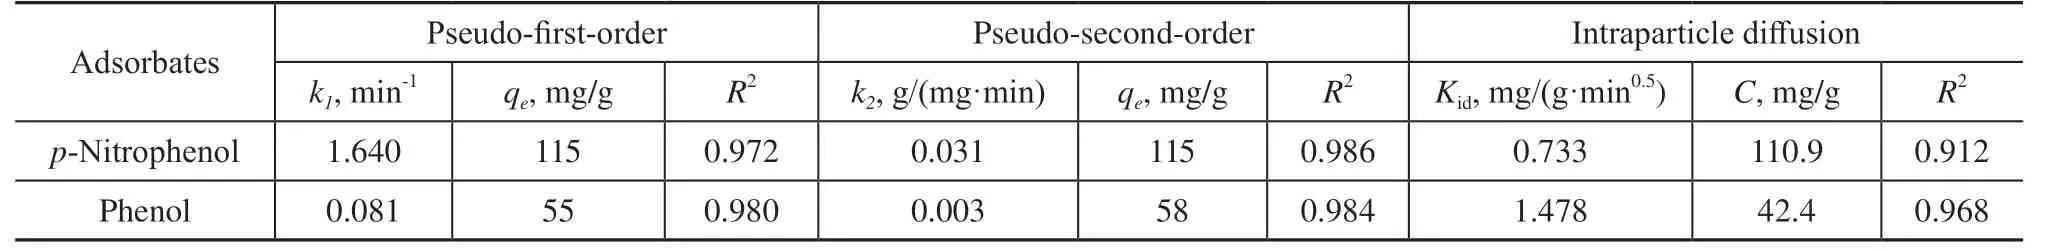
Table 2 Adsorption kinetic and intraparticle diffusion model parameters for AC-750-3
The Langmuir adsorption capacity (qm) of AC-750-3 for phenol andp-nitrophenol is compared with that of other adsorbents (T=20–30 °C) in Table 4. Our AC-750-3 possesses a higher surface area than that produced by the one- or two-step methods.

Table 4 Comparison of phenol and p-nitrophenol adsorption by various AC adsorbents
4 Conclusions
The effect of the pyrolysis temperature (650 °C, 750 °C, 850 °C, and 950 °C) and the KOH to RH ratio (1:1, 2:1, 3:1, and 4:1) on the structure of AC-T-xadsorbents obtained from RH and their adsorption ofp-nitrophenol and phenol were studied. Compared with the qevalue of AC-750-0 (99.7 mg/g), produced without KOH activation, theqevalue forp-nitrophenol of AC-750-3 was found to increase by 19.1%. The maximum adsorption capacities of AC-750-3 were 175 mg/g for phenol and 430 mg/g forp-nitrophenol, which are higher than most previously reported data. A pseudo-second-order model was found to provide a better correlation than a pseudo-first-order model. Furthermore, both the p-nitrophenol and phenol adsorption isotherms match the Langmuir model, indicating that monolayer adsorption behavior is dominant.

- 中国炼油与石油化工的其它文章
- Synthesis and Evaluation of Microporous Metal Organic Frameworks for Light Hydrocarbon Adsorption
- Removal of Basic and Non-Basic Nitrogen Compounds from Model Oil by FeCl3-Based Ionic Liquids
- Selection of Extraction Solvents for Bitumen from Indonesian Oil Sands through Solubility Parameters
- Synthesis of Hierarchical Porous Fe2O3/Al2O3 Materials and Study on Catalytic Viscosity Reduction of Heavy Oil
- Effect of Particle Shape on Catalyst Deactivation during 2-Butene and Isobutane Alkylation of Liquid Phase in Fixed-Bed Reactor Using Particle-Resolved CFD Simulation
- Experimental and Numerical Investigation on Erosion Corrosion of the Air Cooler Tube Bundle in a Residue Hydrotreating Unit