
Experimental and Numerical Investigation on Erosion Corrosion of the Air Cooler Tube Bundle in a Residue Hydrotreating Unit
2022-02-01 04:06JinHaozheYuChenyangGuYoujieQianGuangweiLiuXiaofeiOuGuofuJiaYongna
中国炼油与石油化工 2022年4期
Jin Haozhe; Yu Chenyang; Gu Youjie; Qian Guangwei; Liu Xiaofei; Ou Guofu; Jia Yongna
(1. Institute of Flow-Induced Corrosion, Zhejiang Sci-Tech University, Hangzhou 310018, China;2. Institute of Flow-Induced Corrosion and Intelligent Prevention and Control, Changzhou University, Changzhou 213164, China;3. Intelligent Interconnection Department, Jiangsu Branch of China Academy of Machinery Science and Technology Group Co., Ltd., Changzhou 213164, China)
Abstract: Corrosion leakage occurred in the 14th tube bundle in the first row of a residual oil hydrotreating air cooler after operating for two years. The failure location was 0.5 m from the outlet header box. In this paper, the erosion corrosion of the air cooler tube bundle was investigated by experimental and numerical methods. Visual inspection, scanning electron microscopy(SEM), and X-ray diffraction(XRD) experiments were performed, and the failure morphology and material composition confirmed that the damage was caused by erosion corrosion. The shear stress transport k–ω turbulence model(SST-k–ω) was then used to investigate the flow and erosion corrosion characteristics, combined with mass transfer, corrosion rate, and ionization equilibrium models. The numerical simulation results revealed that the water phase volume fraction increased with flow and heat transfer in the fluid, which increased the mass flow rate and concentration of hydrogen sulfide. The mass transfer coefficient and corrosion rate were proposed as important parameters to characterize erosion corrosion. Moreover, the local concentration of wall shear stress was found to increase the risk of erosion corrosion. The predicted high-risk area was consistent with the actual failure area, which verified that this failure incident was attributable to erosion corrosion by the water phase.
Key words: erosion corrosion; air cooler tube bundle (ACTB); residue; thinning; hydrogen sulfide
1 Introduction
Air coolers are essential heat-exchange systems that are extensively utilized in power plants, oil refineries, and other industrial facilities[1]. In a typical system, the fluid medium in the air cooler exchanges heat with air through finned tubes to decrease its own temperature[2]. In some industrial applications, however, the flow medium inside the air cooler tube bundle (ACTB) is inherently corrosive, which eventually causes failure of the air cooler during the process of flow and heat transfer[3-5]. Hydrocracking technology is an important method for the deep processing of heavy oil, in which inferior crude oil is often used[6-8]. The low quality of the crude oil now being processed has increased the frequency of corrosion failure accidents, which poses a severe risk to the long-term safe operation of petrochemical plants[9]. In particular, residual oil is the most inferior and corrosive grade, which may increase the risk of corrosion of the air coolers in hydrocracking units[10].
Corrosion is a material degradation process that occurs owing to chemical or electrochemical action, while erosion is a process involving mechanical wear[11]. When these two processes occur simultaneously, the combined action of erosion and corrosion in aqueous environments is known as “erosion corrosion”[12]. Previous work examining the generation and aggravation of electrochemical corrosion indicated that the erosion was mainly concentrated in the anode area on the electrode surface and increasing the flow accelerated the erosion corrosion[13]. Moreover, the influence of the hydrodynamic characteristics on the corrosion resistance in the reducer tube was discussed[14]. It was found that the electrochemical corrosion was accelerated by the multiphase flow erosion, and the degree of erosion was continuously increased under their combined action. Furthermore, the simulation software Aspen and computational fluid dynamics(CFD) were applied to study the erosion corrosion failure of an elbow pipe[15]. It was found that the corrosion rate increased rapidly with increasing flow velocity when the concentration of NH4HS reached 10%.
Although numerous works have been conducted to understand the erosion corrosion process and establish damage models, the failure of air coolers in refineries is a common occurrence, and the location and dynamic process of erosion corrosion failure have yet to be thoroughly elucidated. In the present work, the failure location and operational conditions of an air cooler were analyzed. Furthermore, the tube surfaces exhibiting signs of thinning failure were analyzed by scanning electron microscopy (SEM) and X-ray diffraction (XRD). Numerical simulations were also performed to examine the flow and erosion corrosion characteristics in the ACTB. The obtained results revealed the dynamic process of erosion corrosion during multiphase flow in the ACTB.
2 Working Environment and Structure of Air Cooler
2.1 Technical process
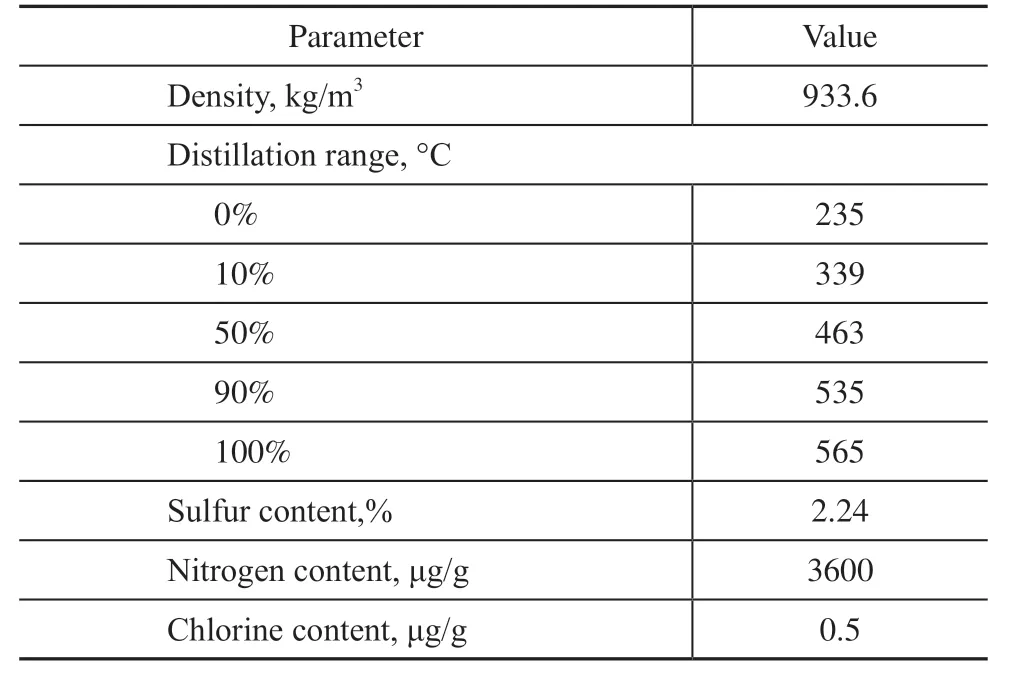
Table 1 Physical properties of the raw residual oil
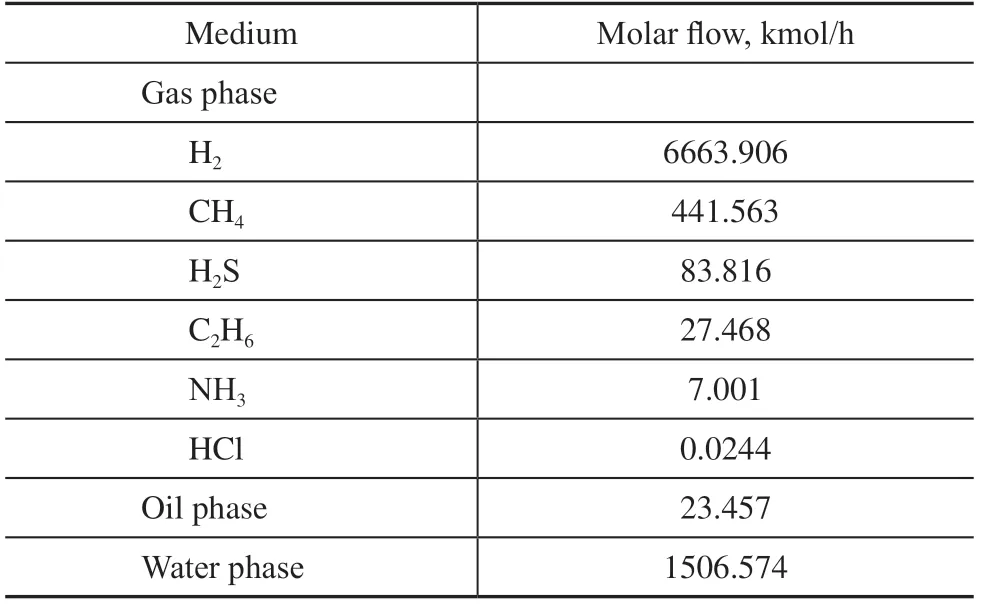
Table 2 Flow medium composition at the air cooler inlet
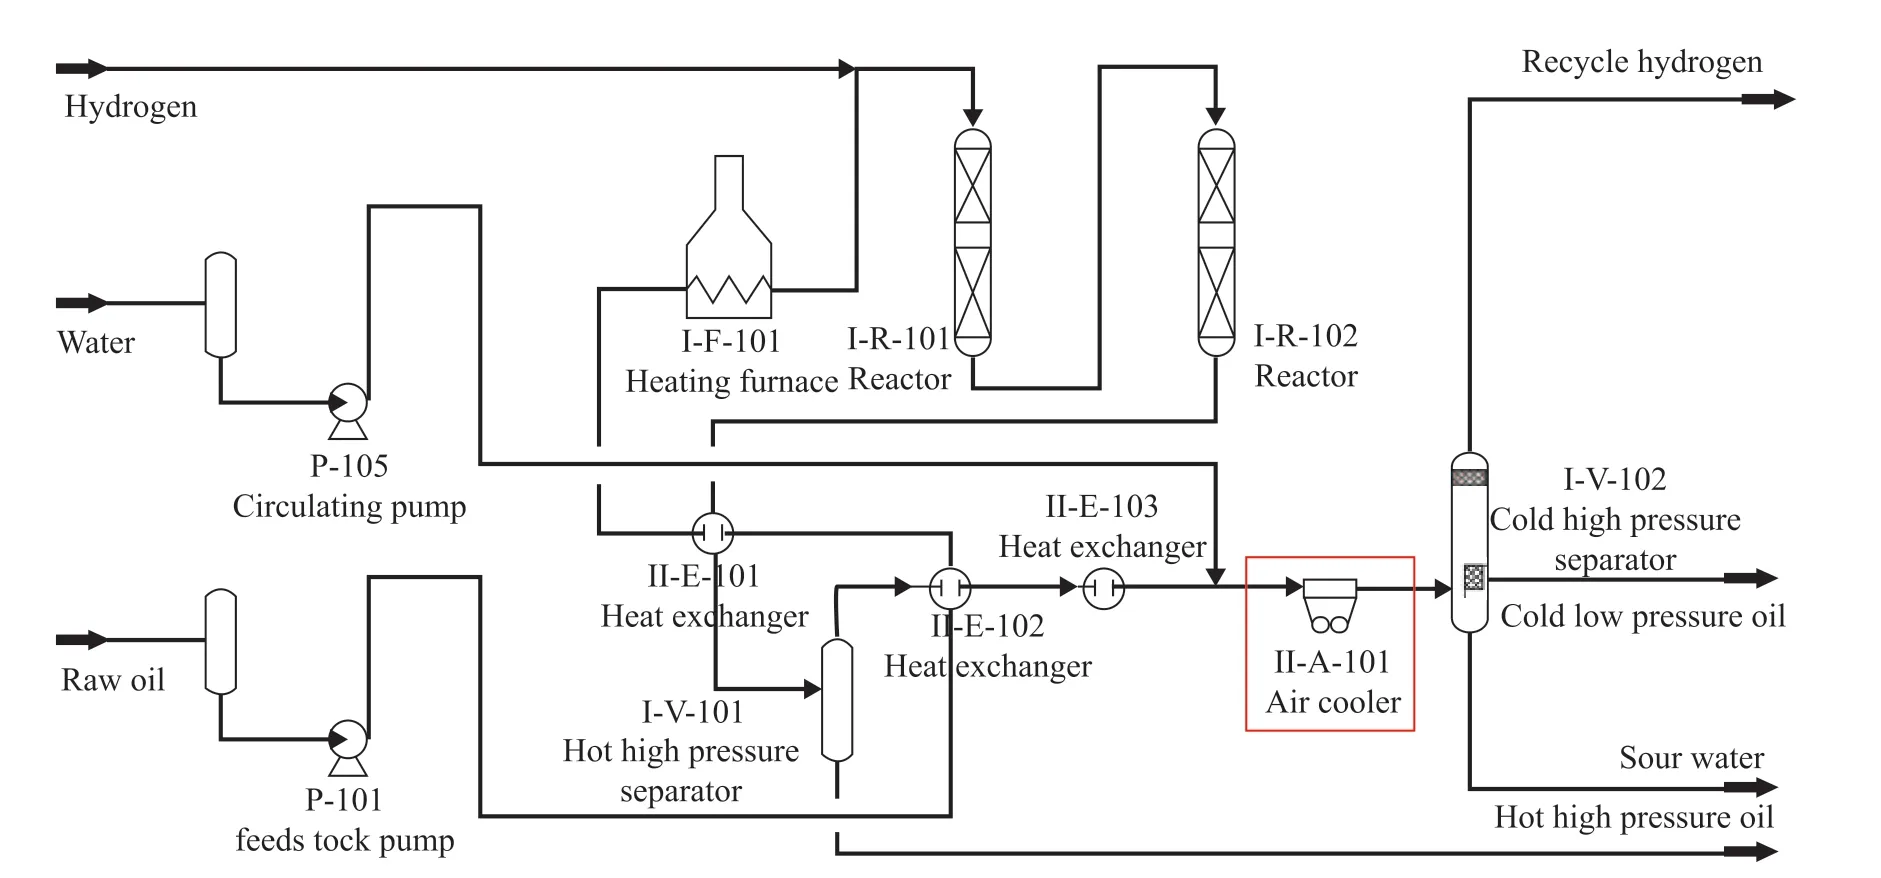
Figure 1 Technical process of the residue hydrotreating reactor effluent system
2.2 Structure and operating conditions of air cooler
The residue hydrotreating reactor effluent system can be divided into I and II series, and each series has a total of four air coolers. Each air cooler involves three tube passes, and each tube pass is composed of two rows. The inlet and outlet temperatures of the air cooler are 129 °C and 41 °C, respectively, and the operating pressure is 15.3 MPa. The structure of the inlet header box of the air cooler is depicted in Figure 2(a). There are 50 finned tubes in odd rows and 49 finned tubes in even rows. To increase the velocity of the multiphase flow in the tube bundle, the two endmost tubes at each end of the odd rows and the three endmost tubes at each end of the even rows were blocked prior to operation.
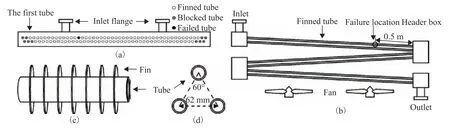
Figure 2 Structure and failure location of the air cooler
Photographs of the overall appearance of the air cooler and the failed finned tube are presented in Figure 3. A leakage in the air cooler was found after two years of operation, at which point a hydrostatic test was performed during the breakdown maintenance period as shown in Figure 3(a). The test results confirmed that the only leakage was from the 14th tube bundle in the first row of the air cooler I-A-101, as shown in Figure 3(b). The leakage point in the finned tube was measured to be 0.5 m from the outlet header box, as indicated in Figure 2(b). The structure of the finned tubes of the air cooler is illustrated in Figure 2(c). The finned tubes are composed of #20 carbon steel tube bundles and aluminum fins, and their parameters are listed in Table 3. The finned tubes are arranged in an equilateral triangle configuration with a spacing of 62 mm between adjacent tubes, as illustrated in Figure 2(d).
Table 3 Parameters of the air cooler finned tubes
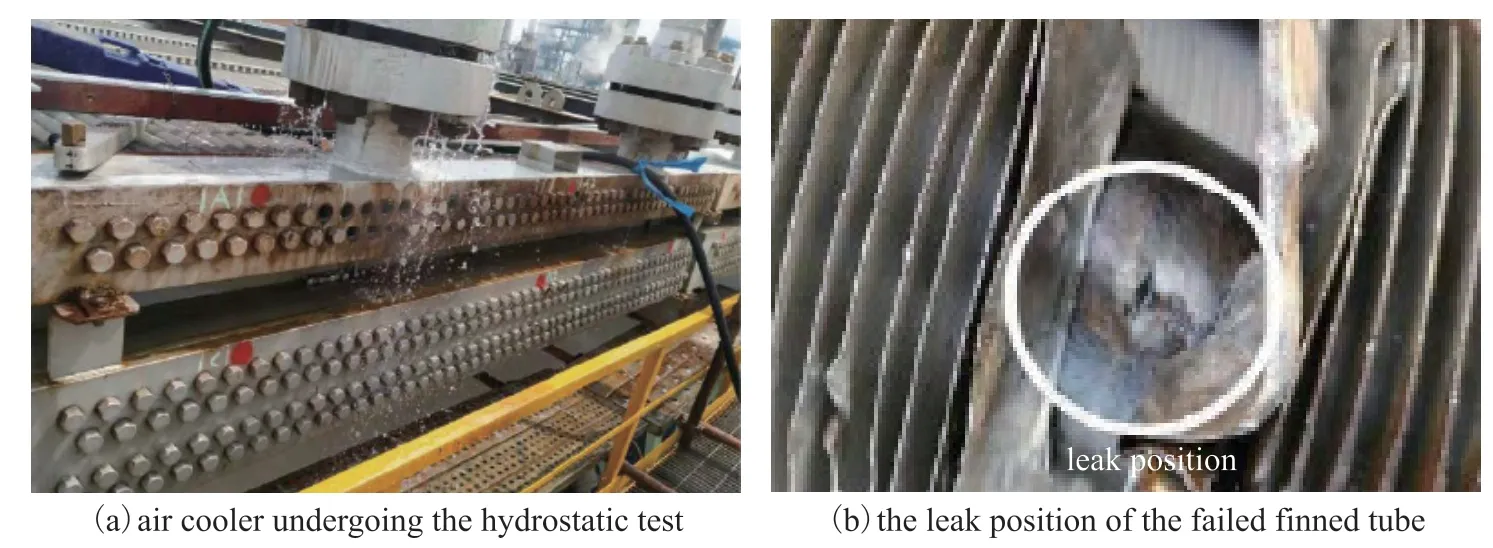
Figure 3 Photographs showing the overall appearance of the air cooler and the failed finned tube
3 Mechanism of Erosion Corrosion in Flow and Mass Transfer Processes
During the hydrogenation reaction, the corrosive gases H2S and NH3are generated from the sulfur and nitrogen compounds present in the raw oil and then enter the reactor effluent system with the two-phase flow. These continuously dissolve to form an aqueous solution of NH4HS upon the injection of water into the pipeline prior to the air cooler. Trace ions such as NH4+, HS−, OH−, and H+are formed by ionization in the acidic aqueous medium, and the corresponding reactions are shown in Eqs. (1) and (2):
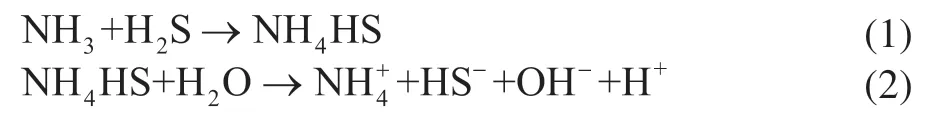
The aqueous medium further reacts with the inner wall of the tube bundle. The dissolved H+reacts with HS−ions and the carbon steel inner wall to generate an iron sulfide protective film that prevents further reaction. The electrochemical chemical corrosion reaction is shown in Eq. (3):

The occurrence of erosion corrosion failure in the ACTB is the combined effect of electrochemistry and flow, and its dynamic process is illustrated in Figure 4. The binding force between the iron sulfide protective film and the carbon steel wall is relatively weak[16]. Thus, the unstable protective film is loosened and shed in the region of high wall shear stress near the inner wall of the tube bundle. Under the action of the drag force, the corrosion product film will collide and slip on the surface of the wall, causing secondary damage[17]. After the film is removed, the carbon steel wall is re-exposed to the ion-containing solution and the electrochemical corrosion reaction continues. Therefore, under the combined action of electrochemistry and flow, the erosion reaction continues, ultimately leading to corrosion and thinning of the tube wall.

Figure 4 Schematic illustration of the dynamic process of erosion corrosion
4 Experimental Analysis
4.1 Visual inspection
The failure location of the ACTB is shown in Figure 5(a). The damaged ACTB was removed from the header box during maintenance after shutdown. Visual inspection revealed that a layer of scale was attached to the inner surface of the tube bundle, and the morphology of the inner carbon steel wall could not be observed. The damaged section was removed by cutting approximately 100 mm in front of and behind the failure site. A highpressure water gun was then used to flush the inside, followed by a wire brush to remove dirt from the surface of the tube bundle. It was found that the connection between the scale and the inner wall of the tube bundle was loose. To allow the observations to be discussed more clearly, the ACTB was divided into four directions, i.e., 0°, 90°, 180°, and 270°, as indicated in Figure 5. The tube bundle was cut along the centerlines between the top and bottom sides to observe the surface morphology in the failure region. The bottom part of the failed tube bundle is shown in Figure 5(b). The inner surface of the tube bundle exhibited a long oval-shaped pitted region with a length of approximately 50 mm. The external appearance of the ACTB is shown in Figure 5(c). The corroded pits had a metallic luster, and pores of approximately 3 mm diameter were observed at the bottom of the pitted region. The metal composition was analyzed in the thinning region to determine the cause of the thinning failure.
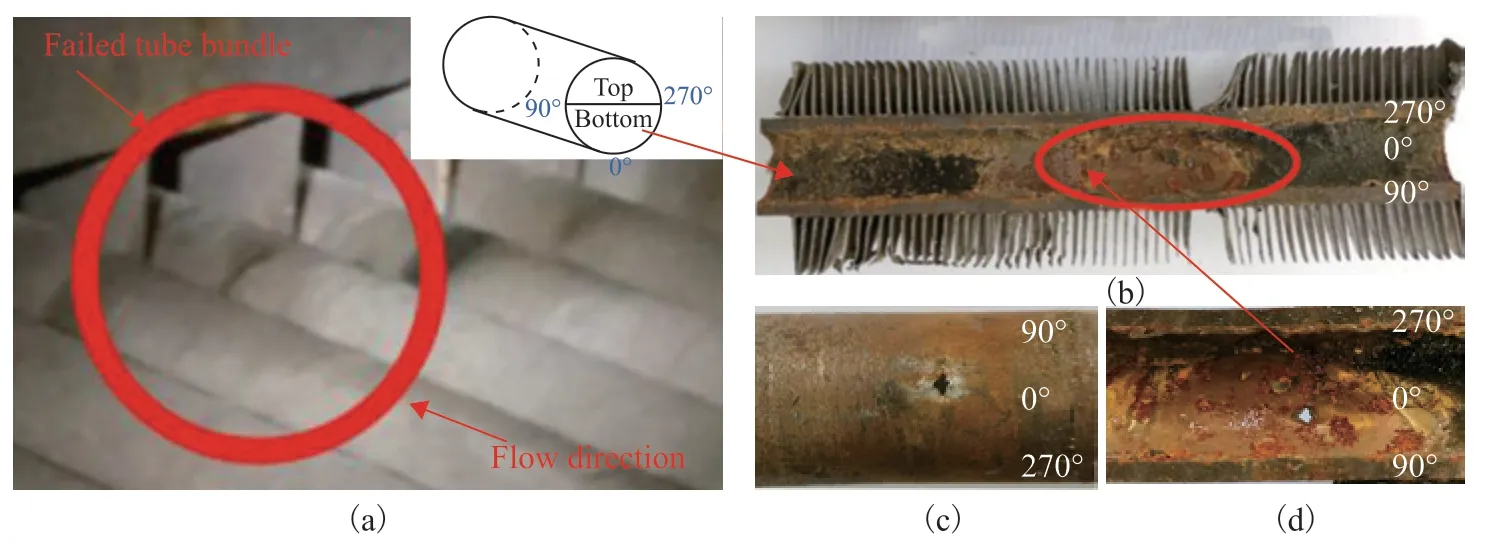
Figure 5 Photographs showing the appearance of the tube bundle after corrosion failure
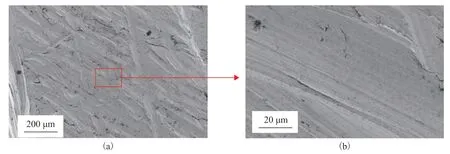
Figure 6 SEM analysis of the surface morphology of the #20 carbon steel
4.2 Scanning electron microscopy
Microscopic analysis is an effective method for examining the surface condition of materials, such as when identifying the failure form and studying the root cause of failure. Thus, the #20 carbon steel base material of the ACTB was examined by SEM. To prepare the samples for analysis, the fins were first removed from the finned tube and the tube was cut into segments for inspection. Next, the surface of the carbon steel substrate was ground on a grinding machine then polished. The sample surface was essentially flat and displayed interlacing strips, as shown in Figure 6(a). These were presumably attributable to damage caused by rough particles on the material surface during the polishing process. When the observation scale was enlarged to 20 μm, the metal surface appeared smooth and compact with a clear texture, as shown in Figure 6(b).
Samples were also obtained from the failure site to examine the surface morphology by SEM, as shown in Figure 7(a). The dense structure on the #20 carbon steel surface of the ACTB was clearly corroded. The samples were further analyzed by energy-dispersive spectroscopy (EDS), as shown in Figure 7(b). Peaks corresponding to oxygen, iron, carbon, and sulfur were observed. A comparison of the elemental compositions of the standard #20 carbon steel and failed surface material samples is presented in Table 4. The carbon steel substrate contained 0.12% oxygen, which was ascribed to the transient oxidation of the sample in air. By contrast, the failure site contained 53.37% oxygen and 3.3% sulfur, which necessitated further analysis.
People have different views about which are the best years of one s life. One common idea is that the teenage years form this happy period. The modern Irish novelist, Edna O Brien, is particularly sensitive to the views of young women, and perhaps one can judge whether she views teenage as necessarily the happiest time in a young girl s life from this description of Caithleen in The Girl with Green Eyes. Living in Dublin, Caithleen has fallen in love with Eugene Gaillard, and has been seeking every possible way of `just bumping into him . Now, unexpectedly, they meet in the street ... Coming down the stone steps from the bookshop I met him. I saw him in that instant before he saw me and I was so astonished that I almost ran away.
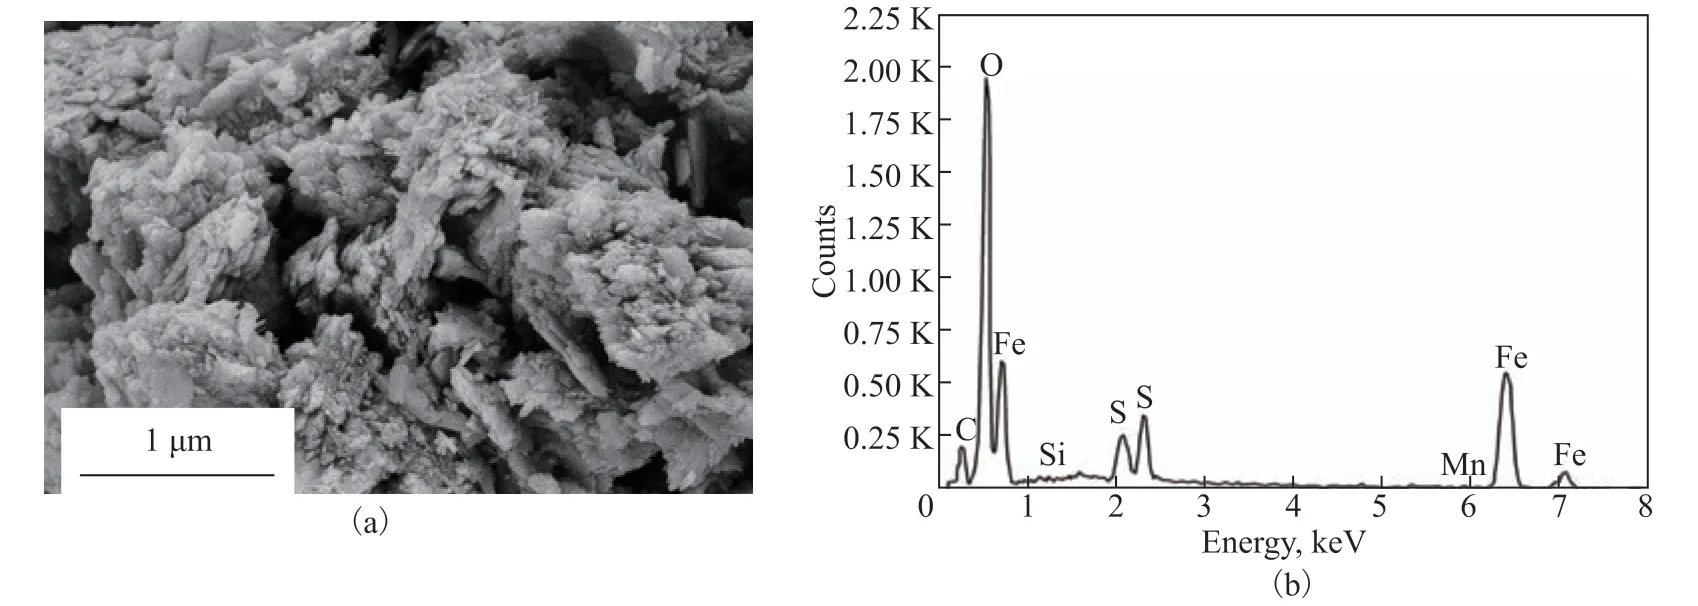
Figure 7 SEM and EDS analysis of the failure surface

Table 4 Elemental compositions of the #20 carbon steel and failure surface
4.3 X-ray diffraction
To further elucidate the causes of the corrosion failure, the failure surface was examined by XRD, as shown in Figure 8. The sample was first ground into a fine powder, then the composition was analyzed on a Rigaku D/Max 2500 PC diffractometer. The results revealed the presence of iron oxides such as Fe3O4and Fe2O3in the failed tube bundle, but these two substances do not directly belong to the flow medium of the reactor effluent system. During shutdown and maintenance, the failed tube bundle was removed from the header box for cutting and analysis. This process took a relatively long time, during which the iron of the metal surface was exposed to air for a prolonged period, allowing its rapid oxidation to iron oxides. In addition, iron sulfide was also detected in the sample, so further analysis of the formation process was required.
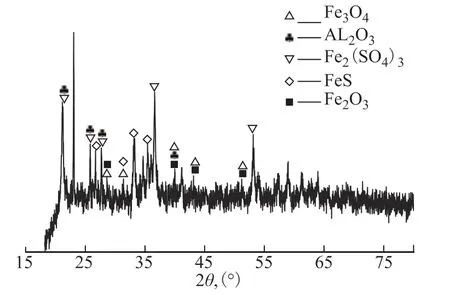
Figure 8 XRD profile of the failed tube surface
5 Numerical Analysis
5.1 Meshing and boundary conditions
Structural meshing of the computational domain was conducted as shown in Figure 9. The air cooler inlet was set as the mass flow inlet, and the ACTB outlet was set as the pressure outlet. Because the corrosion failure occurred in the near-wall area of the tube bundle, boundary layer encryption was carried out. In addition, the independence of the calculations on the number of grid nodes was verified, as shown in Table 5. Without changing the boundary layer density, the effect of the number of grid nodes on the calculation results was observed by using a calculation example with a larger number of grid nodes. The results revealed that the calculated mean velocity and water phase volume fraction at the ACTB outlet became more accurate as the number of grid nodes was increased. However, beyond a certain point, the accuracy of the calculation results did not increase further, as can be seen by comparing cases 3 and 4. Therefore, the case with 7,790,446 grid nodes was selected for the calculations to minimize the computational expense.
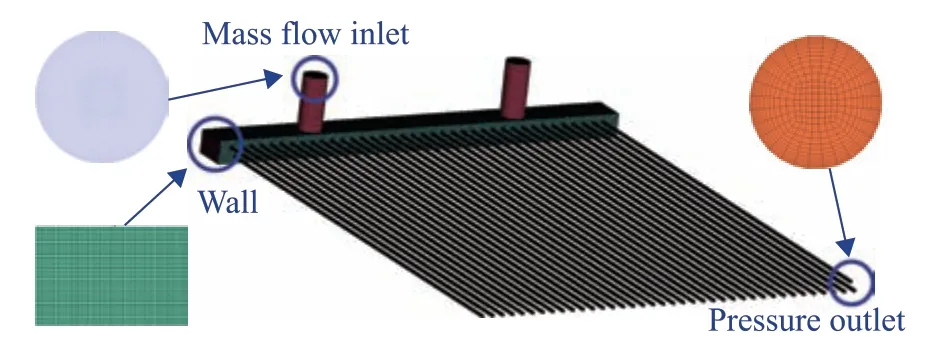
Figure 9 Computational domain meshing
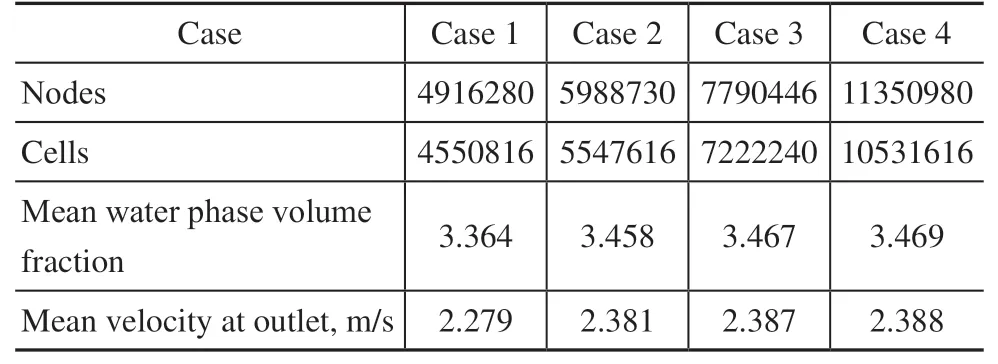
Table 5 Grid independence verification
To improve the accuracy and convergence of the calculations, the second-order upwind difference scheme was used to solve the momentum equation to minimize the numerical diffusion. The mixture multiphase flow model was employed to analyze the process of multiphase flow expansion and movement. In addition, the shear stress transportk–ωmodel was used to simulate the turbulent regime. This model modifies the turbulent viscosity formula and makes the numerical results more accurate.
5.2 Mass transfer and corrosion rate models
In this system, the anodic electrochemical reaction involves the oxidation of iron. The rate of reaction is controlled only by charge transfer owing to the excess iron in the inner wall of the carbon steel tube. The cathodic reaction is the reduction of hydrogen ions, which is controlled by both charge transfer and mass transfer. Therefore, the electrochemical reaction rate is directly related to the mass transfer rate of hydrogen ions. The formula for calculating the mass transfer coefficient of hydrogen ions is as follows[18]:
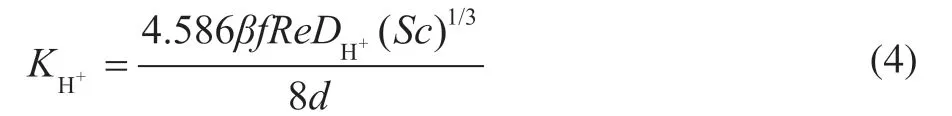
whereReis the Reynolds number,DH+is the molecular diffusion coefficient for hydrogen ions,Scis the Schmidt number,βis related to the Reynolds number, anddis the hydraulic diameter. The corrosion rateCRH+near the wall of the ACTB can be determined by the following formula:

whereMFeis the relative atomic weight of iron,ρFeis the mass density of iron,Fis the Faraday constant, andicorris the flux of hydrogen ions.
5.3 Ionization equilibrium model
According to the raw materials and separated products of the reaction effluent system, a process model was constructed as shown in Figure 10. Under the principle of mass conservation, the separate products were fed into the mixer and calculated as the feed of the model. Hydrogen interacts with the catalyst during hydrocracking to convert heavy oil into light oil in the reactor. At the same time, sulfur and nitrogen compounds in the raw material are converted into large amounts of the corrosive gases H2S and NH3. In the three-phase system composed of oil, gas, and water, soluble gases such as H2S, NH3, and HCl(paucity) enter the water phase as their ions. An ionization model was used to simulate this process. This model has high accuracy for simulating the dissolution and ionization of soluble gases in water. The Henry constantHreflecting the dissolution properties of the reaction components was calculated using the following formula[19]:
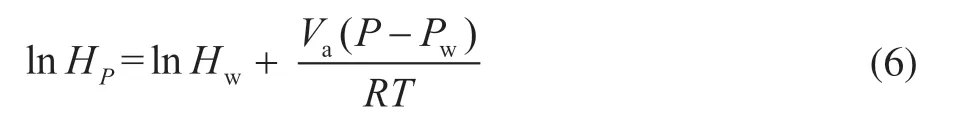
whereHPis the Henry constant for the molecular solute at pressureP,Hwis the Henry constant evaluated at saturation pressure,Vais the partial molar volume of the molecular solute at infinite dilution,Pis the current pressure of the system,Pwis the saturation pressure of water at the system temperature,Tis the system temperature, andRis the gas constant.
The activity coefficientγiwas used to describe the physical interaction between liquid solutes. There are three kinds of interactions in the multiphase flow system of oil, gas, and water: molecule–molecule, molecule–ion, and ion–ion interactions. The influence of the liquid phase composition on the solute activity coefficient can be expressed by the following formula:
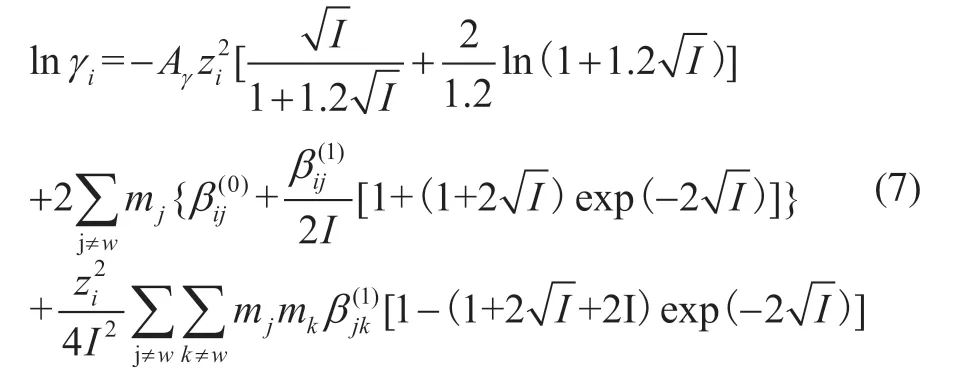
whereAγis the Debye–Hückel parameter,ziis the ionic charge on speciesi,Iis the ionic strength,mjandmkare the concentrations of speciesjandk, respectively, andandare the interaction parameters between speciesiandj.
6 Results and Discussion
6.1 Flow and heat transfer characteristics
Understanding the erosion corrosion behavior first requires analysis of the flow and heat transfer characteristics. The mean velocity and water phase volume fraction distributions of the multiphase flow in the first row of tube bundles are plotted in Figure 11. The mean velocity and water phase volume fraction distributions exhibited essentially opposite behavior on the two sides of the header box and opposite to the flange area. The mean velocity was lower in the regions with a larger water phase volume fraction. This is because the density of the water phase is higher than that of the gas phase in the multiphase flow medium, and the gas phase, which accounts for the largest percentage of the multiphase flow, has a lower content in regions where the water phase content is higher. Soluble components continuously dissolve into the water phase, further reducing the gas phase content and thus the mean velocity. The lowest mean velocity was observed for the 14th tube bundle, with a value of only 2.956 m/s. Moreover, the water phase volume fraction was the highest, reaching 3.145%.
The multiphase flow is distributed to the ACTBs through the air cooler header box after entering from the inlet pipeline. The streamline distribution of the multiphase flow in the air cooler header box was analyzed, as shown in Figure 12. The multiphase flow expanded to the bottom of the header box under the action of gravity, which enhanced the turbulence effect and led to stratification of the velocity of the multiphase flow. In this system, the 11th tube bundle in the first row is located in the high turbulence intensity zone at the inlet flange of the air cooler, which accounts for its high velocity. At the same time, local vortexes formed near the inlet flange owing to collisions and compression of the fluid in the center of the header box. The 14th tube bundle in the first row is located in the backflow area at the top of the header box, and the water phase settles rapidly in the low-velocity area and then enters into the ACTB.
The mean velocity and temperature distributions are key factors in representing the flow and heat transfer characteristics of multiphase flow in the ACTB, and these are plotted in Figure 13. Owing to the continuous heat exchange between the outer surface of the finned tube and the air, the temperature of the multiphase flow in the ACTB decreases with increasing distance from the inlet header box. With this decrease in temperature, the solubility of the soluble gases increases, resulting in continuous mass transfer from the gas phase to the water phase. At the same time, phase transformation also exerts a strong influence on reducing the gas phase volume fraction of the multiphase flow; the water vapor continuously liquefies to form liquid water during the cooling process, which further reduces the volume fraction of the gas phase and increases the volume fraction of the water phase[20].
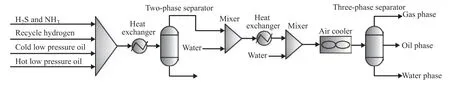
Figure 10 Ionization equilibrium model
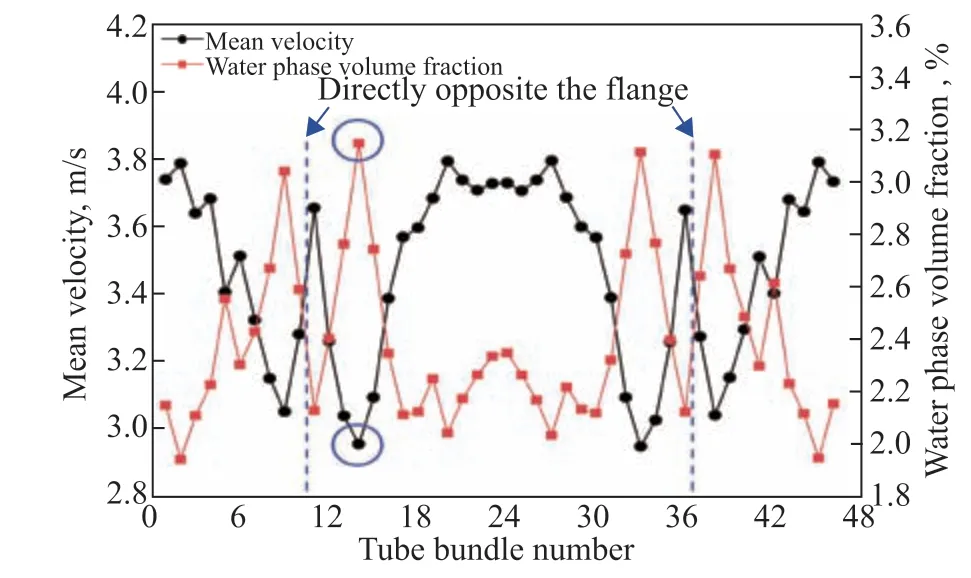
Figure 11 Mean flow rate and water phase volume fraction distributions for the first row of tube bundles
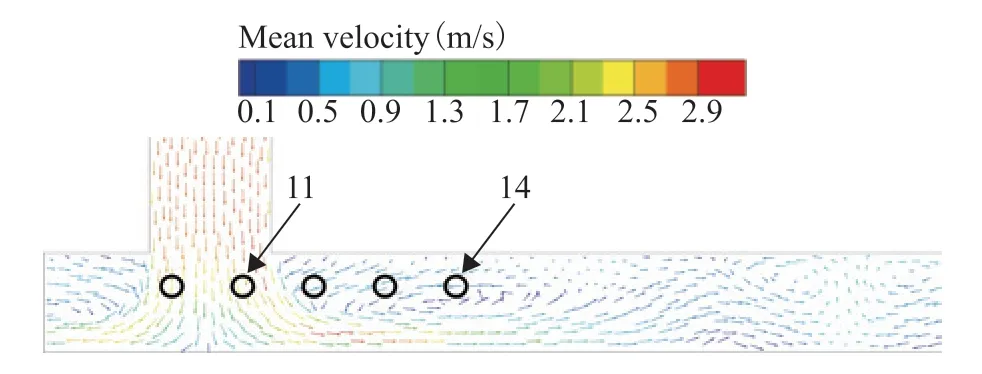
Figure 12 Streamline distribution in the air cooler header box
The water phase volume fraction distributions for different sections of the ACTB are presented in Figure 14. It can be seen that the low-and high-value zones are mainly located at the top and bottom, respectively, of the tube bundle. The water phase settles to the bottom of the tube bundle under the action of gravity because of its higher density. With increasing distance from the inlet header box, the water phase volume fraction increased and the stratification became more pronounced. To reveal the variation of the water phase volume fraction, the heights of the low- and high-value zones were measured and are denoted byhandH, respectively. The height variation of the two zones is shown in Figure 15. In the section withZ= 5 m, the height of the low-value zone was 0.21d, whereddenotes the pipe diameter, which increased to 0.4dfor the section withZ= 10 m. Both the low- and high-value zones displayed this tendency. Owing to the continuous flow and development of the multiphase flow in the ACTB, the fluid motion becomes less affected by turbulence. The water phase settles under the action of gravity, and the gas phase gradually moves up to the top of the ACTB.
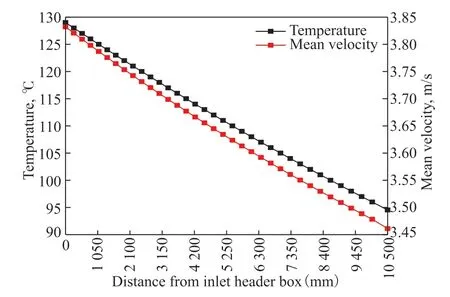
Figure 13 Temperature and mean velocity distributions of the fluid in the ACTB
6.2 Erosion corrosion characteristics
The temperature variation of the mass flow and concentration of the corrosive solute H2S in the water phase is shown in Figure 16. The solubility of H2S in the water phase is known to increase with decreasing temperature of the multiphase flow. Thus, H2S is continuously transferred from the gas phase to the water phase, which increases its mass flow in the water phase. The gas phase condenses and dissolves continuously during cooling of the multiphase flow, which decreases the gas phase mass flow and increases the water phase mass flow. However, because the dissolution efficiency of H2S in the water phase is far greater than the increasing of mass flow of water phase material, the H2S concentration in the water phase shows an increasing trend. The ionization of H2S in the water phase continuously generates HS−ions, which play an important role in the erosion corrosion characteristics.
To further examine the factors governing erosion corrosion in the ACTB, the mass transfer coefficient and corrosion rate were studied for sections at various distances from the inlet header box, as shown in Figure 17. The areas exhibiting greater mass transfer coefficients and corrosion rates were primarily concentrated near the wall and bottom of the ACTB. This is because the electrochemical reaction mainly occurs in the near-wall area of the tube bundle; the closer to the wall of the tube bundle, the higher the ion mass transfer coefficient and the higher the rate of electrochemical reaction. In addition, the water phase was mainly concentrated at the bottom of the tube bundle, and the concentration of hydrogen ions in the water phase was higher, so the mass transfer rate and reaction rate in this area were also higher. The mass transfer coefficient and corrosion rate increased with increasing distance from the air cooler inlet header box. This is also caused by the gradual sedimentation of the water phase, which is consistent with the trend observed for the water phase volume fraction[21].
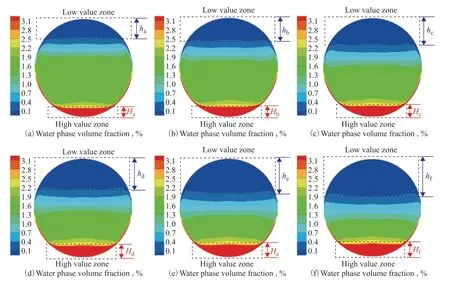
Figure 14 Water phase volume fraction distributions at various sections of the ACTB
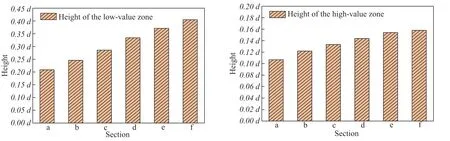
Figure 15 Height variation of the (a) low- and (b) high-value zones based on the water phase fraction
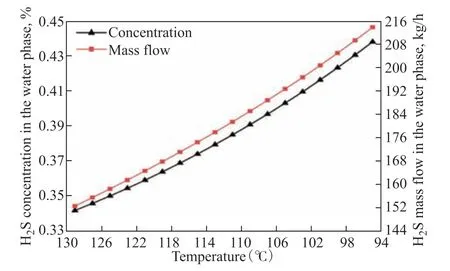
Figure 16 Temperature variation of the mass flow and concentration of H2S in the water phase
The wall shear stress distribution on the bottom wall of the ACTB is presented in Figure 18. The results show that the wall shear stress at the bottom of the tube bundle increased with increasing distance from the inlet header box, reaching a maximum value at a distance of 10 m. With the development of multiphase flow, the water phase continuously settles to and enriches at the bottom of the tube bundle under the action of gravity. At the same time, the continuous dissolution of the gas phase components leads to a gradual increase in the viscosity of the water phase and thus the wall shear stress. The protective film of corrosion products generated by the electrochemical reaction loosens under the action of the wall shear stress and is shed under the action of the multiphase flow, which accelerates the corrosion rate near the wall surface of the tube bundle. The area where the maximum wall shear stress appeared coincides with the location of erosion corrosion failure in the ACTB, which indicates the accuracy of the prediction method.
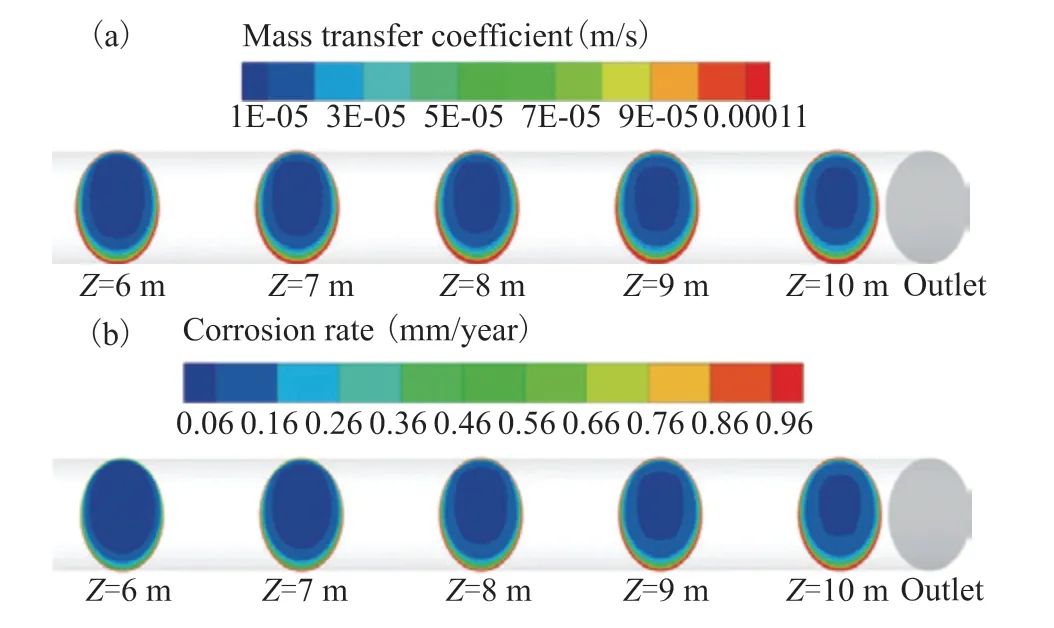
Figure 17 (a) Mass transfer coefficient and (b) corrosion rate distributions at various sections of the ACTB
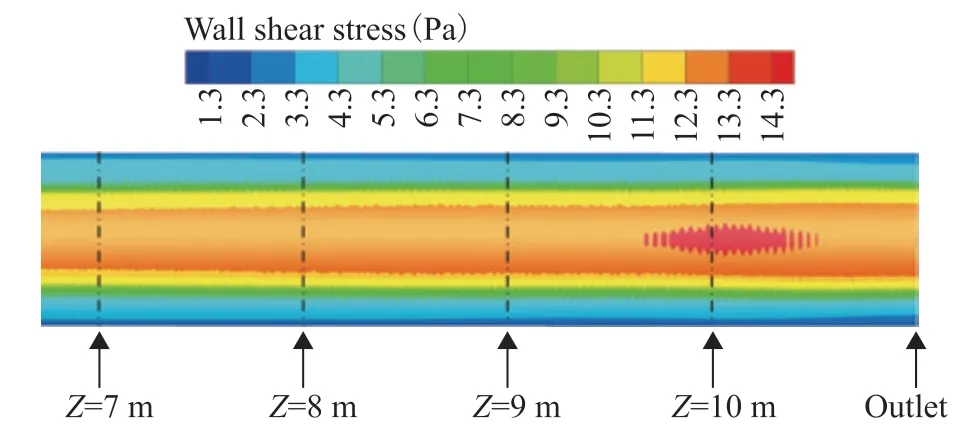
Figure 18 Wall shear stress distribution on the bottom wall of the tube bundle
7 Conclusions
The erosion corrosion failure of an air cooler tube bundle in a residue hydrotreating unit was first investigated experimentally by visual inspection, SEM, and XRD. A loose scale layer was found on the inner wall of the tube bundle, and both pitting and thinning were observed on the inner wall after removing the loose scale. SEM and XRD analysis revealed that the failure surface contained iron sulfide and iron oxide, which is consistent with the characteristics of erosion corrosion damage to carbon steel. Next, numerical simulations were conducted to examine the flow and erosion corrosion characteristics in the air cooler. The 14th tube bundle in the first row displayed the highest water phase volume fraction but the lowest mean velocity, which indicates a higher dissolution time and greater dissolution of corrosive gas. The temperature of the multiphase flow decreased with increasing distance from the inlet header box, while the mass flow rate and concentration of H2S in the water phase increased. Under such conditions, the mass transfer coefficient and corrosion rate of the tube bundle near the outlet header box continuously increases. Finally, concentration of the wall shear stress leads to loosening of the corrosion product film, resulting in erosion corrosion of the air cooler tube bundle.
Acknowledgments:The project is supported by the National Natural Science Foundation of China (Grant Nos. 51876194, U1909216, and 52176048) and the Fundamental Research Funds of Zhejiang Sci-Tech University (Grant No. 2021Q020).
- 中国炼油与石油化工的其它文章
- Activated Carbon from Rice Husk with One-Step KOH Mechanical Mixing Activation as Adsorbent for Treating Phenolic Wastewater
- Removal of Basic and Non-Basic Nitrogen Compounds from Model Oil by FeCl3-Based Ionic Liquids
- Selection of Extraction Solvents for Bitumen from Indonesian Oil Sands through Solubility Parameters
- Synthesis of Hierarchical Porous Fe2O3/Al2O3 Materials and Study on Catalytic Viscosity Reduction of Heavy Oil
- New Model for Calculating Hydrogen Consumption in Residue Hydrotreating
- Effect of Particle Shape on Catalyst Deactivation during 2-Butene and Isobutane Alkylation of Liquid Phase in Fixed-Bed Reactor Using Particle-Resolved CFD Simulation