
New Model for Calculating Hydrogen Consumption in Residue Hydrotreating
2022-02-01 04:05ZhangKuiNieHongDaiLishun
中国炼油与石油化工 2022年4期
Zhang Kui; Nie Hong; Dai Lishun
(SINOPEC Research Institute of Petroleum Processing Co., Ltd., Beijing 100083, China)
Abstract: In this paper, hydrogenation of CH to CH2 (HDCH reaction) was employed to simulate the hydrogen consumption during residue hydrotreating, because the pseudo components, CH and CH2, can be converted with the content of C and H. Through a pilot-scale experiment, a kinetic model for the HDCH reaction was constructed and it has high accuracy. By analyzing the running data of an industrial-residue hydrotreating unit, the activity change of the HDCH reaction was obtained using the active-region-migration deactivation model. The obtained HDCH activity model has high accuracy, where the frequencies of >10% relative errors are less than 1% for the CH and H contents. The hydrogen consumption model, the coupling of the HDCH kinetic model and the HDCH deactivation model, can be applied to calculate the hydrogen consumption. For case 2, where the hydrogen consumption model is adjusted every 100 days, the calculated data well match the real data compared to case 1, where the hydrogen consumption model is unadjusted over the whole runtime.
Key words: HDCH; kinetics; deactivation; hydrogen-consumption; model
1 Introduction
Residue is the heaviest fraction of crude oil, with high contents of S, N, metal impurities, and carbon residue (CCR). Fixed-bed residue hydrotreating technology can remove impurities, such as S, N, and metals, and reduce the CCR value via the hydrogenation reaction. The obtained hydrotreated residue can be used as the qualified feed for the fluidized catalytic cracking (FCC) unit. However, during the residue hydrotreating process, numerous complex reactions occur, and most of them are hydrogenation reactions, which often makes the prediction of the unit hydrogen consumption difficult.Currently, there are various calculation models of hydrogen consumption for the hydrogenation unit, which are mainly divided into two categories. The first model category is the correlation of hydrogen consumption with each hydrogenation reaction and/or cracking reaction[1-5]. Since hydrodesulfurization (HDS), hydrodenitrification, and olefin and aromatics hydrogenation saturation are all hydrogen consuming reactions, the total chemical hydrogen consumption can be obtained by associating the reaction kinetics of each hydrogenation reaction with this hydrogen consumption. For the hydrocracking reaction, the total chemical hydrogen consumption is also related to the yield of light fractions, such as gas, light naphtha, and heavy naphtha[5]. The second model category is the correlation between hydrogen consumption and process parameters of the unit[6]. The process parameters of the unit mainly include liquid-volume-space velocity (LHSV), refining or cracking reaction temperature, hydrogen partial pressure, etc., and the empirical calculation model of unit hydrogen consumption can be obtained by fitting the relationship between the unit hydrogen consumption and the process parameters.
However, few calculation models of hydrogen consumption for the residue hydrotreating unit exist. Additionally, the residue hydrotreating catalyst has the characteristics of fast deactivation and short run time, which objectively increases the difficulty of modeling the hydrogen consumption for the residue hydrotreating unit. Especially, at the end of the runtime, the catalyst activity decreases to a low level, greatly increasing the reaction temperature, which consequently exacerbates the severe deactivation of the catalyst[7,8]. The run time of the residue hydrotreating catalyst is generally only about 1–1.5 years. During the run time of the residue hydrotreating unit, the catalyst and reaction activities gradually decrease; consequently, the hydrogen consumption of the unit is affected by catalyst deactivation. Therefore, when studying the hydrogen consumption model of the residue hydrotreating unit, the catalyst deactivation model needs to be introduced.
In recent years, many studies have been conducted on the deactivation model of residue hydrotreating catalyst[9], wherein the active-region-migration deactivation model is a special model for simulating the deactivation performance of residue hydrotreating catalyst. Figure 1 displays the schematic of the active-region-migration model. The model makes two main assumptions. One is that metal deposition limits molecular diffusion, which decreases the molecular diffusion coefficient. The other is that as the metal-deposition of the catalyst particles increases, the active region gradually migrates to the edge of particles[10]. The concentration distribution equation of reactant molecules in the active region can be simplified as follows:

Figure 1 Active-region-migration model
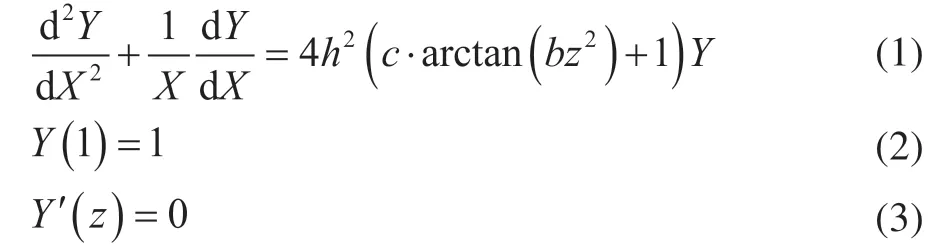
Furthermore, the equation of activity factor “a” is simplified as follows:
The active-region-migration model is a deactivation model with three adjustable parameters:h,b, andc. By adjusting the three parameters (h,b, andc), the equation of the activity factor “a” can simulate and fit the deactivation performance with specific curves.
In this study, the kinetic model about hydrogen consumption is constructed by analyzing the data of the pilot-scale experiment. Here, the change of the hydrogen consumption is characterized by the HDCH reaction. Simultaneously, the operation and analysis data of industrial units are collected, the activity change of HDCH reaction is simulated using the active-region-migration deactivation model, and the hydrogen consumption model of residue hydrotreating is constructed. Based on this model, the model application of the industrial plant operation is explored.
2 Experimental
2.1 Test preparation
As the raw oil in residue hydrotreating test, residue A was obtained from an industrial residue hydrotreating plant in China, and the main properties are listed in Table 1. As shown in Table 1, residue A has high contents of the nickel (Ni) and vanadium (V), about 22.7 and 80.4 μg/g, respectively, and it has very litter H content, about 10.57%.
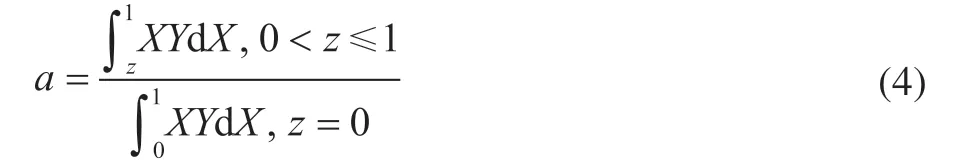
In the residue hydrotreating test, the pilot-scale equipment was employed, and its flow diagram is shown in Figure 2. Along the streamwise direction, the hydrodemetallization (HDM) catalyst and the HDS catalyst were loaded separately in the two reactors. Here, the HDM and HDS catalysts are commercial catalysts that were developed by the Sinopec Research Institute of Petroleum Processing. Table 2 lists the properties and loading data of the catalysts used in the residue hydrotreating test.
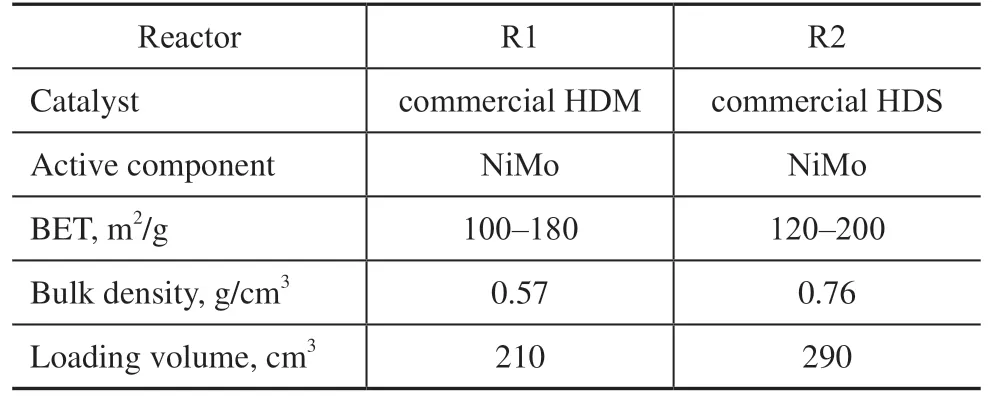
Table 2 Main properties and loading data of catalysts used in residue hydrotreating test
Figure 2 Pilot-scale equipment for testing the hydrotreating of residue
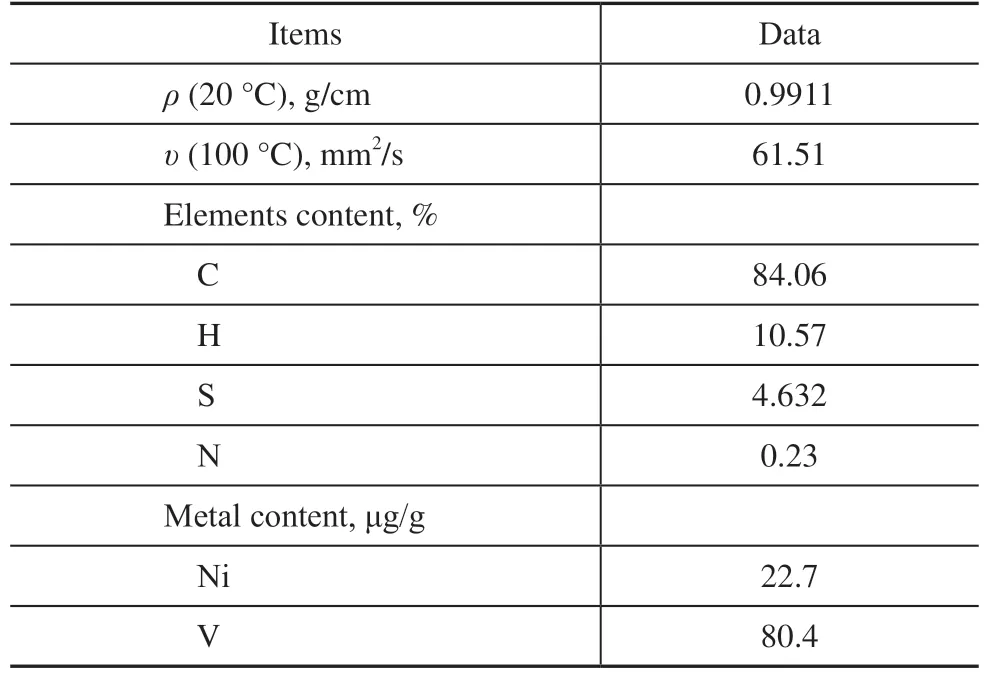
Table 1 Main properties of residue A
During the residue hydrotreating test, residue A was sequentially hydrotreated by the HDM and HDS catalysts on various operation conditions. The residue hydrotreating conditions are as follows: R1 and R2 temperature (T) range of 365–405 °C; pressure (p) range of 13.0–16.0 MPa; LHSV range of 0.15–0.40 h−1; and volume ratio of H2to oil (H2/Oil) of 700. The data of the tests were applied to establish the kinetic model for residue hydrotreating.
2.2 Refinery data
The operation data of the residue hydrotreating plant in two runs were collected from a refinery in China. The first-run data were used to establish the new model for calculating the hydrogen consumption, and the secondrun data were used to demonstrate the model usage. The types of HDM and HDS catalysts as well as their volume proportions loaded in the two industrial runs only slightly varied from those of the pilot plant. Based on the production requirements, the blending ratio of the vacuum residue needs to be adjusted in real time; therefore the feed properties were changed daily for the two runs. Furthermore, they differed from the feed properties of the pilot plant.
2.3 Sample analysis
The densities of the residue and its hydrotreated oil were analyzed using a DMA 4500M density meter (Anton Paar company), and a CAV 2100 fully-automatic digital kinetic viscometer (Cannon Instrument Company) was used to analyze the kinematic viscosity. A Lab-X3500SCL X-ray fluorescence spectrometer (Oxford Instruments, Inc.) was employed to determine the S content based on the strength of the S-Kα characteristic spectral line with 2.3 keV. The N content was analyzed using a multi EA5000 elemental analyzer (Analytikjena, Inc.) by detecting the light emitted from the decay of excited-state NO2. The Ni and V content were analyzed on an Optima 7300DV inductively coupled plasma-optical emission spectrometer (PerkinElmer Company). The C and H contents were obtained using a Vario ELCube elemental analyzer (Elementar, Inc.) by detecting the amount of produced gases after the combustion of the samples.
3 Kinetic Model
3.1 Definition of HDCH (hydrogenation of CH) reaction
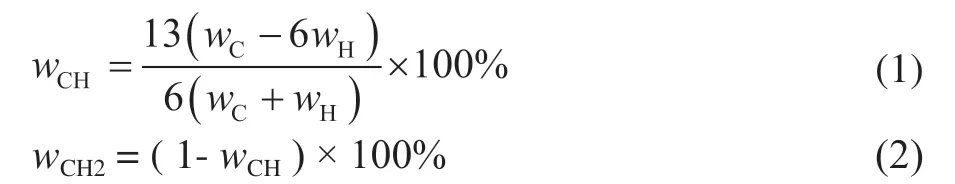
The elements of residue and its hydrotreated oil mainly constitute C, H, S, and N, and the C and H content is usually more than 95%. For all the calculations herein, the hydrocarbon content in residue and its hydrotreated oil can be normalized after removing the S and N content. The hydrocarbon content is considered to be the sum of the C and H contents. According to the group-saturation difference of hydrocarbons, the hydrocarbon composition in residue and its hydrotreated oil can be re-divided.
In this study, the hydrocarbons in residue and its hydrotreated oil are abstractly defined as comprising CH and CH2groups, and CH and CH2are considered as pseudo-components. The CH pseudo-component represents unsaturated hydrocarbons with the carbon–hydrogen atomic ratio of 1:1, and the CH2pseudocomponent represents saturated hydrocarbons with the carbon–hydrogen atomic ratio of 1:2. Based on this definition, the CH and CH2contents in the residue and its hydrotreated oil can be calculated based on the C and H contents. For example, when the hydrogen–carbon atomic ratio is 1.2, as the symbol of CH1.2, in the residue and its hydrotreated oil, the molar fraction of CH and CH2is 0.8 and 0.2, respectively. The equations for calculating the weight contents of CH and CH2in the residue and its hydrotreated oil are as follows:
Through residue hydrotreating, unsaturated hydrocarbons can be saturated by hydrogen (H2) through hydrogenation reactions, such as hydrogenation reaction of aromatics and hydrogenation reaction of CCR. Furthermore, the hydrogen pressure during residue hydrotreating is high, generally more than 15 MPa, and the dehydrogenation from CH2to CH is ignored here. Thus, according to the new definition of CH and CH2, the hydrogenation of unsaturated hydrocarbon is represented by the HDCH reaction. The reaction equation of HDCH is as follows:

3.2 Establishment of HDCH kinetic model
3.2.1 Model equation
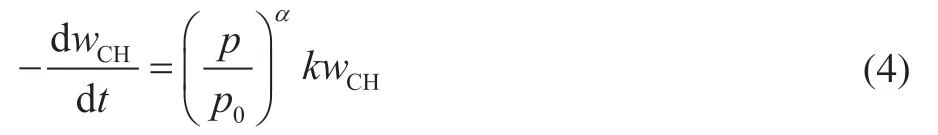
The reaction order of aromatic hydrogenation is generally first-order[11-12], and the CH pseudo-component basically comprises aromatics; thus, the first-order reaction kinetic model is adopted for the HDCH reaction herein. Additionally, the research shows that the gaseous hydrogen adsorbed on the active center of the catalyst can be converted into active hydrogen during hydrogenation[13]and can participate in the hydrogenation reaction. The hydrogen partial pressure has a certain impact on the hydrogenation reaction[14]: high hydrogen partial pressure can promote the conversion of gaseous hydrogen to active hydrogen and improve the content of active hydrogen on the catalyst surface[15-16]. Therefore, the hydrogen partial pressure term is introduced into the kinetic model equation of the HDCH reaction to describe the effect of hydrogen partial pressure on residue hydrotreating.Based on the HDCH reaction equation, the differential model equation of HDCH reaction rate is listed as follows:
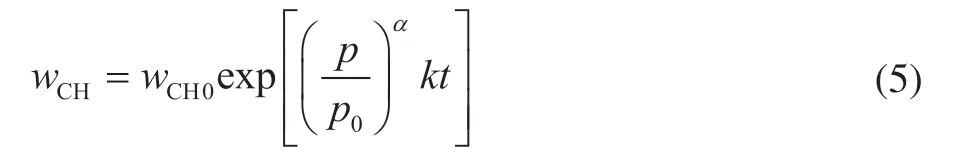
After integrating the differential equation, the integral model equation of the HDCH reaction can be obtained as follows:
Here,kis the reaction rate constant, which can be expressed by the Arrhenius equation as follows:
3.2.2 Model validation
The integral model equation of the HDCH reaction shows that the kinetic model parameters includeα, A0, and E. Thus, when calculating the model parameters of the HDCH reaction, the CH0and operation conditions are considered as independent variables, and the ∑R2between the model data and test data is the objective value. The obtained values ofα,A0, andEwhen the ∑R2value is the smallest are considered as the optimum kinetic model parameters.
After the CH content was obtained by the kinetic model of the HDCH reaction, the H content can be calculated by the equation of “H% = CH%/13 + (100 − CH%)*2/14.” Figure 4 shows the content of CH and H obtained via measurements and calculations. As shown in Figure 4a and 4b, the deviation between the measured and calculated CH is very small, and the H content also shows the slight deviation between the measured and calculated data. Thus, the obtained kinetic model of the HDCH reaction has high accuracy and it can be used to construct the model for determining the hydrogen consumption.
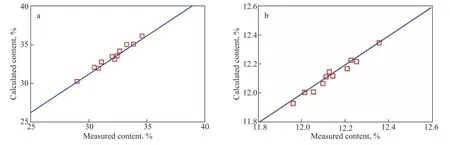
Figure 4 (a) CH and (b) H contents obtained through measurements and calculations
4 HDCH Deactivation Model
The first-run industrial data were used to establish the HDCH deactivation model for calculating the hydrogen consumption. Based on the established kinetic model of the HDCH reaction herein, the HDCH reaction rate was calculated and the HDCH activity (a) of catalyst was obtained. The parameterkof the reaction rate was calculated according to Eq. (5), and it can be obtained as Eq. (7). Moreover, the HDCH activity (a) of the catalyst can be expressed as Eq. (8).

Figure 5 shows the change of the HDCH activity (a) with the metal loading of the catalyst,M/M0. TheM/M0value is generally proportional to the runtime as the metal deposition on the catalyst gradually increases daily. As shown in Figure 5, asM/M0increases, the HDCH activity exhibits a sharp initial decrease at the start of run (SOR), then a long and slow deactivation at the middle of run, and finally a sudden death when the metal loading in a pellet reaches its maximum at the end of run. The model curve of the HDCH activity withM/M0was calculated using the active-region-migration model. The curve can well fit the change of the HDCH activity with the goodness-of-fit (R2) of 0.8871. The obtained parameters of the curve areh= 10.5,b= 19.0, andc= 0.48.
Based on the model curve of the HDCH activity withM/M0and the HDCH kinetic model, the model data of CH, H, ∆H, and ∆H2can be easily calculated. As mentioned above, the CH value was obtained by the kinetic model of the HDCH reaction, and H content was calculated from the CH content. The weight-H2consumption per 100 g feed (∆H) is the difference value of the H content in hydrotreated and raw oils. The standard volume-H2consumption per ton feed (∆H2) was obtained from ∆H. Comparisons of CH, H, ∆H, and ∆H2between real data and model data are shown in Figure 6(a–d), respectively. As shown in Figure 6(a–d), over the whole runtime, the real data and model data little vary. Furthermore, by calculating the relative errors of CH, H, ∆H, and ∆H2between real data and model data, the frequencies about the relative errors of CH, H, ∆H, and ∆H2were obtained, which are shown in Figure 7(a–d). Figure 7a and 7b shows that for CH and H the frequencies of >10% relative errors are very small, less than 1%, verifying the high accuracy of the HDCH activity model. Due to similar calculation methods, the frequency about the ∆H relative error is the same as that of ∆H2, and the frequency about ∆H with relative error of >10% is slightly higher than that about CH.
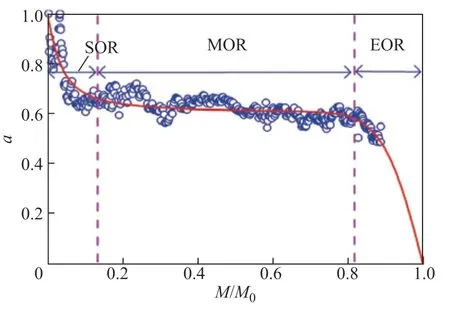
Figure 5 Change of HDCH activity (a) with the metal loading of catalyst M/M0
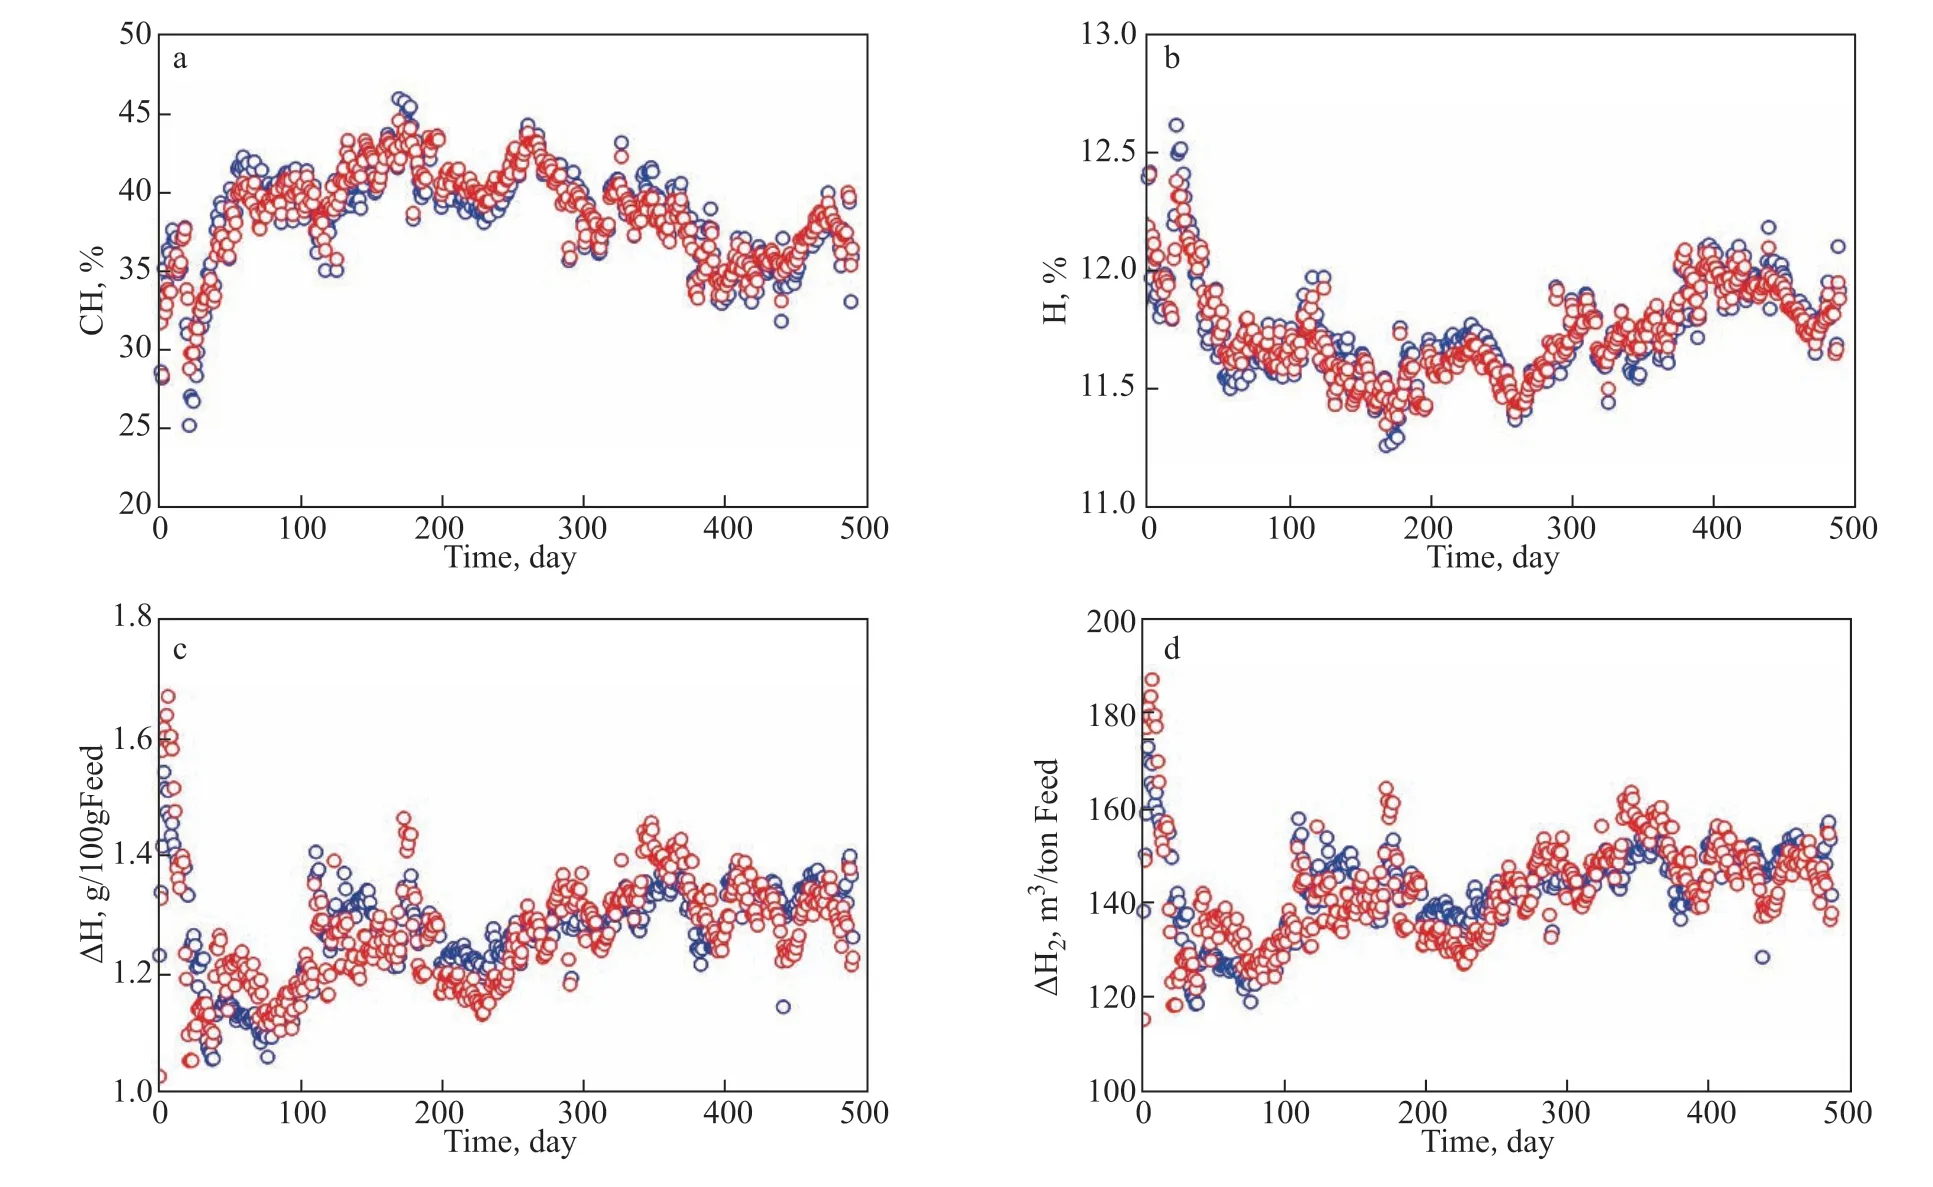
Figure 6 Changes of CH (a), H (b), ∆H (c), and ∆H2 (d) with the runtime
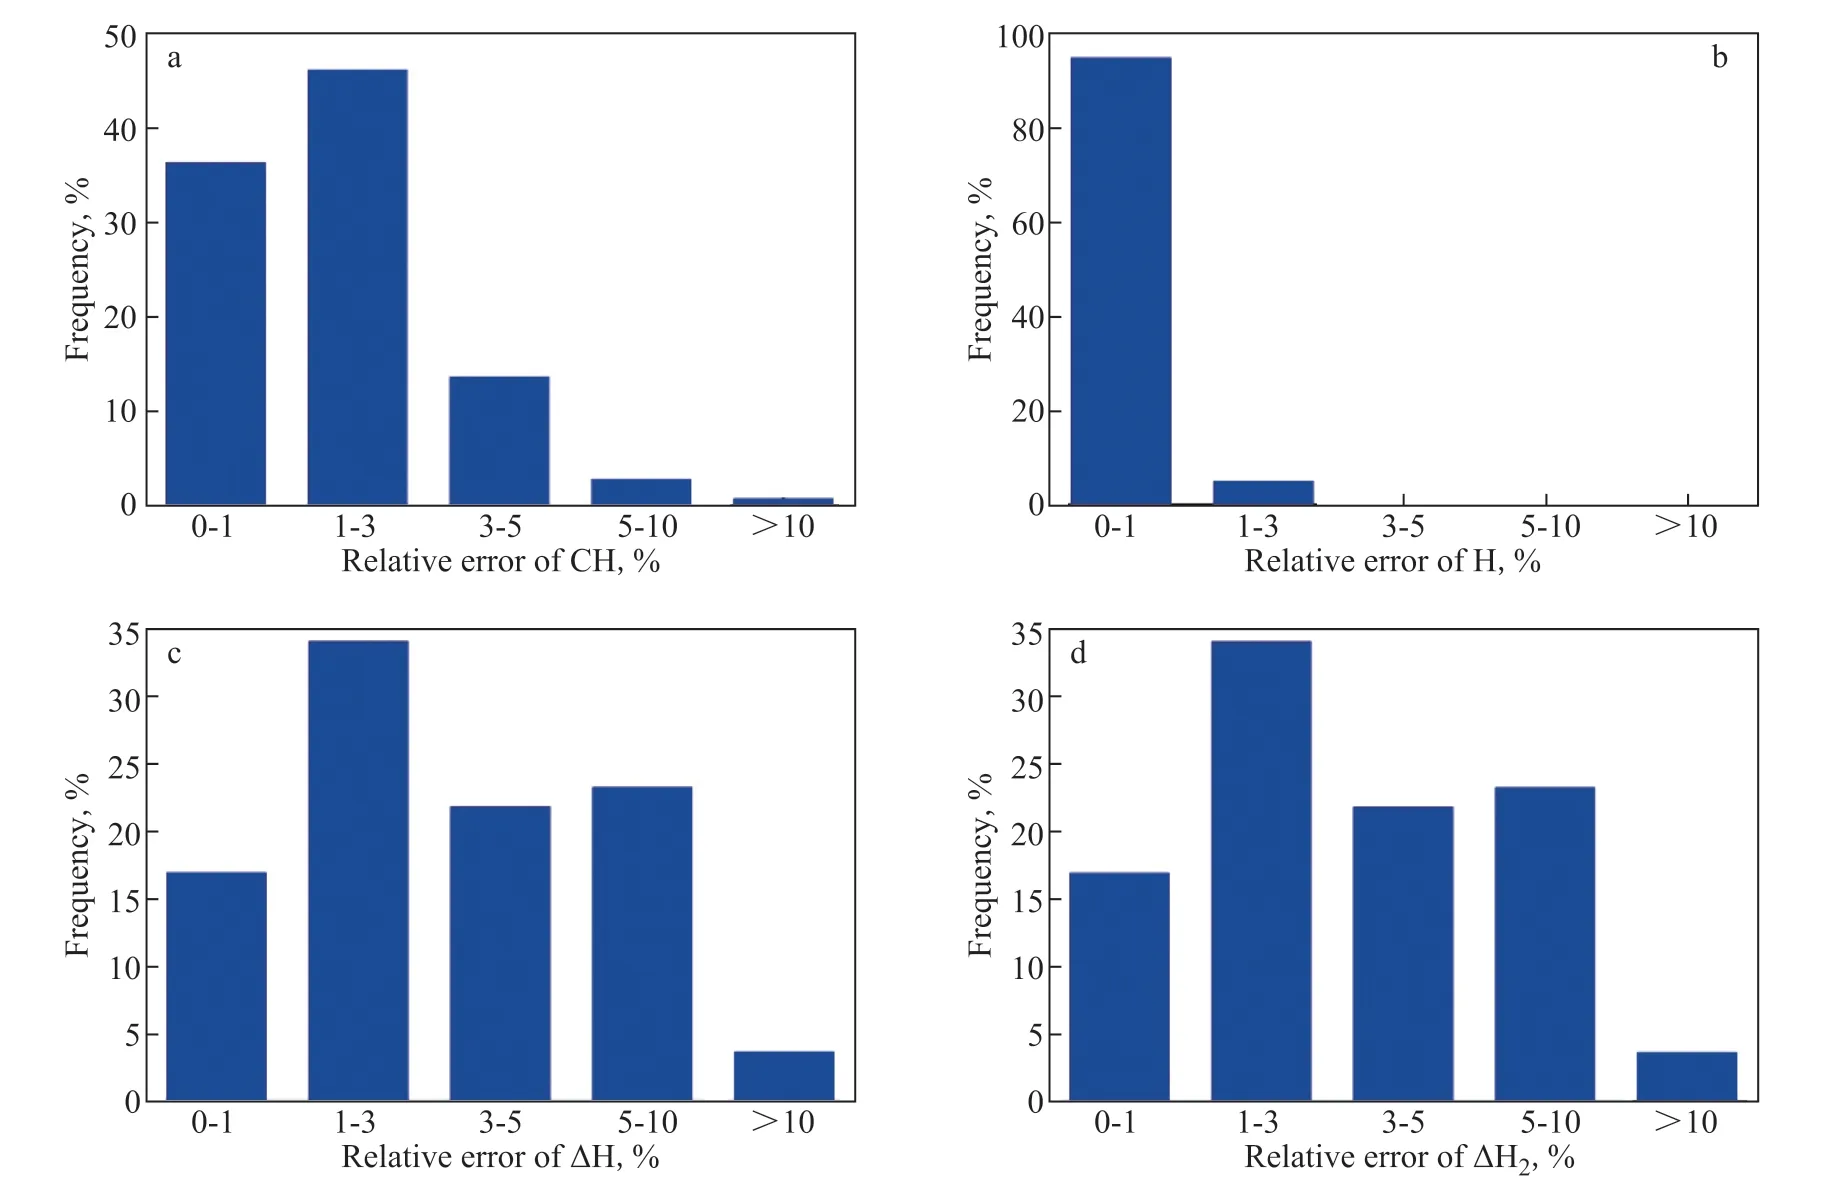
Figure 7 Frequency vs. relative errors of CH (a), H (b), ∆H (c), and ∆H2 (d)
Figure 8 Changes of CH (a), H (b), ∆H (c), and ∆H2 (d) with the runtime
5 Model Application
Here, the hydrogen consumption model can be considered as the coupling of the HDCH kinetic model and HDCH deactivation model. For the same residue hydrotreating plant, the established hydrogen consumption model can be considered as the base case for calculating the hydrogen consumption. The data of the second run were used to demonstrate the usage of the hydrogen consumption model. When calculating the hydrogen consumption, two cases are considered. In case 1, with the HDCH kinetic parameters and the HDCH activity curve unchanged, the model was directly employed to calculate the hydrogen consumption while the input of the feed properties was varied every day in the second run. In case 2, when calculating the hydrogen consumption in the second run, the model was adjusted every 100 days, which is the only difference in comparison with case 1.
Case 1
Figure 8(a–d) shows the comparisons of CH, H, ∆H, and ∆H2in the second run between real data and predicted data, respectively. Over the whole runtime, the predicted CH was slightly higher than the real CH, and the calculated H was lower than the real H. ∆H and ∆H2exhibited the same performance of lower calculation values compared to the real values. The possible reason may be that the activation energies of the HDCH reaction in the second run were slightly different from those in the first run due to the varied blending ratio of the vacuum residue in the feeds. The relative errors of CH, H, ∆H, and ∆H2between the real data and calculated data were calculated, and the frequencies about the relative errors of CH, H, ∆H, and ∆H2were obtained, as shown in Figure 9(a–d). Figure 9a–9d shows that although the frequencies about CH and H with relative errors of >10% are small, those of ∆H and ∆H2are about 38%. Clearly, the calculated results do not well match with the real results when calculating in the mode of case 1. Therefore, it is better to adjust the model when calculating the hydrogen consumption.
Case 2
Here, when calculating the hydrogen consumption in the second run, the model was adjusted every 100 days. Figure 10(a–d) shows the comparisons of CH, H, ∆H, and ∆H2in the second run between real data and calculated data, respectively. Over the whole runtime, the calculated CH, H, ∆H, and ∆H2better matched with the real data than case 1. By further calculating the relative errors of CH, H, ∆H, and ∆H2between real data and calculated data, the frequencies about the relative errors of CH, H, ∆H, and ∆H2were obtained, as shown in Figure 11a–11d. In comparison with case 1, the frequencies about CH and H with high relative errors are reduced, and the frequencies about the ∆H and ∆H2with relative errors of >10% are also reduced, about 18%. Obviously, the calculated data well match the real data in comparison with case 1. Thus, it is better to adjust the hydrogen consumption model when calculating the hydrogen consumption on the running of the residue hydrotreating plant.

Figure 9 Frequency vs. relative errors of CH (a), H (b), ∆H (c), and ∆H2 (d)
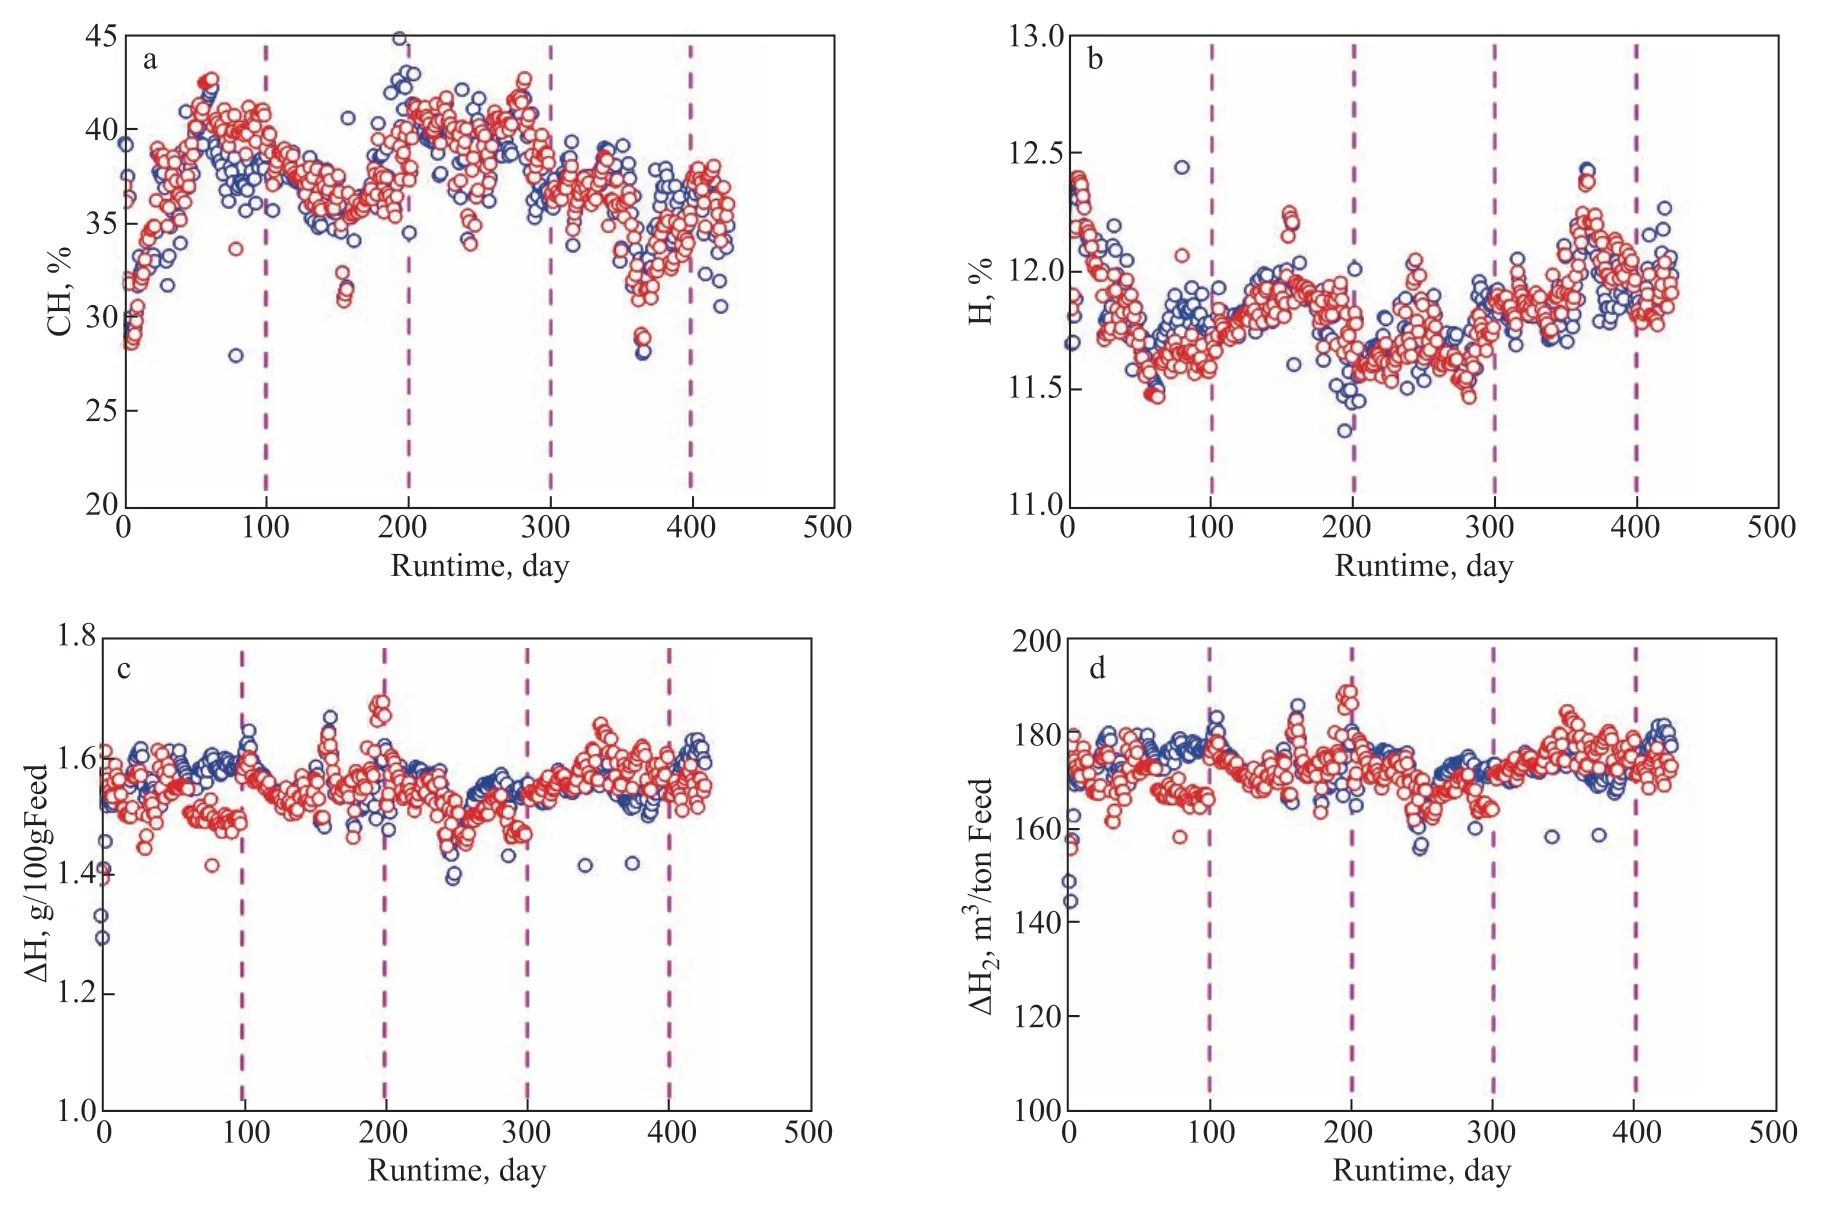
Figure 10 Changes of CH (a), H (b), ∆H (c), and ∆H2 (d) with the runtime
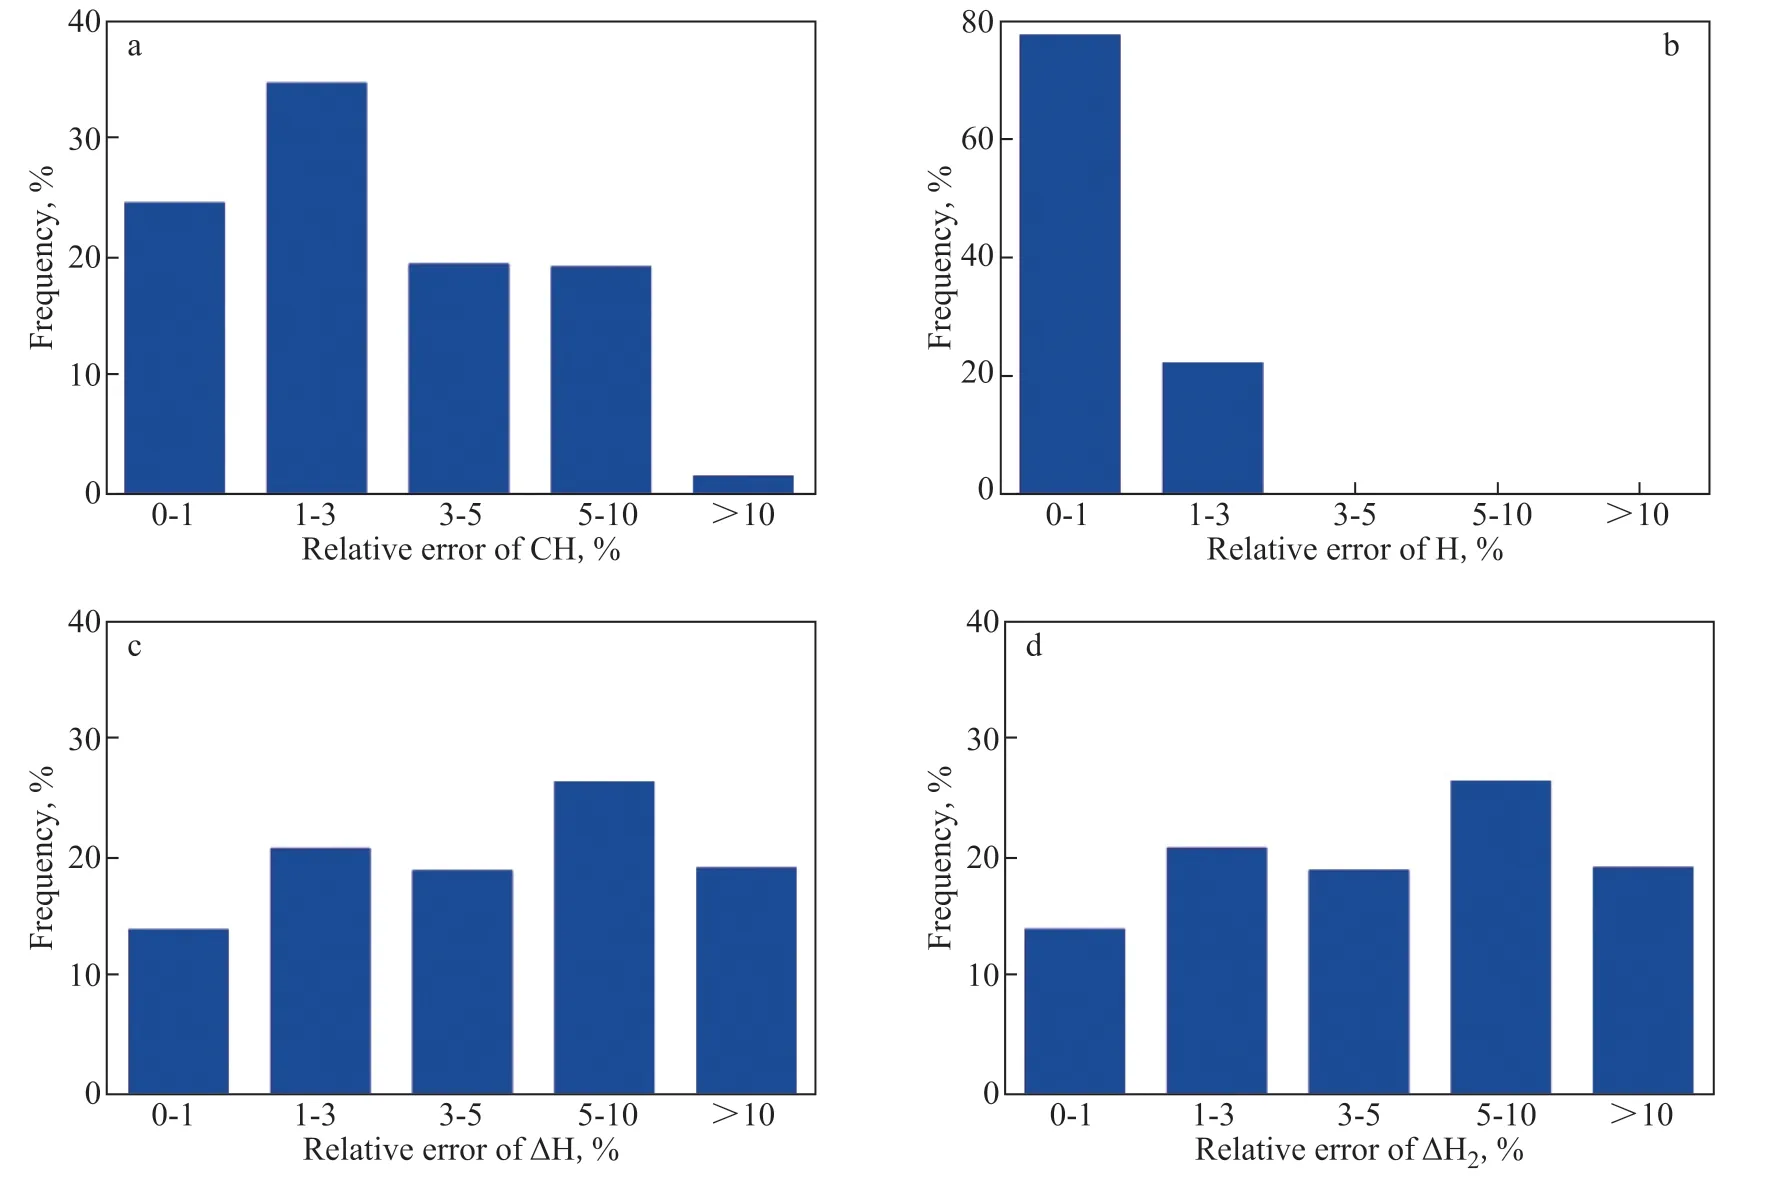
Figure 11 Frequency vs. relative errors of CH (a), H (b), ∆H (c), and ∆H2 (d)
6 Conclusions
1) CH and CH2are considered as pseudo-components, and their contents can be varied by changing the contents of C and H. The HDCH reaction was employed to simulate the change from CH to CH2, and the obtained kinetic model of the HDCH reaction has high accuracy.
2) The model curve of the HDCH activity with M/M0was calculated by the active-region-migration model withR2of 0.8871. The obtained parameters of the curve areh= 10.5,b= 19.0, andc= 0.48. The obtained HDCH activity model has high accuracy and the frequency of >10% relative errors is less than 1% for CH and H.
3) Here, the hydrogen consumption model can be considered as the coupling of the HDCH kinetic model and HDCH deactivation model. When using the hydrogen consumption model to calculate the hydrogen consumption, the calculated data well match the real data in case 2 compared to case 1. Thus, it is better to adjust the hydrogen consumption model when calculating the hydrogen consumption on the running of the residue hydrotreating plant.
Nomenclature
a− catalyst or reaction activity;
A0− pre−exponential factor;
b− influence factorbof diffusion coefficient at SOR;
c− influence factorcof diffusion coefficient on the whole run;
E− activation energy, kJ/mol;
h− parameter used to characterize the compounded effect of catalyst activity and diffusion coefficient;
k− reaction rate constant;
k0− initial reaction rate constant at SOR;
LHSV − liquid hourly space velocity, h−1;
M0− upper amount of the deposited metal at the semi−diameter of particle;
M− amount of the deposited metal at the semi−diameter of “dead region”;
p− partial pressure of hydrogen, MPa;
p0− unit of pressure,p0=1.0MPa;
r− radial position of the arbitrary active site in the active region;
rZ– semi-diameter of the “dead region”;
R– semi-diameter of the cylindrical catalyst particle;
R2− goodness−of−fit ;
∑R2− variance;
t− residence time (t= 1/LHSV), h;
T− reaction temperature, K;
T0− initial reaction temperature, K;
wC− weight content of C element in residue or
hydrotreated residue, %;
wH− weight content of H element in residue or hydrotreated residue, %;
wCH− weight content of CH pseudo-component in residue or hydrotreated residue, %;
wCH,0− weight content of CH pseudo-component in residue, %;
wCH2− weight content of CH2pseudo-component in residue or hydrotreated residue, %;
X− dimensionless radial position of the arbitrary active site in the active region;
Y− dimensionless concentration of reactant molecule in the active region of the catalyst particle;
z− dimensionless semi-diameter of “dead region”;
α− reaction index of pressure.
Acknowledgments:This work was financially supported by the SINOPEC Research Program (Grant KL20009 and 121028-2).

- 中国炼油与石油化工的其它文章
- Activated Carbon from Rice Husk with One-Step KOH Mechanical Mixing Activation as Adsorbent for Treating Phenolic Wastewater
- Removal of Basic and Non-Basic Nitrogen Compounds from Model Oil by FeCl3-Based Ionic Liquids
- Selection of Extraction Solvents for Bitumen from Indonesian Oil Sands through Solubility Parameters
- Synthesis of Hierarchical Porous Fe2O3/Al2O3 Materials and Study on Catalytic Viscosity Reduction of Heavy Oil
- Effect of Particle Shape on Catalyst Deactivation during 2-Butene and Isobutane Alkylation of Liquid Phase in Fixed-Bed Reactor Using Particle-Resolved CFD Simulation
- Experimental and Numerical Investigation on Erosion Corrosion of the Air Cooler Tube Bundle in a Residue Hydrotreating Unit