
Hydrogenation Behavior of Hydrogen Peroxide in a Microreactor
2022-02-01 04:02ZhuHongweiSunBingJinYanFengJunjieZhaoChenyangYanJunjieJiangJieXuWei
中国炼油与石油化工 2022年4期
Zhu Hongwei; Sun Bing; Jin Yan; Feng Junjie; Zhao Chenyang; Yan Junjie; Jiang Jie; Xu Wei
(1. SINOPEC Research Institute of Safety Engineering Co., Ltd., Qingdao 266071;2. State Key Laboratory of Heavy Oil Processing, China University of Petroleum Qingdao 266580)
Abstract: The hydrogenation of hydrogen peroxide is an unwanted side reaction in the direct synthesis of hydrogen peroxide and remains a problem to solve. The mechanism of this reaction has been studied with batch reactors but the slow heat and mass transfer in batch reactors hindered the understanding of its intrinsic kinetics. In this study, a microreactor is employed to investigate the parameters that influence the hydrogenation reaction, including flow rate, channel length, hydrogen pressure, solvent composition, and initial hydrogen peroxide concentration. The activity of different catalysts was compared and the hydrogenation law was confirmed, providing guiding information to better control the hydrogenation process.
Key words: hydrogenation; hydrogen peroxide; microreactor; hydrogenation decomposition law; catalyst passivation
1 Introduction
Hydrogen peroxide has received increasing attention as a green and benign oxidant because often the only byproduct in the oxidation process is water[1-4]. When used as an oxidant, H2O2is superior to molecular oxygen in terms of safety, reactivity, and selectivity. The main commercial H2O2production process is the anthraquinone (AO) process[5], involving the hydrogenation of anthraquinone to form diol and the subsequent oxidation of anthraquinol to reform anthraquinone, producing H2O2. The complexity of this process and the associated environmental pollution[3,6]make it less attractive than its alternative—the direct synthesis of hydrogen peroxide (DSH) —in certain scenarios[7-8]. The DSH protocol involves several inseparable reactions, as shown in Figure 1[9].
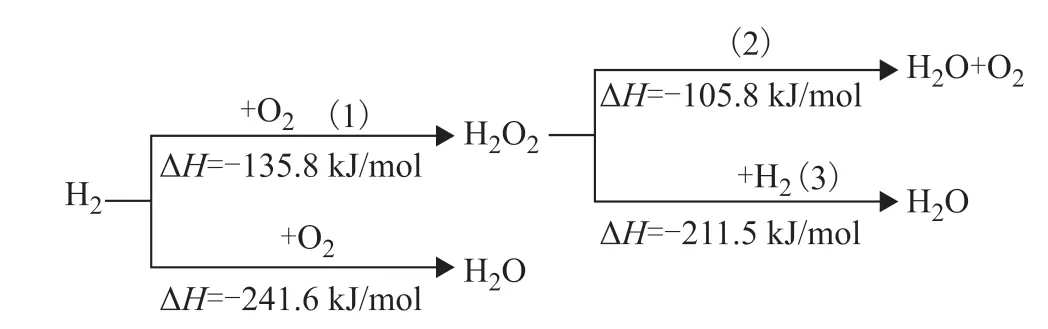
Figure 1 Reaction cascade during the direct synthesis of hydrogen peroxide
For almost all the catalysts reported so far, subsequent destruction of generated H2O2cannot be completely inhibited[9-13], as both reactions are thermodynamically favorable. High pH, high temperature, light, or impurities accelerate the destruction of unstable H2O2. As shown in Figure 1,Compared with the decomposition reaction (2), the hydrogenation reaction (3) is more thermodynamically favorable and accounts for the majority of H2O2destruction in the DSH[14-15]. Therefore it is necessary to understand the hydrogenation mechanism in order to efficiently suppress this side reaction in the DSH.
In this study, the hydrogenation process is investigated using a microreactor for the first time. The small dimensions of the microreactor enable rapid mass and heat transfer, and could provide information on the hydrogenation decomposition law that more accurately represents the reaction’s intrinsic kinetics[16]. Microreactor is also an attractive candidate to perform the DSH reaction from the safety point of view[17-18]. The effects of different catalysts, catalyst passivation times, lengths of microchannels, liquid flow rates, hydrogen pressures, initial H2O2concentrations, and solvent compositions are studied systematically, and a hydrogenation decomposition law is established and validated.
2 Experimental
2.1 Preparation of the catalyst
Active carbon (AC) and aluminum were supplied by Zhang’s Group of Chengdu Organic Chemicals Co. Ltd., Chinese Academy of Sciences, Chengdou, China. Two types of carbon material, labeled as carbon fibers (CF) and carbon nanotubes (CNT), were purchased from SDU Tianwei Advanced Materials Co., Ltd., with a specific surface area of 1000 m2/g. Pd supported catalysts were synthesized using the excessive impregnation method, and the loading amount was 1%. The particle size of the above catalytic materials was adjusted to between 180 μm and 210 μm by grinding with a mortar.
2.2 Microreactor fabrication and setup
The microreactor was assembled from two pieces of Polymethyl methacrylate (PMMA), with each size of 60 mm × 60 mm × 30 mm (width × length × thickness). The lower layer of PMMA was machined according to a channel structure that was drawn in advance, and the upper piece was used as a cover plate. The reaction channel was covered with catalyst materials in advance, and the width and depth of the channel were both 800 μm. To prevent the catalyst from being washed out, the size of the channel was designed to be 800 μm (width) and 150 μm (depth) at the end of the reaction channel. The reactor also included a hydrogen inlet, a liquid inlet, and an outlet. The reaction test system consisted of a hydrogen cylinder, a hydrogen mass flowmeter, a liquid phase pump, a back pressure valve, a product collection tank, a dilution gas cylinder, and a mass flowmeter (Figure 2). The experimental conditions were as follows: the liquid flow rate ranged from 0.01 to 0.2 mL/min; the hydrogen flow rate was 8 mL/min; the back pressure ranged from 0 to 0.5 MPa; the temperature was kept at ambient temperature (25 ºC).
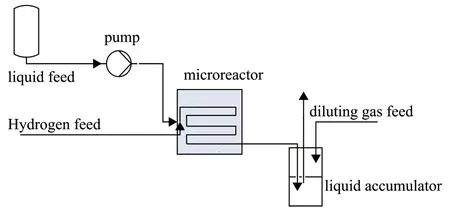
Figure 2 Experimental setup for H2O2 hydrogenation test
2.3 Characterization and analysis
The concentration of hydrogen peroxide in the product was determined by titrating against Na2S2O3, and the decomposition conversionX(%) of hydrogen peroxide and the total conversionY(%) of H2O2were calculated as follows:

whereCxis the concentration of H2O2at timexandC0is the initial H2O2concentration.
The concentration of H2O2was determined as:
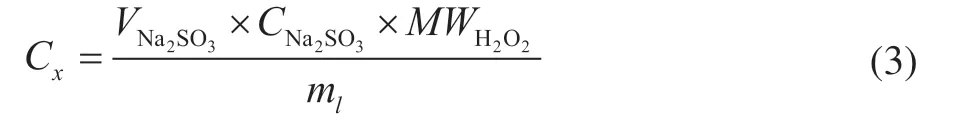
whereVNa2SO3is the volume of Na2SO3consumed,CNa2SO3is the concentration of Na2SO3,MWH2O2is the molecular weight of H2O2andmlis the volume of sample for measurement.
3 Results and Discussion
3.1 Effect of catalyst passivation
The preloaded catalyst in the packed bed was exposed to 1% H2O2and its catalytic activity change with time was monitored by measuring the H2O2conversion rate. The activity remained constant for the first 20 min, then showed a dramatic drop from 100% to around 50% at 30 min, followed by a continuous decrease,and dropped to about 30% at 180 min (Figure 3). A similar phenomenon was observed in a previous study[11], which may be attributed to the sub-surface oxidation of palladium by H2O2or the formation of a hydrogen palladium solid solution by hydrogen and palladium[19-20]. Herein, we define this process as “passivation”.
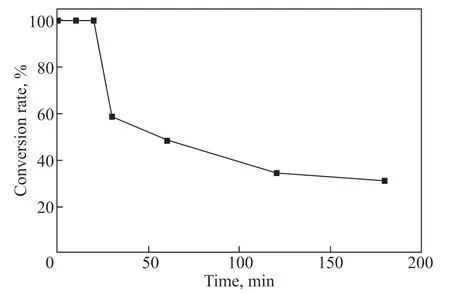
Figure 3 The conversion rate of H2O2 over time
3.2 Effect of different catalyst supports
Different catalyst support materials, including AC, CF, CNT, and Al2O3, were tested in fresh and passivated states. It was obvious that the existence of palladium is crucial for catalyzing the hydrogenation reaction: catalysts with supported Pd showed significantly higher activity than the supporting material itself. Among all the supporting materials, AC was the most active while Al2O3was the least active. The passivation process had a strong effect on Pd/AC, AC, CNT, and Pd/Al2O3, and a weak effect on CF and Al2O3(Table 1). The catalyst supports with low initial catalytic activity do not undergo passivation. All of the catalysts loaded with palladium can undergo the passivation process. We speculate that some changes may occur to the palladium metal as the reaction proceeds which may be due to oxidation[21-22]or the formation of hydrogen palladium solid[19-20].
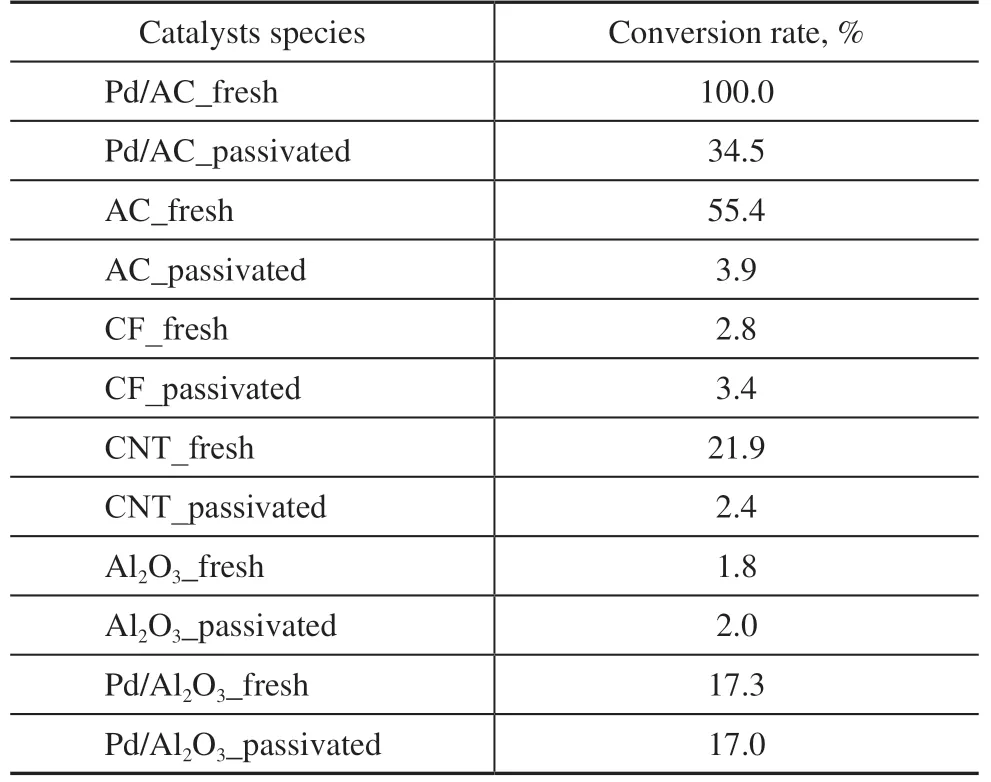
Table 1 The conversion rate of H2O2 on catalysts or supports
3.3 Effect of channel length
When using the same flow rate, the longer the channel, the longer the contact time between the reagents and the catalyst, and the higher the possibility of H2O2being hydrogenated. Four different channel lengths were tested and a linear increase in conversion rate with channel length was observed (Figure 4,R2= 0.9991). Considering that the hydrogenation reaction is fast, we can conclude that H2O2is in excess compared with the active binding sites on the catalyst. The number of active sites increases linearly with the channel length, which explains the linear increase of conversion rate with channel length that was observed in our results.
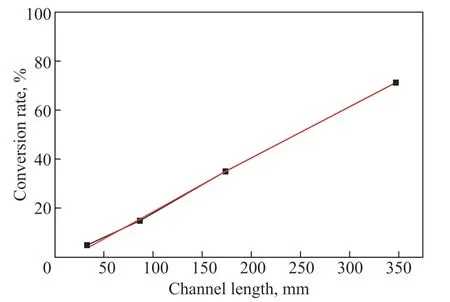
Figure 4 The conversion rate of H2O2 with different channel lengths
It is noteworthy that besides the hydrogenation reaction, the decomposition reaction takes place simultaneously and could not be isolated. However, in the presence of hydrogen, the hydrogenation process is thermodynamically more favorable and is the dominant reaction[14-15]. We also reached the same conclusion in our laboratory. We measured the oxygen content at the outlet of the reactor, and the ratio of the decomposition reaction to the hydrogenation reaction was found to be approximately 1:30. Therefore, in this work the contribution of the decomposition reaction was neglected.
3.4 Effect of liquid flow rate
Similar to the effect observed for channel length, altering the liquid flow rate changed the contact time between the reagents and the catalyst. We assumed that the lower the liquid flow rate was, the more time there was for the reagents and catalyst to collide and react, allowing a higher conversion rate to be reached. The experimental results confirmed our hypothesis—when the flow rate was lower than 0.05 mL/min, the reaction went to completion; when the flow rate exceeded 0.05 mL/min, the conversion rate dropped as the flow rate increased (Figure 5(a)). By varying the liquid flow rate, we were able to obtain the hydrogenation decomposition law for this reaction in a plug flow reactor, as presented in equation (4).

where,Vis the volume of the reaction channel,qis the flow rate,Xis the conversion, andcis H2O2the concentration.Xwas plotted againstV/qfor differentq(Figure 5(b)), where the slope at each point represents –r/c0. Assuming the hydrogenation reaction is first order, thus:

Therefore –r/c0should be linear to (1 −X), withkbeing the slope. As shown in Figure 6b, theR2for a linear fit is 0.97, validating the assumption of a first-order reaction. Therefore we concluded that the H2O2decomposition is first order with a rate constant of 0.446 min−1. The line did not go through the origin, indicating that this model might not apply whenXis high.
3.5 Effect of hydrogen pressure
The hydrogen pressure determines both the local concentration of hydrogen molecules in the gas phase and the solubility of hydrogen in the liquid phase. Therefore, we assumed that higher hydrogen pressure could lead to a higher conversion rate as the reactant concentration increased. This assumption was then validated by the experiments (Figure 6). Although the slope of the curve dropped as the hydrogen pressure increased, it remained positive for all conditions, suggesting that higher pressure helps to convert more hydrogen peroxide into water.
3.6 Effect of initial H2O2 concentration
As the number of active sites on the catalysts was fixed, there is a maximum hydrogenation capacity for the loaded catalyst in the microreactor. We anticipated the existence of an upper limit for the amount of converted hydrogen peroxide, which correlates to the amount of available binding sites on the catalyst. This upper limit was determined through our experiments to be around 0.50% hydrogen peroxide. While the percentage conversion decreased with the initial H2O2concentration (Figure 7(b)), the total conversion of H2O2kept increasing to 0.477%. Further increasing the initial concentration would not significantly improve the conversion.
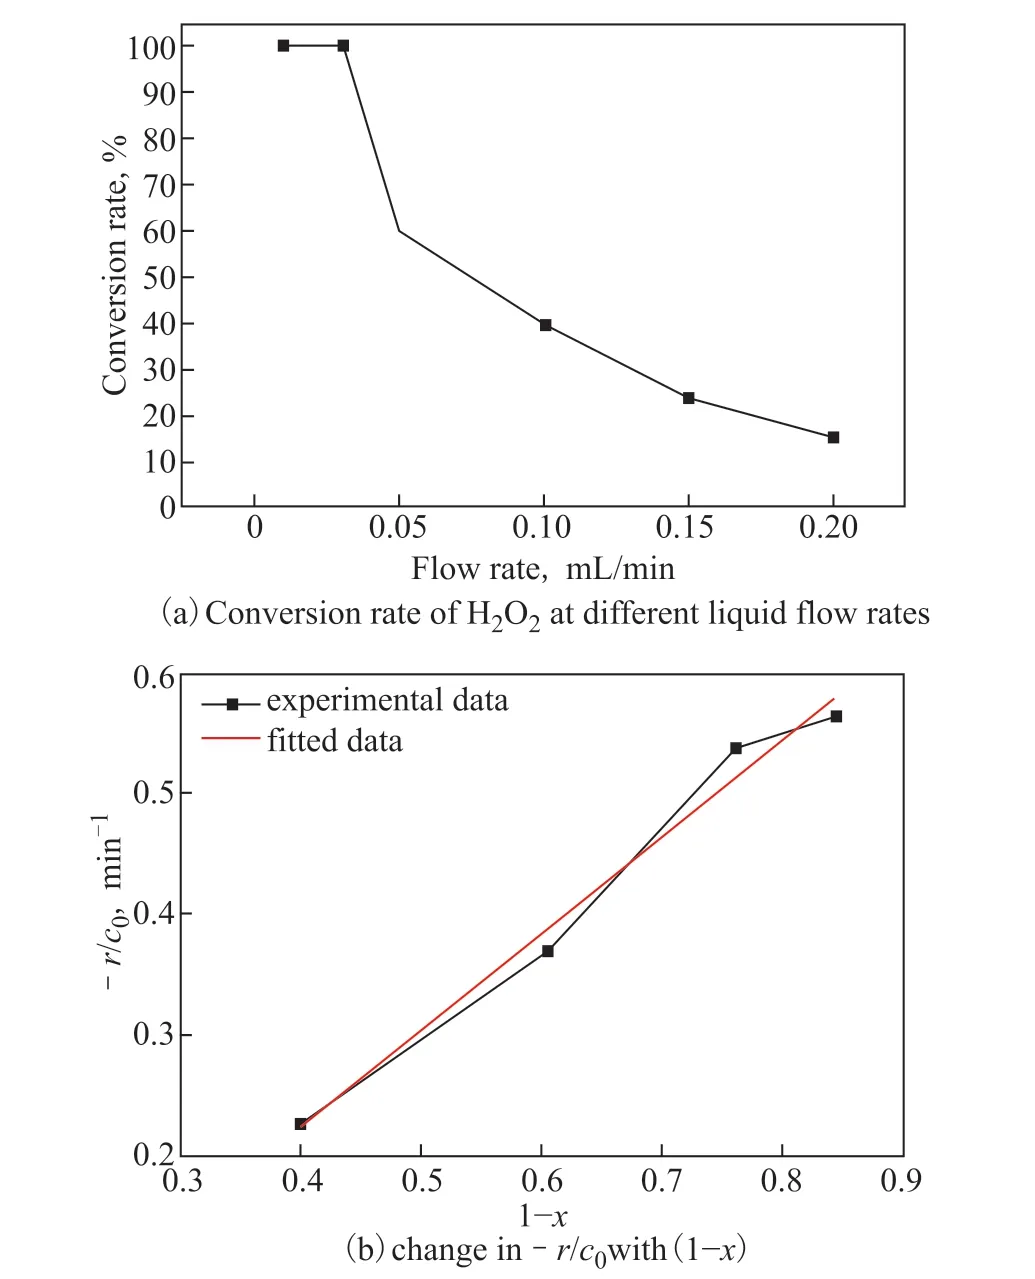
Figure 5 (a) Conversion rate of H2O2 at different liquid flow rates and (b) change in –r/c0 with (1 − X)
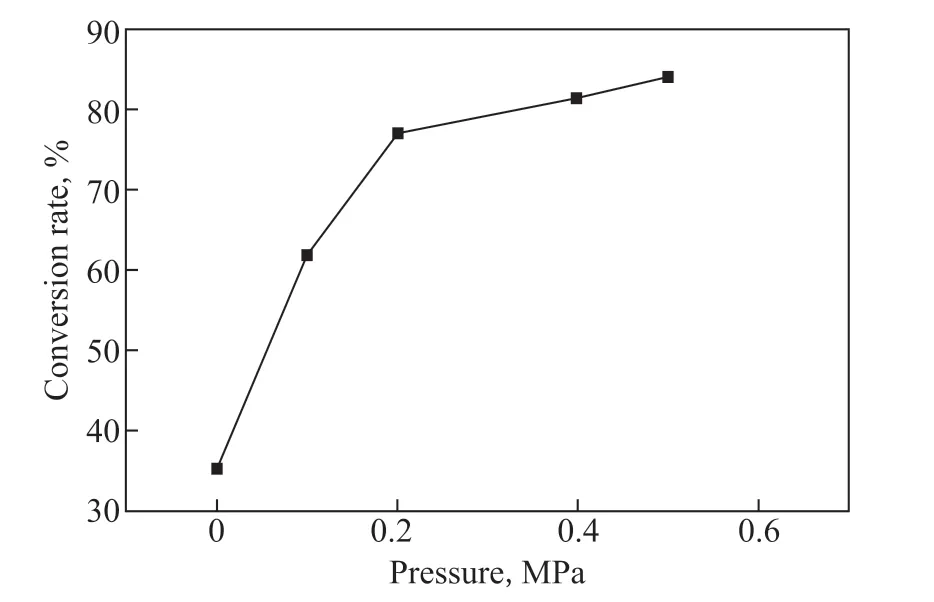
Figure 6 The conversion rate of H2O2 at different hydrogen pressures
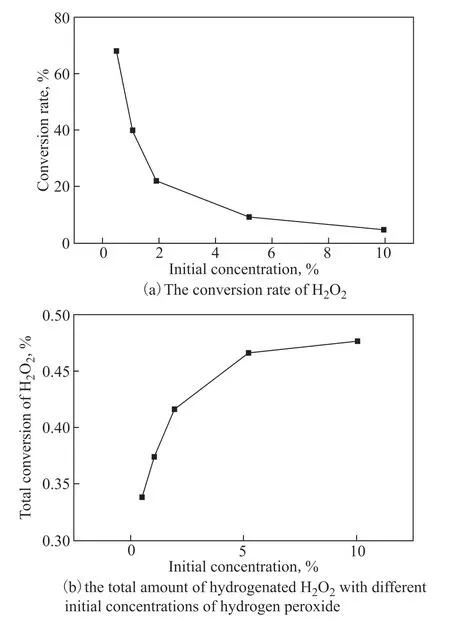
Figure 7 (a) The conversion rate of H2O2 and (b) the total amount of hydrogenated H2O2 with different initial concentrations of hydrogen peroxide
3.7 Effect of solvent composition
We compared the hydrogenation behavior in solvents with different compositions and noted a few interesting phenomena, with the results shown in Table 2. As reported in other studies[23-24], the addition of halides dramatically inhibits the hydrogenation reaction by poisoning the active sites on the catalyst. We observed a similar effect, whether Br−or Cl−was used (No. 2 and No. 3 vs. No. 1). Moreover, a higher halide concentration led to a stronger inhibiting effect (No. 3 vs. No. 4). Compared with H2SO4, H3PO4showed a weaker inhibiting effect (No. 5 vs No. 2), but a higher concentration of acid had a stronger suppressive effect (No. 6 vs No. 5). A proper amount of organic solvent would help to suppress the hydrogenation process by blocking the most reactive Pd sites responsible for HO–OH bond breaking. However when the percentage of ethanol was too high, the size of the gas bubbles and especially the surface tension of the solvent got smaller, so the removal of the H2O2hydrogenation product was accelerated, facilitating the hydrogenation process (No. 7 vs No. 2).
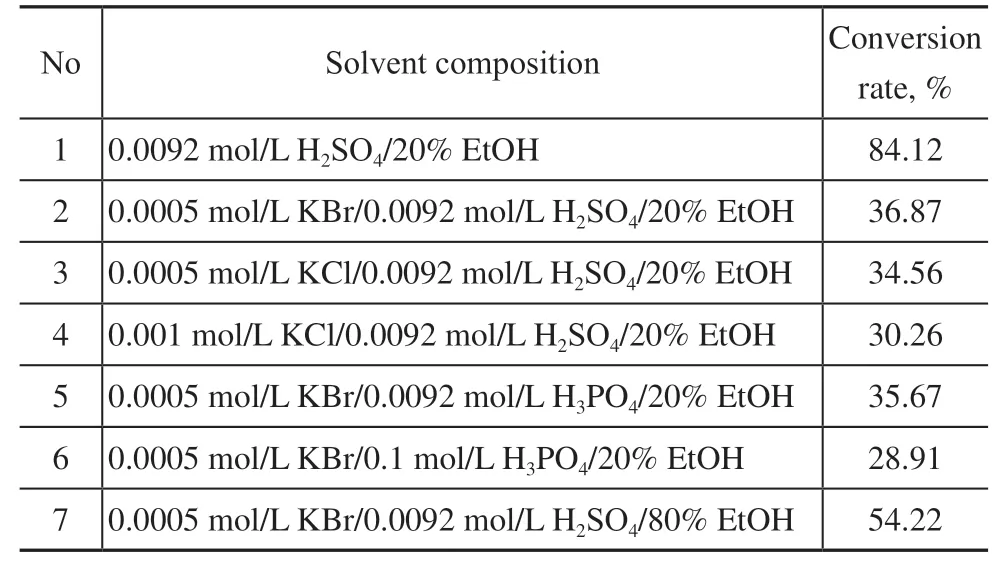
Table 2 The conversion rate of H2O2 with different solvent compositions
4 Conclusion
The hydrogenation of hydrogen peroxide is both an effective way to remove excess hydrogen peroxide and an undesired reaction to avoid during the DSH process. In this work, we systematically studied the influence of a variety of factors and drew the following conclusions: 1) increasing the contact time between the catalyst and the reactant by increasing the channel length or decreasing the flow rate leads to higher conversion. 2) Almost all the tested catalysts showed reduced activity after “passivation,” among which the fresh Pd/AC catalyst had the highest catalytic activity. 3) Increasing the concentration of hydrogen or hydrogen peroxide increased the amount of hydrogenated hydrogen peroxide, although not linearly. 4) The solvent composition played an important role in the inhibition of the hydrogenation reaction.
This study provides information for controlling the H2O2hydrogenation process. After obtaining a basic understanding of this process, exploring catalysts with higher and lower hydrogenation activity is the necessary next step. In addition, we believe that by utilizing the fast mass transfer phenomenon in microreactors, it will be possible to better manipulate the process to achieve specific goals.
Acknowledgments:This work was supported by the National Natural Science Foundation of China (Grant No. 21908249 and No. 22208382). We acknowledge the support received from the Chinese State Key Laboratory of Chemical Safety.
- 中国炼油与石油化工的其它文章
- Synthesis and Evaluation of Microporous Metal Organic Frameworks for Light Hydrocarbon Adsorption
- Selection of Extraction Solvents for Bitumen from Indonesian Oil Sands through Solubility Parameters
- Synthesis of Hierarchical Porous Fe2O3/Al2O3 Materials and Study on Catalytic Viscosity Reduction of Heavy Oil
- Activated Carbon from Rice Husk with One-Step KOH Mechanical Mixing Activation as Adsorbent for Treating Phenolic Wastewater
- Effect of Particle Shape on Catalyst Deactivation during 2-Butene and Isobutane Alkylation of Liquid Phase in Fixed-Bed Reactor Using Particle-Resolved CFD Simulation
- Experimental and Numerical Investigation on Erosion Corrosion of the Air Cooler Tube Bundle in a Residue Hydrotreating Unit