
Preparation of a TiO2@o-Vanillin@TEOS-APTES Nanocontainer and Its Anti-Corrosion Performance on Steel
2022-02-01 04:02WuYaqiXingJinjuanQianJianhuaLiuLin
中国炼油与石油化工 2022年4期
Wu Yaqi; Xing Jinjuan; Qian Jianhua; Liu Lin
(1. Liaoning Province Key Laboratory for Surface Functionalization of Titanium Dioxide Powder, College of Chemical and Material Engineering, Bohai University, Jinzhou 121013, Liaoning, China; 2. Liaoning Shihua University College of Chemistry and Materials Science Fushun, 113006, China)
Abstract: A TiO2@o-vanillin@TEOS-APTES nanocontainer was prepared by an experimental process in which, firstly, 2-hydroxy-3-methoxybenzaldehyde (o-vanillin) was loaded in a TiO2 container to obtain TiO2@o-vanillin. Then, TiO2@o-vanillin was encapsulated by tetraethyl orthosilicate (TEOS). Finally, 3-aminopropyl triethoxysilane (APTES) was used to modify the obtained sample. The morphology, structural phase and thermal stability of the TiO2@o-vanillin@TEOS-APTES nanocontainer were analyzed using scanning electron microscopy (SEM), energy dispersive spectroscopy (EDS), Fourier transform infrared spectroscopy (FTIR), X-ray diffractometry (XRD) and thermal gravimetric analysis (TG). The release rate of o-vanillin was investigated using an ultraviolet-visible (UV-vis) spectrometer. The anti-corrosion performances of the epoxy, epoxy@o-vanillin and epoxy@TiO2@o-vanillin@TEOS-APTES coatings on steel sheets were evaluated using an electrochemical method and scarification experiments. The results showed that the impedance value of the epoxy@TiO2@o-vanillin@TEOS-APTES coating was two orders of magnitude higher than that of the blank epoxy coating, and one order of magnitude higher than that of the epoxy@o-vanillin coating. The maximum inhibition rate of the epoxy@TiO2@o-vanillin@TEOS-APTES coating on the steel can reach 97.3%. The scarification experiments confirmed that the epoxy@TiO2@o-vanillin@TEOS-APTES coating had the best anti-corrosion performance.
Key words: TiO2, o-vanillin; anti-corrosion; epoxy; nanocontainer
1 Introduction
The corrosion of metal materials not only causes huge economic losses, but also leads to catastrophic accidents[1-10]. To date, the main anti-corrosion methods worldwide include electrochemical protection, addition of a corrosion inhibitor and protective layer covering, among which, the use of organic compounds as coatings on the metal is considered to be one of the major strategies employed[11-14]. Epoxy is a type of organic polymer material with a stable structure, high–low temperature resistance, strong adhesion, anti-corrosion properties and low price[15-19]. However, as the environmental problems in industry have become more and more serious, it has been difficult for the anti-corrosion effects of the traditional epoxy coating to meet the needs of industrial development[20-22]. When the barrier of the epoxy coating is damaged, the corrosive species (H2O, O2, Cl−, H+) in the environment can easily penetrate into the metal surface through the defects in the coating[23]. One of the methods for improving the anti-corrosion performance of epoxy is incorporating the inhibitor directly into the matrix to obtain a self-healing coating[24-25]. However, when the corrosion inhibitor is directly mixed with the coating, the release of the inhibitor can’t be controlled, which is unfavorable to improve the anti-corrosion performance[22,26].
In recent years, the encapsulation of inhibitors in containers (GO, TiO2, SiO2, CNT etc.) has been developed to solve the above-mentioned problems[27-28]. For example, Liu et al.[29]used attapulgite as a reservoir for loading a benzotriazole inhibitor and then dispersed it in a waterbased epoxy coating to protect carbon steel. Guo et al.[11]synthesized ZIF-7@BTA nanoparticles and distributed them in a polymer matrix to prepare a self-healing anticorrosion coating which improved the anti-corrosion performance in an acidic system. Roma Raj et al.[30]used hydroxyapatite particles (CE-HAP) for loading cerium and applied them to polyolefin protective coatings on a carbon steel surface.
In order to enhance the anti-corrosion performance of the epoxy coating, pH-responsive intelligent containers are designed in this work. The hollow TiO2material, which was available, odorless, low cost, non-toxic, chemically stable and UV-resistant[31-35], was used as a carrier to loado-vanillin inhibitor to obtain TiO2@o-vanillin. TiO2@o-vanillin was further modified by tetraethyl orthosilicate (TEOS) and 3-aminopropyl triethoxysilane (APTES) to obtain a TiO2@o-vanillin@TEOS-APTES nanocontainer. The TEOS film can prevent the release ofo-vanillin under normal conditions, and provide active reaction sites for APTES amination, which improved the solubility of the nanocontainer in the epoxy coating. Because of the change of pH, the TEOS film could be gradually destroyed, which allowedo-vanillin to be slowly released from the TiO2@o-vanillin@TEOS-APTES nanocontainer. Electrochemical impedance spectroscopy (EIS) results confirmed that the epoxy@TiO2@o-vanillin@TEOS-APTES coating can efficiently prevent the steel sheet from corroding.
2 Experimental
2.1 Materials and instruments
Sodium fluoride (NaF) and titanium tetraisopropanol (TTIP) were purchased from Tianjin Yongda Chemical Reagent Co., Ltd. Polyvinylpyrrolidone (PVP), TEOS, APTES ando-vanillin were obtained from Shanghai Aladdin Industrial Corporation. All the reagents in this experiment were used directly without further purification.
The morphologies and components of the samples were analyzed using SEM-EDS (Japan Hitachi Co., Ltd, S-4800). The crystal phases of the samples were confirmed using XRD (Japan Rigaku Co., Ultima IV). FT-IR was carried out on a Scimitar 2000 FT-NIR spectrometer (American Agilent Technology Co., Ltd). UV-vis measurements were recorded on a UV-2550 spectrometer (Japan Shimadzu Corporation). Thermal gravimetric (TG) experiments were carried out using a Pyris Diamond thermo-analyzer (American PerkinElmer Corporation) at a heating rate of 10 °C/min under a nitrogen atmosphere from room temperature to 900 °C. The hydrophilicity of the coating was tested using contact angle measurement (Date Physics Instruments GmbH, OCA15EC). The coating thickness was measured using a magnetoresistance thickness gauge (Shanghai Huayang Testing Instrument Co., Ltd, HCC-24).
2.2 Fabrication of the TiO2@o-vanillin@TEOSAPTES nanocontainer
The TiO2@o-vanillin@TEOS-APTES nanocontainer was prepared according to the following procedures.
2.2.1 Preparation of TiO2
NH3•H2O (0.42 mL), H2O (0.91 mL) and TTIP (5 mL) were added to a mixed solution (250 mL) containing acetonitrile (100 mL) and ethanol (150 mL) under magnetic stirring for 6 h. Then, the sample was sequentially centrifuged, washed twice with ethanol and deionized water, and vacuum dried (the vacuum degree was −0.1 MPa) for 12 h at 60 °C. TiO2powder was then obtained for use.
2.2.2 Preparation of hollow TiO2
The collected TiO2sample (1.2 g) was dispersed in deionized water (30 mL), then 0.104 g of NaF and 0.12 g of PVP were added one after another, and the suspension was stirred for 2 h. The suspension was transferred to a 40 mL autoclave and hydrothermally treated at 110 °C for 4 h. Then, the samples were centrifuged and vacuum dried for 24 h at 60 °C, and hollow TiO2particles were obtained[36].
2.2.3 Preparation of TiO2@o-vanillin
o-vanillin (0.5 g) was added to 50 mL of ethanol mixture solution containing hollow TiO2particles (0.5 g), which was continuously stirred for 20 h. The obtained sample was separated by centrifugation and vacuum dried at 60 °C for 12 h, and TiO2@o-vanillin particles were obtained.
2.2.4 Preparation of TiO2@o-vanillin@TEOS-APTES
TiO2@o-vanillin (0.4 g) was added to 40 mL of ethanol mixture solution, which contained H2O (10 mL) and NH3•H2O (0.5 mL). Then, TEOS (0.5 mL) was added drop by drop.
The formation of the TEOS film is illustrated in Figure 1.
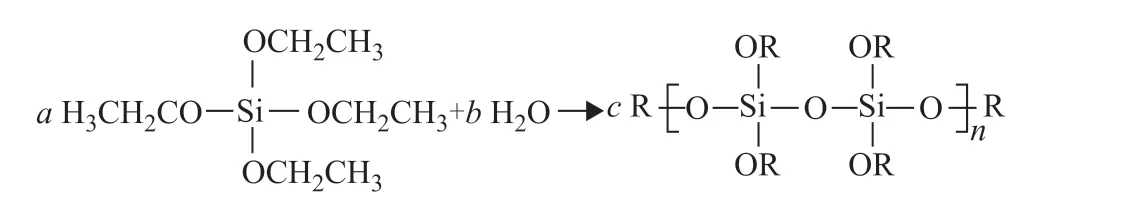
Figure 1 Illustration of the formation of the TEOS film
After stirring the mixture for 12 h, 0.5 mL of APTES was added, and the mixture was continuously stirred for 24 h. Finally, TiO2@o-vanillin@TEOS-APTES was obtained by centrifugation and vacuum dried for 24 h at 80 °C. The fabrication of the TiO2@o-vanillin@TEOS-APTES nanocontainer is schematically illustrated in Figure 2.
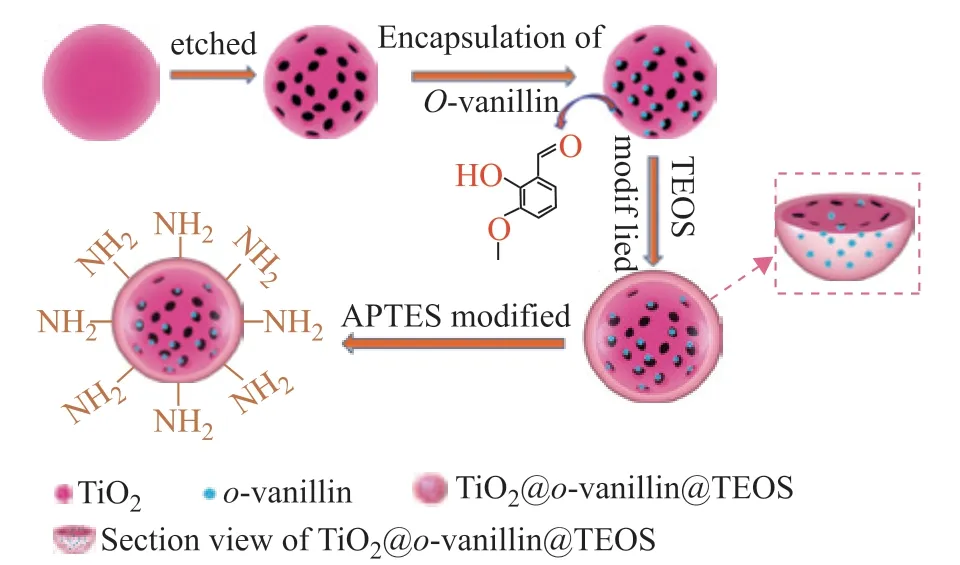
Figure 2 Schematic illustration of the TiO2@o-vanillin@TEOS-APTES nanocontainer
2.3 Preparation of the epoxy, epoxy@o-vanillin, and epoxy@TiO2@o-vanillin@TEOS-APTES coatings
In this experiment, A3 steel sheets were selected as the substrate materials. Before the experiment, the substrates were polished with SiC papers (#800, #1000, #1500, #2000). Then, the substrates were immediately put into a beaker containing 30 mL of ethanol, treated by ultrasonication for 5–10 min and dried for use. The as-prepared TiO2@o-vanillin@TEOS-APTES sample was re-dispersed in epoxy resin emulsion (DY-128-50) and continuously stirred for 10 min. Then, the curing agent (DY-175) was added. Meanwhile, the emulsion was coated on the steel sheet using a scraper coater at room temperature and dried at 50 °C for 24 h. The 2% TiO2@o-vanillin@ TEOS-APTES sample was added to the epoxy coating. For comparison, blank epoxy and epoxy@o-vanillin coatings were also prepared. The thicknesses of the prepared coatings were measured using a magneto-resistance thickness gauge, and were all about 40±2 μm.
2.4 The release rate of the o-vanillin from the nanocontainer
The pH-controlled release rate ofo-vanillin from the TiO2@o-vanillin@TEOS-APTES nanocontainer was tested using UV-vis measurements. 50 mg of TiO2@o-vanillin@TEOS-APTES was added to 50 mL of water at different pH values (pH = 7, 4 and 2) at room temperature. The solution was stirred at a low speed using a magnetic stirrer. 3 mL of the solution was taken out at 30, 90, 150, 210, 330, 450, 1200 and 1440 min and the wavelength range for UV-vis measurements was 200–500 nm.
2.5 Electrochemical measurements
Electrochemical measurements were performed using a PGSTAT302N electrochemical workstation (Switzerland Vantone China Co., Ltd) at room temperature. A saturated calomel electrode was used as the reference electrode, a platinum (Pt) plate served as the counter electrode, and the steel sheet was employed as the working electrode with an exposed surface area of 1×1 cm2. EIS measurements were carried out with a frequency range of 105–10−2Hz. The test coatings were immersed in 3% NaCl solution. Potentiodynamic polarization measurements were carried out from low potential to high potential at a scan rate of 0.5 mV/s.
2.6 Scarification test
The corrosion resistance was evaluated using the scratch test. Before the steel sheet was immersed in 3% NaCl solution, cross scratches were applied manually on the surface of the coating using a carbide tip.
3 Results and Discussion
3.1 Characterization of TiO2@o-vanillin@TEOSAPTES
The morphologies of the etched TiO2and TiO2@o-vanillin@TEOS-APTES were observed using SEM. As seen from Figure 3, the etched TiO2(Figure 3a–b) existed as urchinlike particles with diameters of 400–500 nm. The structures of hollow cavities can be observed from Figure 3c, while the TiO2@o-vanillin@TEOS-APTES particles were spheroid or nearly spherical with a smooth surface (Figure 3d–f). When combined with EDS analysis (Figure 3g–h), the silica layer coated on the surface of the TiO2was preliminarily confirmed and it was observed that the elements C, O, Ti and Si were evenly dispersed in the samples.
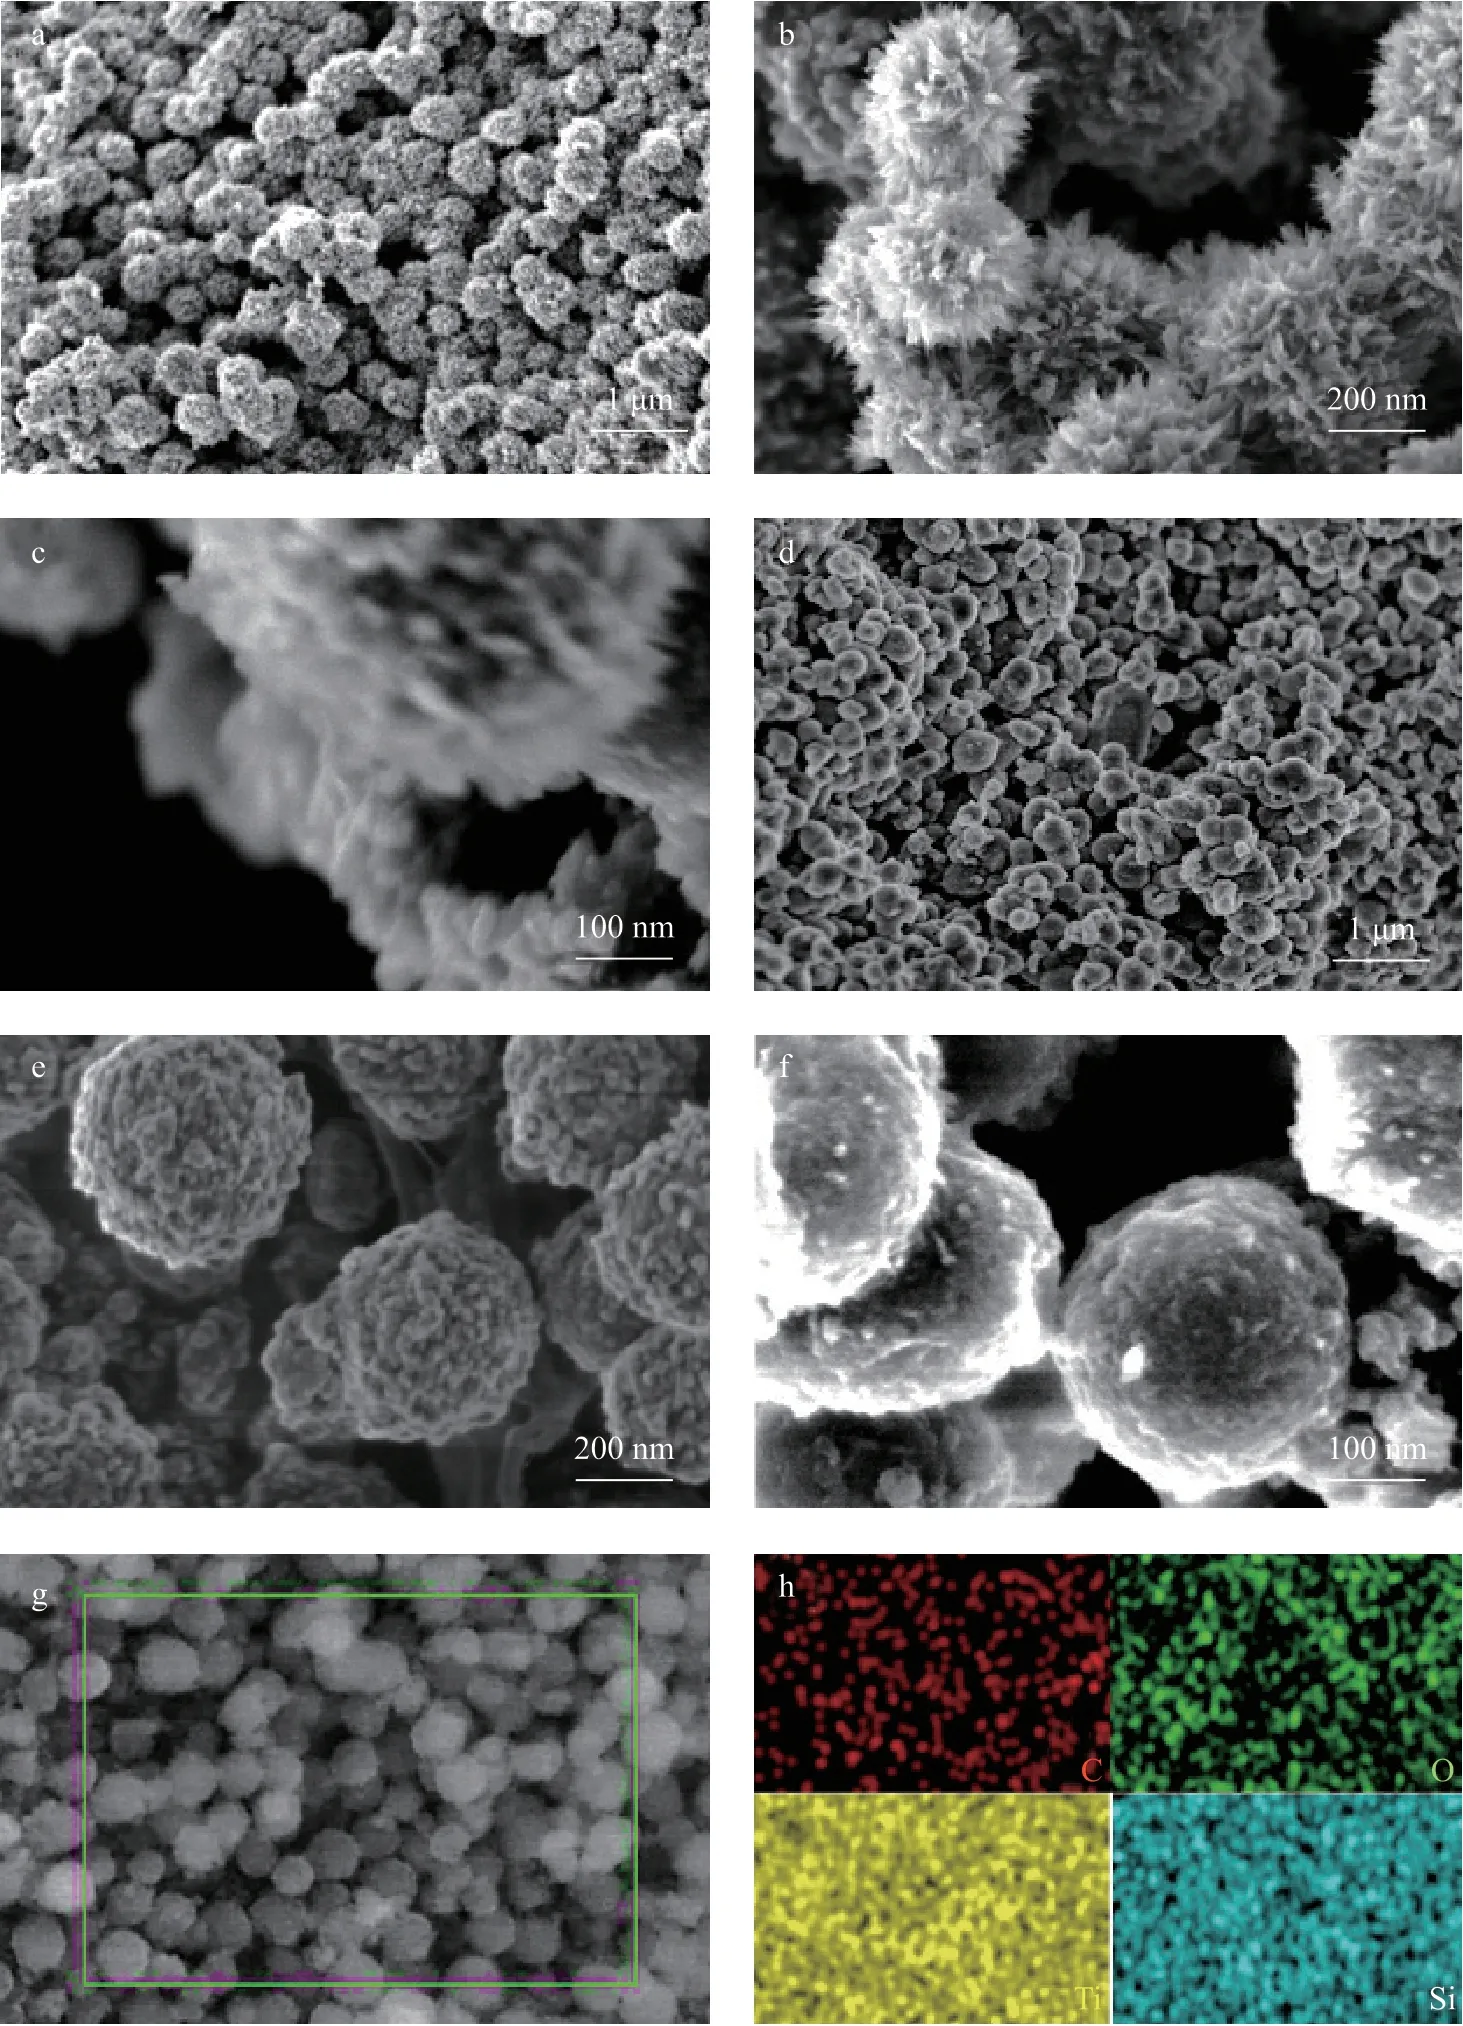
Figure 3 SEM images of the etched TiO2 (a–c) and TiO2@o-vanillin@TEOS-APTES (d–f) particles; EDS analysis of TiO2@o-vanillin@TEOS-APTES (g–h)
The phase structures of TiO2and TiO2@o-vanillin@TEOS-APTES were analyzed using XRD. The characteristic peaks of the two samples (Figure 4a) at 25.1°, 38.2°, 47.5°, 54.4° and 62.8° are clear, corresponding to the (101), (004), (200), (105) and (204) crystal planes of anatase TiO2(PDF #21-1272), respectively. The diffraction peaks of the TiO2@o-vanillin@TEOS-APTES nanocontainer were less intense than those of TiO2, but the positions of the diffraction peaks were the same, indicating that the crystal structure of the TiO2@o-vanillin@TEOS-APTES nanocontainer was consistent with that of TiO2.
The vibrational bands of TiO2and TiO2@o-vanillin@TEOS-APTES were studied using FT-IR. In the spectrum of TiO2(Figure 4b), two absorption peaks connected with absorbed water and hydroxyl groups on the TiO2surface were observed at 3407 and 1626 cm−1[37-38]. The band at 1430 cm−1corresponds to the distortion of CH3and CH2, which indicates the presence of residual organic groups in the sample[39-40]. The peak observed at 500–800 cm−1was assigned to the Ti–O vibration. Compared with TiO2, new peaks were observed at 936, 1090 and 1458 cm−1for TiO2@o-vanillin@TEOS-APTES. The peak observed at 936 cm−1was assigned to the Ti–O–Si stretching vibration band[41]. The strong and wide absorbance peak at 1090 cm−1was assigned to the asymmetric stretching vibration of Si–O–Si, demonstrating the condensation reaction between the silanol groups[42-43]. The absorbance peak at 1458 cm−1was assigned to the –C=C– of the aromatic ring in theo-vanillin inhibitor[44-45]. The FTIR results clearly indicated thato-vanillin was encapsulated in the TiO2@o-vanillin@TEOS-APTES nanocontainers.

Figure 4 (a) XRD patterns of TiO2 and TiO2@o-vanillin@TEOS-APTES, (b) IR spectra of TiO2 and TiO2@o-vanillin@TEOS-APTES
3.2 Thermal stability analysis
Figure 5 shows pyrolysis plots of TiO2, TiO2@o-vanillin, TiO2@o-vanillin@TEOS and TiO2@o-vanillin@TEOSAPTES under a flow of nitrogen from room temperature to 900 °C. The four samples (Figs. 5a–d) had different weight losses up toT1, which were attributed to the volatilization of the physically adsorbed water and the residual organic solvent in the sample. The TiO2powder lost a further 9.4% of its weight up toT2, which was caused by the transformation of some of the amorphous TiO2into anatase TiO2. A weight loss of approximately 13.0% was observed for TiO2@o-vanillin at 188–486 °C, which was attributed to the decomposition ofo-vanillin. It can be concluded from Figure 5d that the weight loss of the modified TiO2was significantly decreased, and the residual mass was about 80.5%. The TiO2@o-vanillin@TEOS-APTES sample was completely decomposed at 834 °C. This is a higher temperature than for the other three samples, indicating that the heat resistance of the nano-container was significantly improved when a silica layer existed in the container.
3.3 Release rate of o-vanillin from the TiO2@o-vanillin@TEOS-APTES nanocontainer
In the corrosion medium, the release rate ofo-vanillin is required to be at a suitable speed, which directly impacts the anti-corrosion performance of the functional coating in the long term. Therefore, the release rate ofo-vanillin from the TiO2@o-vanillin@TEOS-APTES nanocontainer was investigated using UV-vis spectroscopy over 1440 min at pH of 2, 4, and 7. An acidic solution was selected, which was mainly because metal corrosion usually leads to a pH decrease in the anodic zone[29]. As shown in Figure 6, when the pH was 7, the release rate ofo-vanillin was relatively low, and only 20.6% ofo-vanillin was released. When the pH was 2, theo-vanillin release rate increased, and approximately 80% was released within 1440 min. The release rate at pH = 4 was about 34%. The differences in the release rate ofo-vanillin were related to the different reaction rates of hydrogen ions and silicon ether, and could be used to makeo-vanillin be released on demand by changing the pH value in the system. When the conditions in the system were mild, the release rate ofo-vanillin from the TiO2@o-vanillin@TEOS-APTES nanocontainer was slower, which could reduce the loss caused byo-vanillin outflow. Meanwhile, the release rate ofo-vanillin increased with a decrease of the pH value when there were strong acidic substances in the system. Additionally, the releasedo-vanillin could form an absorption layer on the damaged metallic surface, protecting the steel sheet from corrosion. Decomposition of the TEOS film could be illustrated by the scheme in Figure 7.
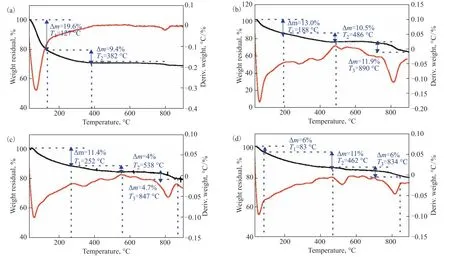
Figure 5 TG curves of TiO2 (a), TiO2@o-vanillin (b), TiO2@o-vanillin@TEOS (c) and TiO2@o-vanillin@TEOS-APTES (d).
When the concentration of H+increased, the degradation rate of the TEOS film increased. In an acidic environment, the charge of the TiO2particles was positive, ando-vanillin could be protonated due to the presence of lone pairs of electrons on the O atoms, benefiting the release ofo-vanillin from the TiO2@o-vanillin@TEOS-APTES containers.
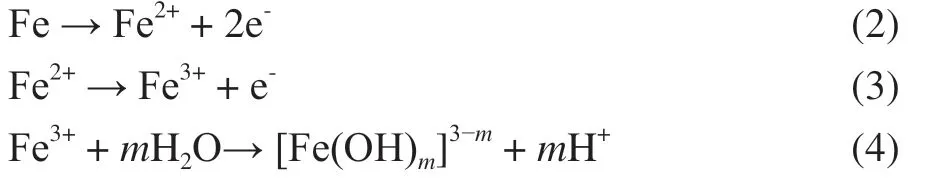
3.4 Potentiodynamic polarization curve measurements
After soaking in 0.3% NaCl solution at different pH values for 6 h, the steel sheet was analyzed using polarization curves. Figure 8 shows potentiodynamic polarization curves of the blank steel sheets in 0.3% NaCl solutions in the absence and presence of TiO2@o-vanillin@TEOS-APTES. The corrosion rate of the steel sheet in the presence of TiO2@o-vanillin@TEOS-APTES was lower than that of the blank sample at the same pH value, and the inhibition rate increased when the pH value was decreased. When the pH was 2, the maximum inhibition rate was 80.7%. The results revealed that the presence of the TiO2@o-vanillin@TEOS-APTES nanocontainer can improve the anti-corrosion performance of the steel sheet. Data related to the potentiodynamic polarization curves are listed in Table 1. The corrosion inhibitor efficiency (η) was calculated using the following equation:
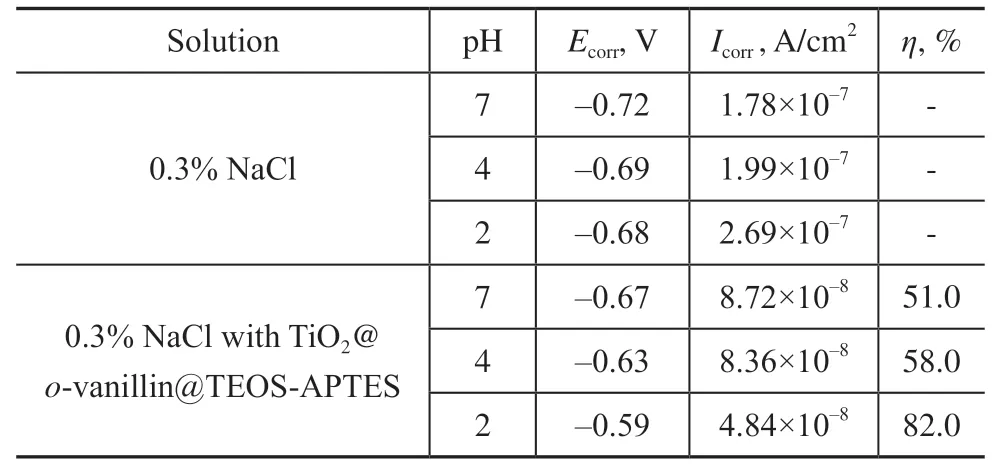
Table 1 Potentiodynamic polarization parameters for the steel sheet in the absence and presence of TiO2@o-vanillin@TEOS-APTES in 0.3% NaCl solutions at different pH values
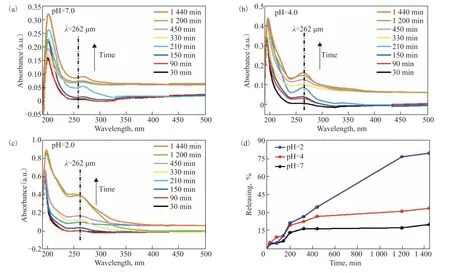
Figure 6 Absorbance curves of the released o-vanillin from the TiO2@o-vanillin@TEOS-APTES containers at different pH values (2, 4 and 7)
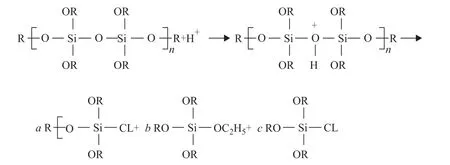
Figure 7 Illustration of the decomposition of the TEOS film

where,IcorrandI´corrrepresent the corrosion current densities of the blank sample and the sample with nanocontainers, respectively.
3.5 Evaluation of the anti-corrosion performances of the epoxy, epoxy@o-vanillin and epoxy@TiO2@o-vanillin@TEOS-APTES coatings
3.5.1 EIS test
The anti-corrosion performances of the epoxy, epoxy@o-vanillin and epoxy@TiO2@o-vanillin@TEOS-APTES coatings on the sheet steel immersed in 3% NaCl solution were investigated using EIS. For the epoxy coating, when the immersion time was increased, the low frequency impedance value decreased from 8.03×10⁵to 1.68×10⁵Ω·cm2(Figure 9a), which meant that the intrusion of the electrolyte will lead to damage of the physical barrier. The value of the low frequency impedance could be used to assess the anti-corrosion performance of the coating. Figure 9b shows that two constants can be obtained from the curves of the phase angle of the epoxy coating. The time constant at low frequency was attributed to the corrosion response occurring in the coating/substrate interface, while that at high frequency was related to the coating capacitance[45]. The Nyquist plot (Figure 9c) can be divided into two regions: the semicircles in the high frequency range and the straight lines in the low frequency range. In the high frequency range, the larger the diameter of the semicircle, the stronger the anticorrosion effect of the coating[46]. In the low frequency range, the slope indicates the diffusion behavior of the electrode. The smaller the linear slope, the slower the diffusion of ions/electrons. As shown in Figure 9c, the anti-corrosion effect of the epoxy coating gradually decreased when the immersion time was increased.
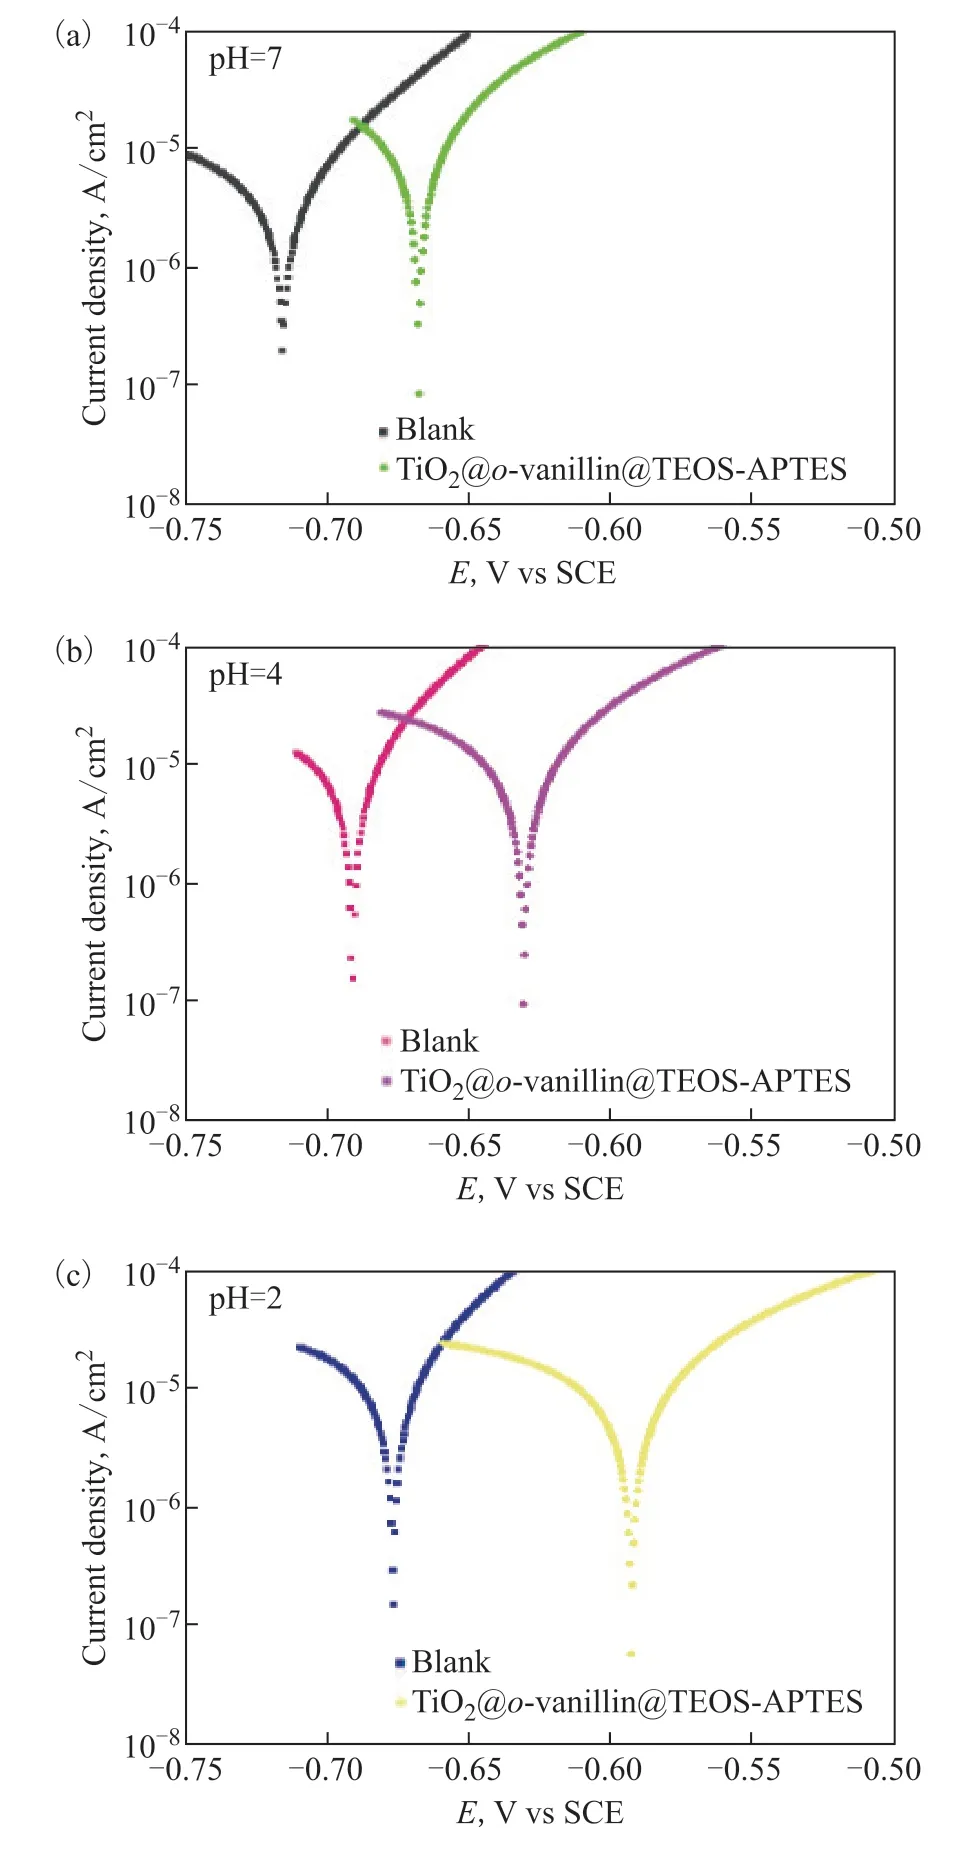
Figure 8 Potentiodynamic polarization curves of the steel sheet in the absence and presence of TiO2@o-vanillin@TEOS-APTES in 0.3% NaCl solutions at different pH values
For the epoxy@o-vanillin coating, when the immersion time was increased, the low-frequency impedance value decreased from 2.57×10⁶to 2.31×10⁵Ω·cm2(Figure 9d). In general, the impedance value of the coating doped witho-vanillin was slightly higher than that of the blank epoxy coating. However, after soaking for 3 d, there was obvious Warburg impedance. This indicated that the corrosive substances had permeated into the coating.
For the epoxy@TiO2@o-vanillin@TEOS-APTES coating immersed for 2 d, the impedance of the coating decreased (Figure 9g). When the immersion time was increased from 3 d to 5 d, the impedance value increased, which was attributed to the formation of a thin organic film. The organic film was adsorbed onto the substrate surface because of the release ofo-vanillin. After the epoxy@TiO2@o-vanillin@TEOS-APTES coating had been immersed for 7 d, its impedance value was two orders of magnitude higher than that of the blank epoxy. This result showed that the epoxy@TiO2@o-vanillin@TEOSAPTES coating provided an excellent physical barrier that blocked the intrusion of corrosive ions.
To gain more information about the corrosion behavior of the substrate, EIS spectra were fitted to appropriate equivalent circuits (Figure 10).Rswas interpreted as the solution resistance.Rcoatand CPEcoatcorresponded to the charge transfer resistance and the coating capacitance, respectively. The coatings with a highRcoatvalue and low CPEcoatwere considered to offer good anti-corrosion performances. As shown in Table 2, theRcoatvalue for the epoxy coating was 6×10⁴Ω·cm2after soaking for 1 d, and decreased to 1.9×10³Ω·cm2after soaking for 7 d. TheRcoatvalue of the epoxy@o-vanillin coating varied from 1.8×10⁶to 1.4×10⁴Ω·cm2, showing better impedance performance than the blank epoxy coating. However, theRcoatvalue of the epoxy@TiO2@o-vanillin@TEOSAPTES coating didn’t decrease when the soaking time was increased: the values were 2.0×10⁶, 1.1×10⁶, 3.3×10⁶, 2.2×10⁶and 1.0×10⁶Ω·cm2. Through the analyses of the impedance results, it was found that the epoxy@TiO2@o-vanillin@TEOS-APTES coating not only had a lower CPEcoatvalue, but also that the CPEcoatvalue decreased after soaking for 5 d, which is mainly ascribed to the release ofo-vanillin from the TiO2@o-vanillin@TEOSAPTES nanocontainer and the formation of a thin film on the surface of the steel sheet.
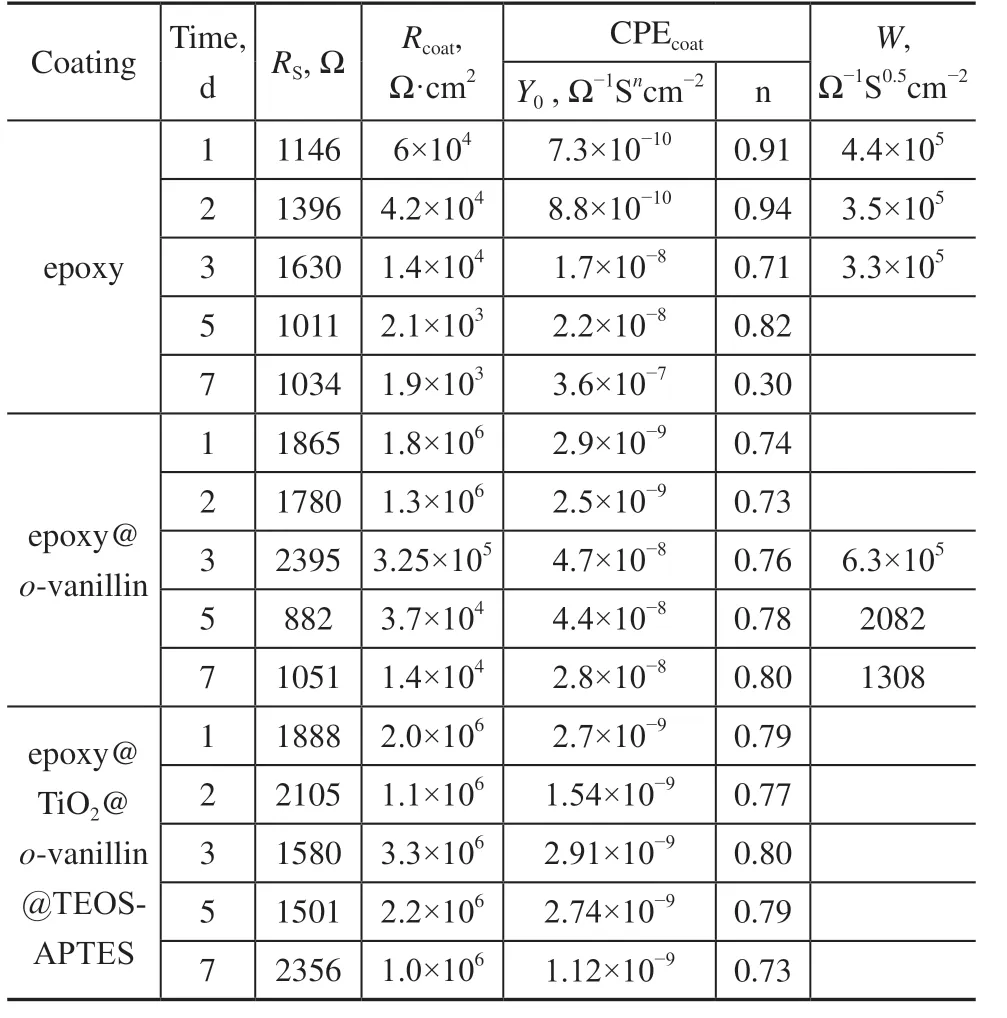
Table 2 Electrochemical parameters of different coatings obtained from the EIS data

Figure 9 EIS curves of the epoxy (a–c), epoxy@o-vanillin (d–f) and epoxy@TiO2@o-vanillin@TEOS-APTES (g–i) coatings immersed in 3% NaCl solution for different periods of time. Bode curves (a, d, g), phase angle curves (b, e, h) and Nyquist curves (c, f, i)
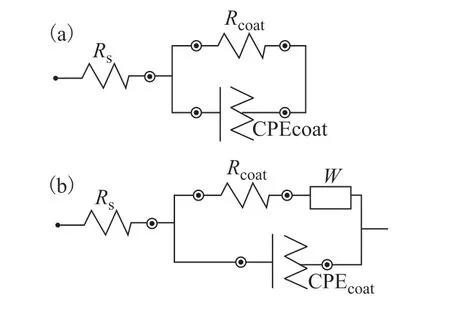
Figure 10 Equivalent circuits fitted to EIS data
3.5.2 Measurements for potentiodynamic polarization curves
The anti-corrosion performances of the epoxy, epoxy@o-vanillin and epoxy@TiO2@o-vanillin@TEOS-APTES coatings on the sheet steel immersed in 3% NaCl (pH = 7) solutions for 1, 2, 3, 5 and 7 d were studied using potentiodynamic polarization curves. As shown in Figure 11a–e, compared with the epoxy and epoxy@o-vanillin coatings, the epoxy@TiO2@o-vanillin@TEOS-APTES coating had the highestEcorrvalues and the lowestIcorrvalues. This showed that the addition of the nanocontainers could improve the anti-corrosion performance of the coating, and the maximum inhibition rate reached 97.3%. The analysis results from the potentiodynamic polarization curves were consistent with those from EIS. Data related to the potentiodynamic polarization curves are listed in Table 3.
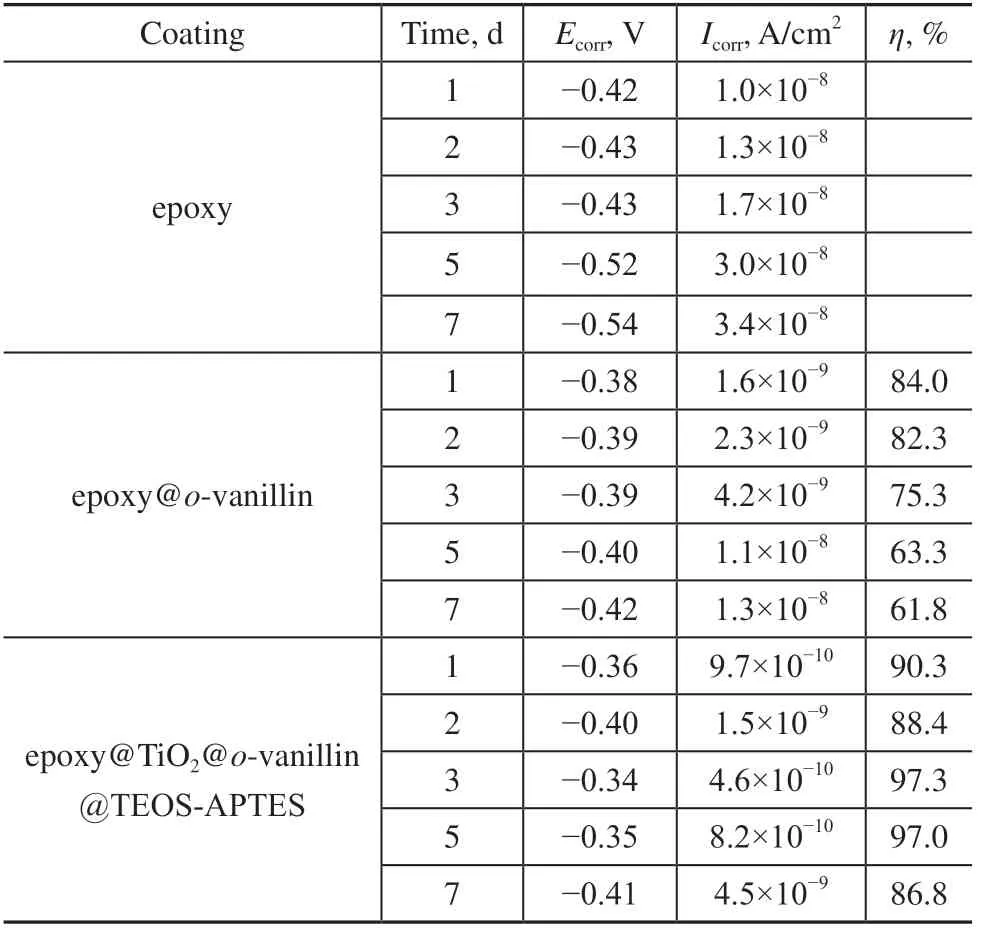
Table 3 Potentiodynamic polarization parameters for the epoxy, epoxy@o-vanillin and epoxy@TiO2@o-vanillin@TEOS-APTES coatings
3.5.3 Contact angle test
Figure 11f shows the contact angles observed for water droplets on the surfaces of the three coatings. The contact angles of the epoxy, epoxy@o-vanillin and epoxy@TiO2@o-vanillin@TEOS-APTES coatings were 44°, 60° and 74°, respectively. The bigger contact angle of the epoxy@TiO2@o-vanillin@TEOS-APTES coating indicated that the hydrophilicity was weaker than that of the other two coatings, which was helpful to reduce the erosion of the corrosive medium.
3.5.4 Scarification test
To better observe the anti-corrosion performance of the coating on the sheet steel, scarification experiments were carried out. As shown in Figure 12a, yellow corrosion products were formed and a blistering phenomenon in the scratches was clearly observed after 1 d. After soaking in 3% NaCl solution for 7 d, the epoxy coating had been corroded heavily and peeled off from the steel sheet. When epoxy@o-vanillin was coated on the steel sheet (Figure 12b), the blistering phenomenon in the scratches was observed after 5 d. In contrast, as shown in Figure 12c, no indication of blistering or delamination was seen when epoxy@TiO2@o-vanillin@TEOS-APTES was coated. Additionally, the scratches were nearly free of corrosion after immersing the sheet in NaCl solution for 5 d, which was mainly ascribed to the release ofo-vanillin from the TiO2@o-vanillin@TEOS-APTES nanocontainer. This result was consistent with the EIS test.

Figure 11 Potentiodynamic polarization curves (a–e) and contact angles (f) of the epoxy, epoxy@o-vanillin and epoxy@TiO2@o-vanillin@TEOS-APTES coatings
3.6 The cross-bonding mechanism of the epoxy and TiO2@o-vanillin@TEOS-APTES nanocontainer
The cross-bonding mechanism of the epoxy and TiO2@o-vanillin@TEOS-APTES nanocontainer is shown in Figure 13. The TiO2@o-vanillin@TEOS nanocontainer was covered by APTES, which was previously mixed with epoxy. The cross-bonding mechanism can be explained as follows. The siloxane group (–Si–O–R–) on the surface of the APTES could react with H2O to generate free silanol groups (Si–OH), then hydrogen bonds could form through the reaction of Si–OH with R–O on the surface of the TEOS. Finally, the hydrogen bonds condensed to form –Si–O–R covalent bonds and more amino groups were grafted on the surface of the TEOS films, which provided reactive sites. These reacted with the epoxide groups of the epoxy coating through an SN2nucleophilic substitution reaction, resulting in an increase in the extent of cross-bonding of the epoxy and TiO2@o-vanillin@TEOS-APTES nanocontainer[15].

Figure 12 Scarification test results for steel sheets coated with (a) epoxy, (b) epoxy@o-vanillin and (c) epoxy@TiO2@o-vanillin@TEOS-APTES
When the coating was damaged, the steel substrate was exposed to the corrosive medium. Water, oxygen and salt could directly contact the metal matrix through the damaged area.
The decrease of the pH in the medium could accelerate the release ofo-vanillin from the TiO2@o-vanillin@TEOSAPTES container. The releasedo-vanillin formed a thin absorption layer on the damaged metallic surface, hindering anodic and cathodic corrosion of the steel sheet. A schematic illustration of the self-healing mechanism of the epoxy@TiO2@o-vanillin@TEOS-APTES coating is shown in Figure 14.
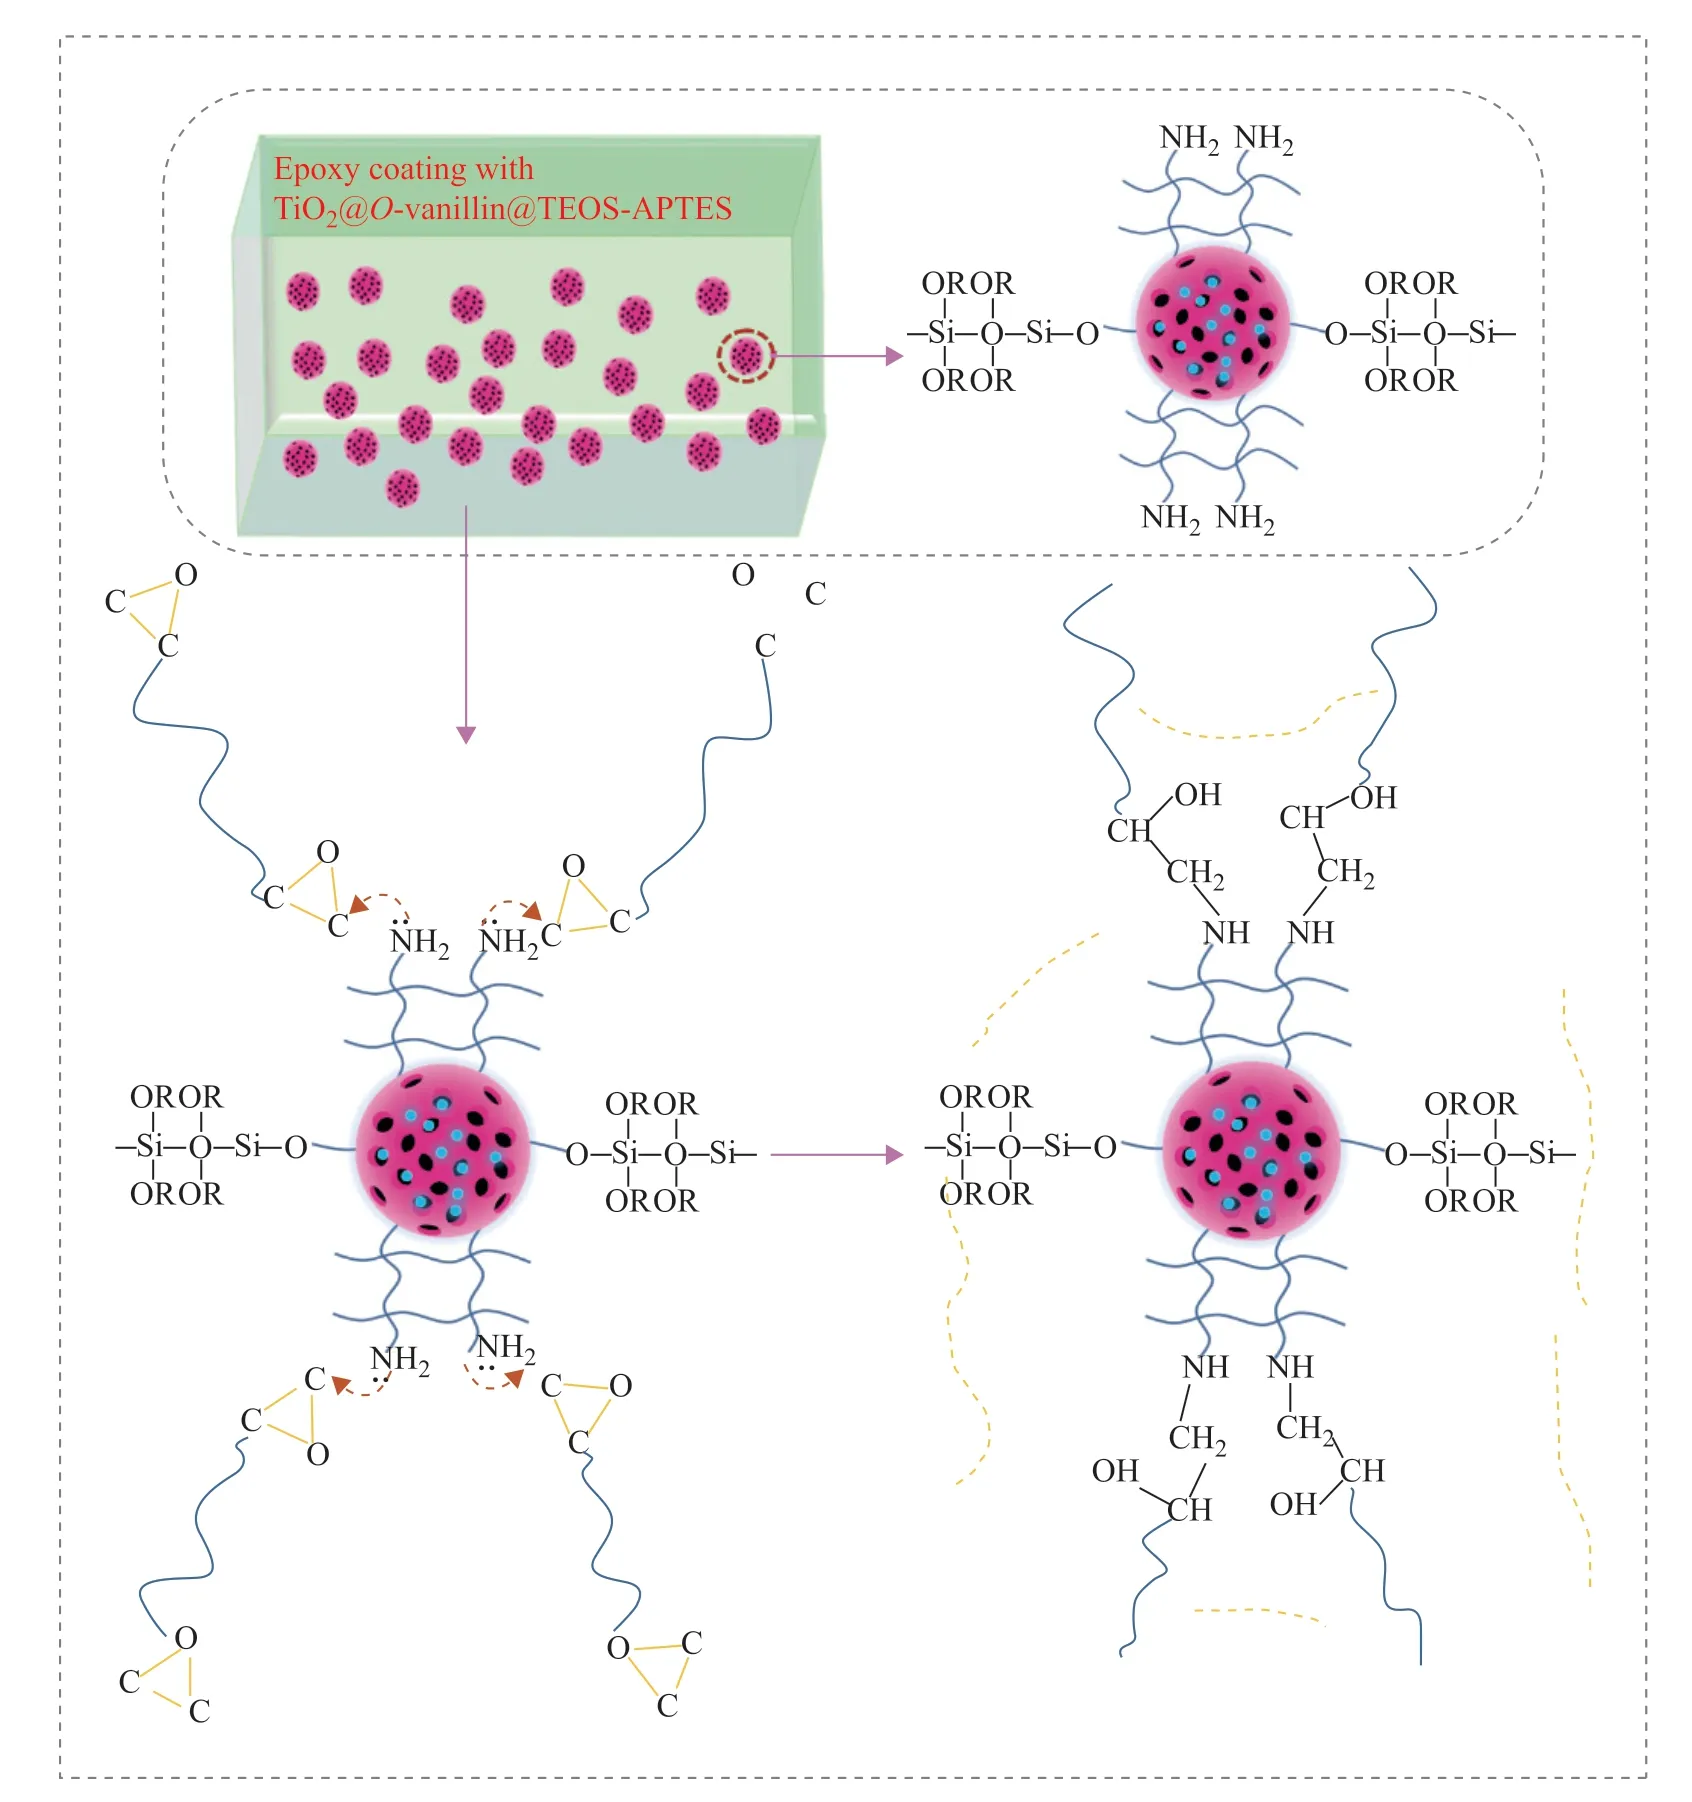
Figure 13 Schematic illustration of the cross-bonding mechanism of the epoxy and TiO2@o-vanillin@TEOS-APTES nanocontainer
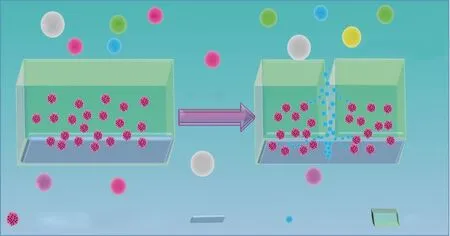
Figure 14 Schematic illustration of the self-healing mechanism of the epoxy@TiO2@o-vanillin@TEOS-APTES coating
4 Conclusion
A TiO2@o-vanillin@TEOS-APTES nanocontainer was successfully preparedviahydrothermal reaction, NaF etching and sol–gel methods, and could be well dispersed in an epoxy resin. The experimental results showed that the release rate ofo-vanillin from the TiO2@o-vanillin@TEOS-APTES nanocontainer was controlled by the pH value, and an optimal pH value of 2 was obtained. The anti-corrosion performances of the epoxy, epoxy@o-vanillin and epoxy@TiO2@o-vanillin@TEOS-APTES coatings were evaluated using electrochemical methods, which showed that the epoxy@TiO2@o-vanillin@TEOSAPTES coating could provide long term protection in a 3% NaCl solution against metal corrosion, and the maximum inhibition rate reached 97.3%. Scarification tests further verified the self-healing mechanism of the epoxy@TiO2@o-vanillin@TEOS-APTES coating on steel.
Acknowledgements:This work was supported by the National Natural Science Foundation of China (21878024) and the Innovation Team Project of Colleges and Universities in Liaoning Province (2018479-14, LT2015001).
- 中国炼油与石油化工的其它文章
- Synthesis and Evaluation of Microporous Metal Organic Frameworks for Light Hydrocarbon Adsorption
- Selection of Extraction Solvents for Bitumen from Indonesian Oil Sands through Solubility Parameters
- Synthesis of Hierarchical Porous Fe2O3/Al2O3 Materials and Study on Catalytic Viscosity Reduction of Heavy Oil
- Activated Carbon from Rice Husk with One-Step KOH Mechanical Mixing Activation as Adsorbent for Treating Phenolic Wastewater
- Effect of Particle Shape on Catalyst Deactivation during 2-Butene and Isobutane Alkylation of Liquid Phase in Fixed-Bed Reactor Using Particle-Resolved CFD Simulation
- Experimental and Numerical Investigation on Erosion Corrosion of the Air Cooler Tube Bundle in a Residue Hydrotreating Unit