
Influence of Oil and Water Components on Wall-sticking Occurrence Temperature in High Water-cut Crude Oil Pipeline
2022-02-01 04:02ChengXianwenHuangQiyuWangKunCuiYueHeiShunanYuLe
中国炼油与石油化工 2022年4期
Cheng Xianwen; Huang Qiyu; Wang Kun; Cui Yue; Hei Shunan; Yu Le
(1. Surface Engineering Pilot Test Center, National Engineering Laboratory for Pipeline Safety, Beijing Key Laboratory of Urban Oil and Gas Distribution Technology, China University of Petroleum, Beijing 102249; 2. PetroChina Planning and Engineering Institute, Beijing 100083; 3. Sinopec Petroleum Exploration and Production Research Institute, Beijing 100083)
Abstract: To study the wall-sticking phenomenon and prevent pipeline blockage accidents, two analytical methods are used to evaluate the influence of different crude oil components on the wall-sticking occurrence temperature (WSOT). The WSOT and the interactions among oil, water, and surface solids are measured and calculated by various devices under different values of the wax content, water pH, and salinity. The results show that there is greater correlation between the wax content and WSOT than between resins/asphaltenes and WSOT. Furthermore, the wax content, water pH, and salinity have different effects on WSOT. There is generally a positive correlation between wax content and WSOT, whereas the maximum WSOT occurs when the water pH is in the range 5.7 – 6.5, and decreases under more acidic or alkaline conditions. As the salinity increases, WSOT decreases slightly, but quickly becomes saturated. In terms of interactions, variations in the interfacial tension and adhesion work with pH and salinity are consistent with that of WSOT, while the contact angle exhibits the opposite relation.
Key words: non-heating gathering and transportation; wall sticking occurrence temperature; interfacial tension; contact angle; adhesion energy
1 Introduction
Under the background of the transition to a lowcarbon economy, traditional high-energy heating and transportation processes are increasingly unable to meet the requirements of reductions in energy-use and consumption. Current studies have shown that, for high water-cut pipelines, the produced fluid still has the ability to move below the freezing point of crude oil. Therefore, the non-heating gathering and transportation of produced fluid using the residual pressure and temperature of the wellhead has become an important means of guaranteeing the economic operation of a pipeline in recent years[1-4]. However, when the temperature of the produced liquid is below the freezing point of crude oil, the serious problem of gelled oil sticking to the pipe wall may occur[5-7]. Gelled oil on the pipe wall reduces circulation and may completely block the pipeline, which threatens the safe operation of the gathering and transportation system[5,7]. Therefore, studies of gelled oil sticking to pipe walls are of great significance in the process of non-heating gathering and transportation.
The wall-sticking phenomenon is caused by the formation of gelled oil and its adhesion to the inner wall of the pipeline. As the operating temperature decreases, the force between oil droplets increases, and the precipitated wax crystals and natural interfacial active substances in crude oil are adsorbed on the oil-water interface. As a result, a three-dimensional network structure forms and encapsulates liquid hydrocarbons and emulsified water, producing a weaker gelled oil mass[8-9]. The phenomenon of wall sticking occurs when the shear effect of water flow on the oil is less than the adhesion effect between the oil and the wall. The wall-sticking behavior strongly depends on the transport medium and the flow conditions. Interfacial active substances such as wax crystals, resins, asphaltenes, acid compounds, and solid particles in crude oil can be adsorbed on the oil-water interface, reducing the interfacial tension, changing the interfacial free energy, and affecting the adhesion of the solid-liquid interface[10]. The shear strength, temperature, and water content also have significant effects on the rheological and interfacial properties of the system.
During the non-heating gathering and transportation process, when the temperature drops to a certain value below the freezing point, a large amount of crude oil begins to adhere to the pipe wall, causing the wellhead back pressure to rise sharply. This “wallsticking occurrence temperature” (WSOT)[1,11]is the main evaluation index for the non-heating gathering and transportation boundary conditions. Zheng et al. determined WSOT values by measuring the pressure drop at different temperatures with a circulating pipe device, and calculated the wall-sticking rate according to the thickness of gelled oil on the pipe wall[1]. Zhang et al. measured WSOT with a stirring tank device and deduced a calculation model[12]. Under the influence of interfacial active substances and shearing, the fluid in the pipeline can easily form an oil-water suspension containing emulsified water in the oil phase[13-17]. The emulsification of crude oil changes the rheological properties of the fluid and affects the flow pattern and pressure drop in the pipeline[18-21]. Scholars have investigated the rheological properties and stability of oil-water suspension systems, as well as the microscopic characteristics of crude oil at low temperatures[22-26]. Previous research provides guidance for future studies of non-heating gathering and transportation.
The current research on non-heating gathering and transportation mainly focuses on the influence of external factors such as temperature, water content, and shear strength on WSOT. However, the properties of oil-phase components (such as wax, resins, and asphaltenes) and water-phase components (such as pH and salinity) also impact the adhesion of gelled oil to the pipe wall.
In terms of oil-phase components, Paso et al. studied the solid-liquid interface between stainless steel and simulated oil under isothermal conditions, and found that paraffin wax crystals dispersed in the solution did not adhere to the surface of stainless steel[27]. However, the wax in crude oil exhibits interfacial activity due to the adsorption of polar substances (such as fatty acids, fatty alcohols, and fatty amines), and can be adsorbed on the oil-water interface to change the rheology of the interfacial membrane. When wax with a lower freezing point dissolves in the oil phase, it replaces the resins and asphaltenes at the oil-water interface and reduces the oil-water interfacial tension[28]. Asphaltene is a non-hydrocarbon component with the largest relative molecular weight and strongest polarity in crude oil[29-30], and its internal heteroatoms constitute different functional groups[31]. Adams and Abdallah et al. used X-ray photoelectron spectroscopy to analyze the asphaltene layer adsorbed on the surface of stainless steel, and found functional groups containing O, N, S, and other heteroatoms[32-33]. In addition, asphaltenes with higher aromatics can cause multi-layer adsorption, facilitating their precipitation in the pipeline[34]. Existing computational studies have shown that asphaltenes with high aromaticity and small aliphatic side chains undergo particularly significant adsorption on Fe2O3[35-36]. In addition, asphaltenes contain acid-base pairs, which adsorb strongly to the oil-water interface and change the interface properties[37-38]. The resins in crude oil have strong dispersibility and are readily adsorbed on the surface of asphaltene particles, acting as asphaltene dispersant[39]. If asphaltenes and resins combine before adsorption, the adsorption layer will sometimes increase in size due to the expansion of aggregates caused by the embedded resins[40-41].
In terms of water-phase components, when the pH of the water is high, the acidic compounds in the crude oil will react with the alkali to form substances with higher interfacial activity[42]. Lashkarbolooki et al. explored the effect of pH on oil-water interfacial tension, and found that under alkaline conditions, the interfacial tension between the water phase and light crude oil decreases with increasing pH[43]. Silva et al. studied the mechanism whereby pH and inorganic salts influence the surface wetting characteristics, and found that the pH of the water affects the surface wettability by changing the electric double-layer of the oil-solid interface[44]. Produced water contains cations and anions such as K+, Na+, Ca2+, Mg2+, Cl-, SO42-, and HCO3-, which can weaken the electric double-layer and thus affect the adhesion at the oil-solid interface. For example, Zhao et al. found that divalent cations reduce the long-range repulsive force between the oil and the solid, and increase the adhesion force[45].
Although the influence of oil and water components on the interaction between the fluid and the wall has been studied to some extent, the relations under non-heating gathering and transportation conditions have not yet been established. In this paper, the influence of oil components, water pH, and salinity on WSOT is studied by different methods, and the conclusions obtained provide guidance for improved non-heating gathering and transportation schemes.
2 Experimental
2.1 Experimental oil samples
In this study, 20 crude oil samples were obtained from different regions. The basic physical properties of these samples are listed in Table 1. The freezing point was measured by the test method for the freezing point of crude oils (SY/T 0541-2009), the wax content was measured by differential scanning calorimetry (SY/T 0545-2012), and the resin and asphaltene contents were measured by the test method for the separation of asphalt into four fractions (NB/SH/T 0509-2010).
Crude oils A and B were mixed in different ratios of 0:1, 3:7, 4:6, 5:5, and 6:4, and the mixtures were sequentially numbered as AB-1, AB-2, AB-3, AB-4, and AB-5. The basic physical properties of crude oils A and B are listed in Table 2.To ensure the reproducibility of the experimental results, the experimental oil samples were pretreated as follows. First, the oil samples were heated to 80 °C and stirred for 2 h. Then, the oil samples were naturally cooled to room temperature and kept in the dark for 48 h before use. To avoid major changes in the properties of the oil samples over time, they were stored in sealed glass bottles and kept in a dark place until the experiment.

Table 1 Physical properties of crude oil samples 1–20

Table 2 Physical properties of crude oils A and B
2.2 Experimental devices and methods
2.2.1 WSOT measurements
A stirring tank was used to measure the WSOT of the oil-water mixed system. A schematic diagram is shown in Figure 1. The equipment is mainly composed of a stirring tank (providing an adhesion wall surface) equipped with a temperature sensor and a magnetic sealing cover. The tank cavity size is 75 mm in diameter, 105 mm in height, and has a discharge valve at the bottom. A constant temperature bath (Ningbo Xinzhi SDC-6) provides effective temperature control from -5 °C–100 °C with an accuracy of ±0.05 °C; the tank volume is 7.3 L. The dynamic stirring system, including stirring motor and stirring paddle, has a stirring speed range of 0–2000 r/min. The stirring paddle is a fourblade 45° folding paddle with a diameter of 60 mm. Finally, a control box provides a digital display of the temperature, speed, and pressure.

Figure 1 Schematic diagram of the stirring tank equipment
The equipment simulates pipe flow shear at a certain intensity of stirring. During the experiment, the wallsticking degree of gelled oil on the wall surface gradually increases as the temperature decreases. When the temperature reaches a certain value under the same water scouring action, the mass of gelled oil on the wall suddenly increases. The specific experimental steps are as follows.
1) Water-oil emulsions are prepared according to the stable water content of different crude oil emulsions. The volume of the beaker used in the experiment is 500 mL, the stirring blade is a four-blade 45° folding blade with a diameter of 60 mm, and the water is added by one-time water addition. The stirring time and speed are 10 min and 1000 r/min, respectively. The preparation temperature is determined according to the wellhead temperature.
2) The water bath is turned on, and the temperature is set to 4 °C above the freezing point of crude oil. The oil and water samples are then placed in the water bath to heat for 30 min.
3) The discharge valve at the bottom of the tank is kept closed. When the water bath reaches the set temperature, it is maintained at a constant temperature for 30 min. The water sample and the prepared emulsion are poured into the tank and the magnetic sealing cover is placed. The total volume of the emulsion and water is 200 mL.
4) The stirrer is turned on and the temperature of the water bath is set to a certain temperature below the freezing point. Cooling proceeds at a rate of 0.5 °C/min while stirring. The temperature is kept constant for 10 min after reaching the set temperature.
5) The oil-water mixture is discharged from the lower end of the tank while stirring. The oil on the wall is scraped off with a scraper, and its mass is weighed.
6) The above operations are repeated to test the mass of gelled oil on the wall at different temperatures until the mass increases suddenly.
2.2.2 Contact angle measurement
The contact angle was measured using a JY-PHb contact angle tester, as shown in Figure 2. To ensure that the measurement results were accurate and reliable, the droplet volume for the entire experiment was set to 10 μL, as controlled by the sampler. After each set of experiments, the solid specimens were sequentially cleaned with petroleum ether, absolute ethanol, and distilled water by ultrasonic treatment, before being dried and placed in a dark, dry place for later use. The specific measurement process was as follows. First, the instrument was placed in a horizontal state. A solid sample was then placed on the workbench, and a certain amount of liquid was drawn up using a syringe. The tester was booted and the light source was turned on, and then the capture lens was adjusted and the computer screen was observed. The sampler was operated to form 10-μL droplets on the needle. The sample stage was lifted so that the solid sample contacted the droplets, and then the sample stage was pulled down to a suitable position. A photo was taken and software was used to calculate the contact angle value. To avoid accidental errors, the average of five experiments was taken for each group of interfaces.
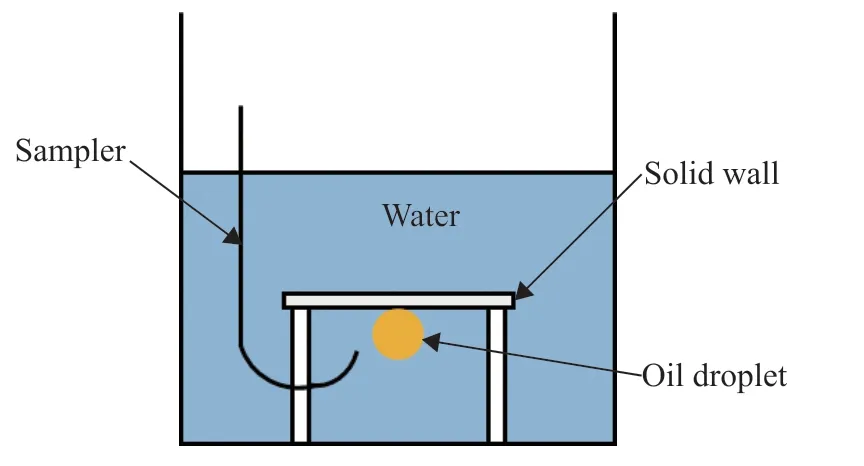
Figure 2 Schematic diagram of the contact angle tester
2.2.3 Interfacial tension measurements
The interfacial tension was measured by the rotating drop method using an SVT20N interfacial tensiometer (Data Physics Company, Germany). The structure of the interface tensiometer is shown in Figure 3. The measurement procedure was as follows. First, the sample tube was filled with liquid 1. A capillary syringe was then used to inject liquid 2, which has a higher density than liquid 1. After the sample tube was assembled, the power was turned on, and the tilt of the sample tube was controlled such that the resultant force of the droplet tension, gravity, and other forces was always in balance. Finally, the droplet size and other information were recorded through the instrument, and the software was used to calculate the interface tension. The software automatically captures and records the deformation information of the droplets. As interfacial tension is time-dependent, the sample was changed every time a condition was measured, and the equilibrium time of each sample was kept the same.
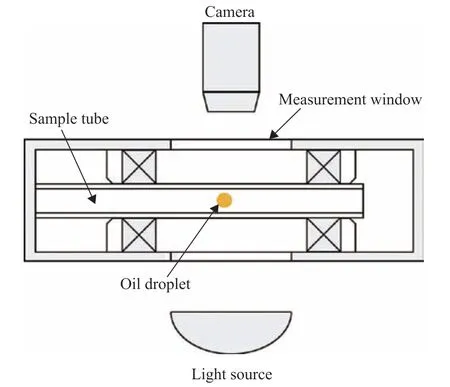
Figure 3 Schematic diagram of the interface tensiometer
2.2.4 Adhesion work calculation
The adhesion work between the oil droplet and the solid surface in a water medium is equal to the energy required to separate the oil droplet from the solid[46]:

whereWsowis the adhesion work of the oil-solid interface in water, mJ/m2;Wwwis the cohesion work of the water phase, mJ/m2;Wso,Wsw, andWowrepresent the adhesion work of oil-solid, water-solid, and oil-water interfaces, respectively, mJ/m2; andγsw,γow, andγsorepresent the interfacial tension of water-solid, oil-water, and oil-solid interfaces, respectively, mN/m.
The equilibrium equation of the droplet on a smooth, homogeneous, and rigid solid surface is as follows:

whereθis the three-phase contact angle.
In the pipeline, the crude oil is subjected to external forces such as fluid dynamics. Ifγso>γsw, thenθ> 90°, and the oil film tends to shrink into oil droplets and separate from the surface of the material, as shown in Figure 4(a). This is conducive to the implementation of non-heating gathering and transportation. On the contrary, whenθ< 90°, conditions are not conducive to the peeling of oil droplets, as shown in Figure 4(b).
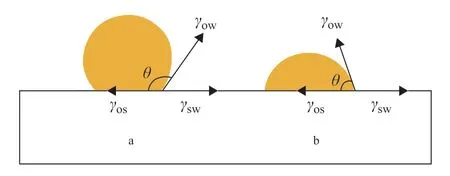
Figure 4 Contact angle of oil/water/solid system
Substituting Equation (2) into Equation (1) gives the following formula[47]:

whereWsowis the adhesion work between the oil and the wall in a water medium.
When the oil-water interfacial tension and the contact angle of the oil droplets on the solid surface are known, Equation (3) can be used to calculate the adhesion work of the oil-solid interface in water.
3 Results and Discussion
3.1 Influence of oil components
3.1.1 Correlation analysis
Before the application of analytical methods, the relationship between wax, resins, asphaltenes, and WSOT was quantitatively analyzed through experiments. The amounts of crude oils 1–20 sticking to the wall at different temperatures under 80% water content were examined using the stirring tank experimental equipment. Following the relevant literature[4,12,48], the speed of the stirring paddle was adjusted so that the average shear rate in the tank was 60 s-1, simulating the shear effect on the oil and water during transportation in an oilfield. The results are shown in Figure 5.
To determine the most influential factor on WSOT, gray relational analysis and correlation analysis were applied.
3.1.1.1 Gray relational analysis
Gray relational analysis is a multi-factor statistical method that uses the gray correlation degree to describe the strength, size, and order of the relationship between factors based on the sample data. The specific calculation process is as follows.
1) Determine the reference sequence and comparison sequence
For objects to be evaluated andnevaluation indicators, letx0={x0(1),x0(2), ...,x0(n)} be the reference sequence, reflecting the behavior of the system, and set this as the WSOT. Let the sample setxi={xi(1),xi(2), ...,xi(n)}(i=1, 2, ...,m) be the comparison sequence, composed of factors affecting the behavior of the system, i.e., wax, resins, and asphaltenes.
2) Normalization
To prevent differences in the order of magnitude among the units in each group of data from influencing the analysis results, the factors in the system were normalized. The results are shown in Figure 6.
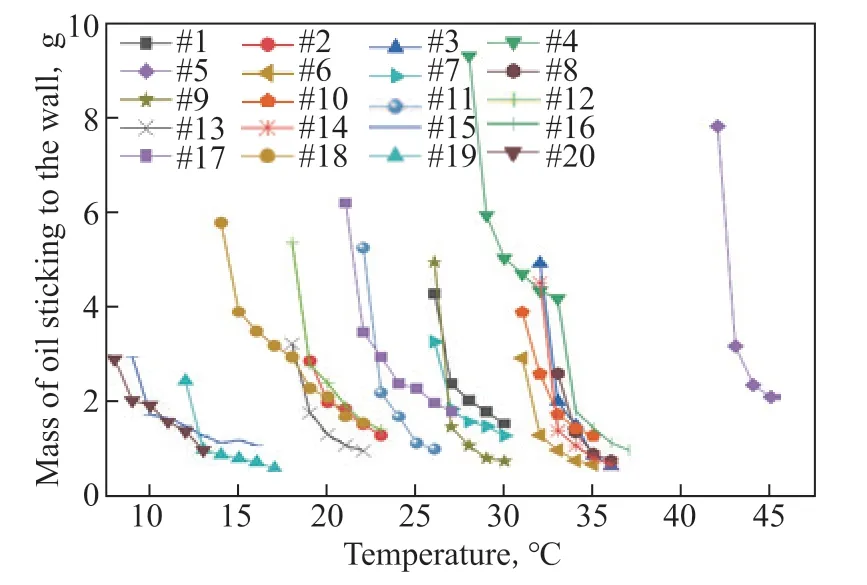
Figure 5 Accumulated oil sticking to the wall vs temperature
3) Calculate the correlation coefficient
The formula for the correlation coefficientςi(k) for the reference and comparison sequences is as follows:

whereλis the resolution coefficient,λ∈(0, 1). The calculation results are shown in Figure 7.

Figure 6 Results of normalization processing

Figure 7 Results of correlation coefficient calculation
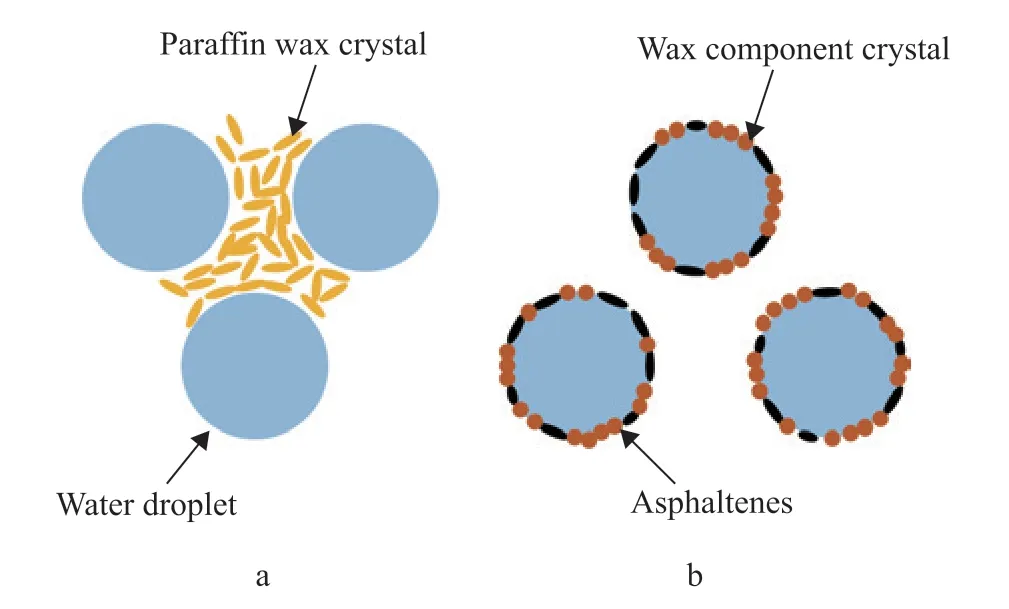
Figure 8 Schematic diagram of wax crystal distribution in oil-water mixed system
4) Calculate the correlation degree
The degree of correlation between the comparison sequence and the reference sequence is taken as the average value of the correlation coefficient at each time. The formula for the correlation degreeriis as follows:
The calculation results are presented in Table 3. The correlation degree of the wax is greater than 0.9, indicating that wax has a greater impact on WSOT than the other components.
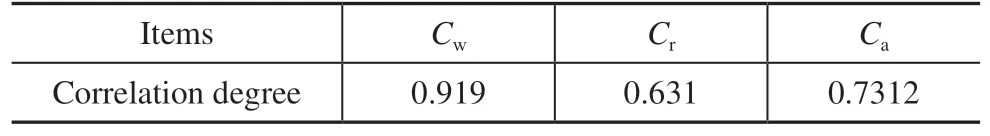
Table 3 Results of correlation degree
3.1.1.2 Correlation analysis
Correlation analysis is often used to measure the closeness of multiple variables. In the correlation analysis, a significance coefficient of less than means that there is a significant correlation between the two variables, and a value of less than indicates an extremely significant correlation.
The statistical software SPSS was used to analyze the correlation of each variable. The results are presented in Table 4. The two-tailed significance test shows that there is a very significant positive correlation between wax and WSOT, and the Pearson correlation coefficient is 0.892.Both analytical methods demonstrate that wax obviously affects WSOT. The reason may be that the wax component of waxy crude oil contains non-polar compounds such as paraffin wax as well as polar compounds such as fatty acids and fatty alcohols. Polar compounds with smaller molecular weights are soluble in liquid hydrocarbons, and the polar functional groups -OH, -C=O, and -NH can form hydrogen bonds with water at room temperature. The polar functional groups attached to linear hydrocarbons form hydrogen bonds with water more easily than those attached to cyclic hydrocarbons. Additionally, linear hydrocarbons are more soluble in the oil phase than cyclic hydrocarbons. Therefore, these polar compounds and wax with higher freezing points precipitate at the same time, replacing resins and asphaltenes on the oil-water interface and affecting the adhesion behavior between oil, water, and solid components under low-temperature conditions.The adhesion of asphaltenes to solid surface is affected by the molecular structure, number of heteroatoms, type of functional groups, aromaticity, and acid-base characteristics of resins and asphaltenes. The molecular structure and weight of resins and asphaltenes vary considerably in the different crude oils. In waxy crude oil, the resin and asphaltene content is lower than the wax content. Therefore, the influence of resins and asphaltenes on wall-sticking behavior is not solely a function of content. In this experiment, the wax content ranged from 9.74% to 39.43%, and the resin and asphaltene contents varied from 5.88%–28.92% and 0.28%–1.49%, respectively, resulting in low correlation degrees for resins and asphaltenes.
3.1.2 Experiments on the effect of wax on WSOT
To further explore the influence of wax on the wallsticking behavior of high water-cut waxy crude oil, the stirring tank equipment was used to conduct WSOT experiments on oil samples with different wax contents. The wax contents of oil samples AB-1 to AB-5 are listed in Table 5.
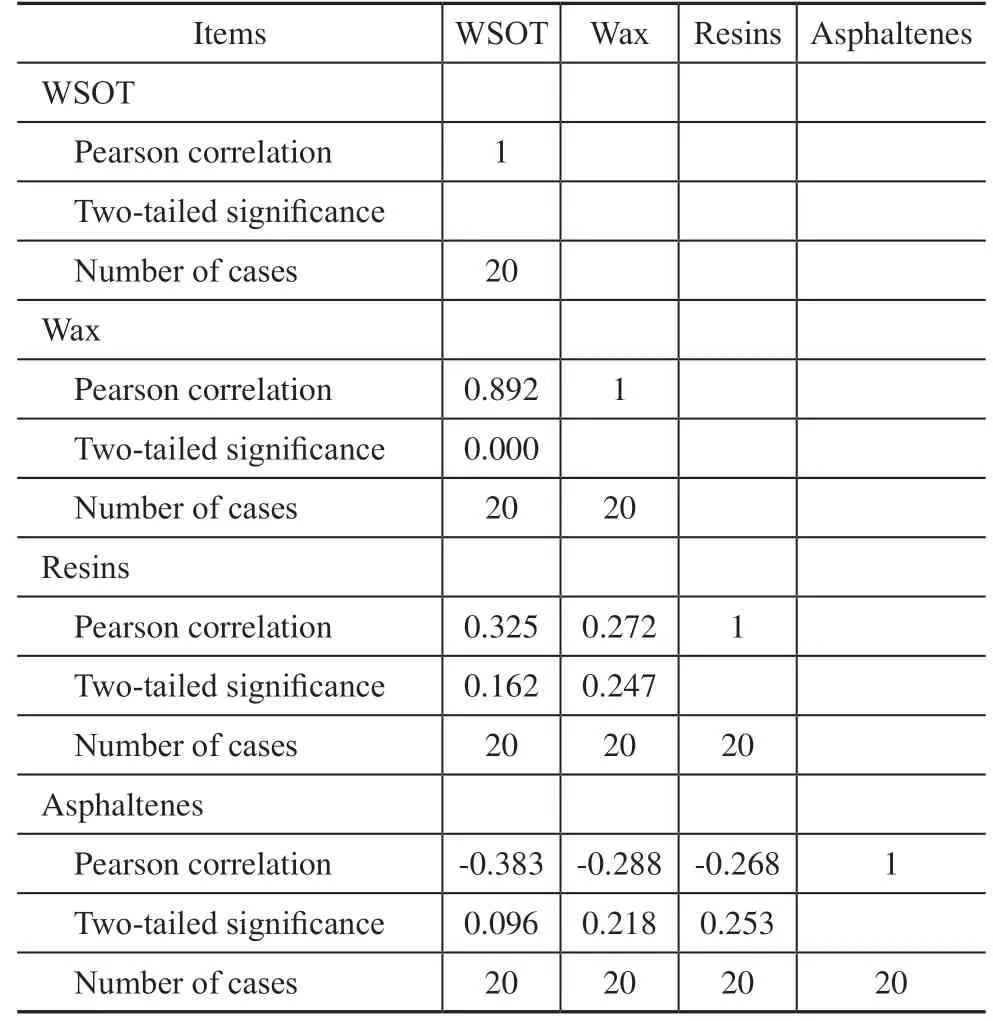
Table 4 Results of correlation analysis

Table 5 Wax contents of oil samples from AB-1 to AB-5
Figure 9 shows the specific adhesion situation under a water content of 80% and shear rate of 60 s-1.
As the wax content increases (from AB-5 to AB-1), the curves gradually shift to the right. This indicates that the presence of wax makes larger amounts of the oil phase adhere to the tank wall at higher temperatures. Furthermore, the freezing points of oil samples AB-1 to AB-5 were measured. The measurement results are shown in Figure 10.
With increasing wax content, the freezing point of crude oil increases, and its fluidity worsens. Oil phases with higher freezing points are more likely to condense into agglomerates and adhere to the wall at a given experimental temperature.
WSOT experiments were performed with 70%, 80%, and 90% water contents. Figure 11 shows the change in WSOT and the difference between the freezing point and WSOT with respect to the wax content at three water contents.
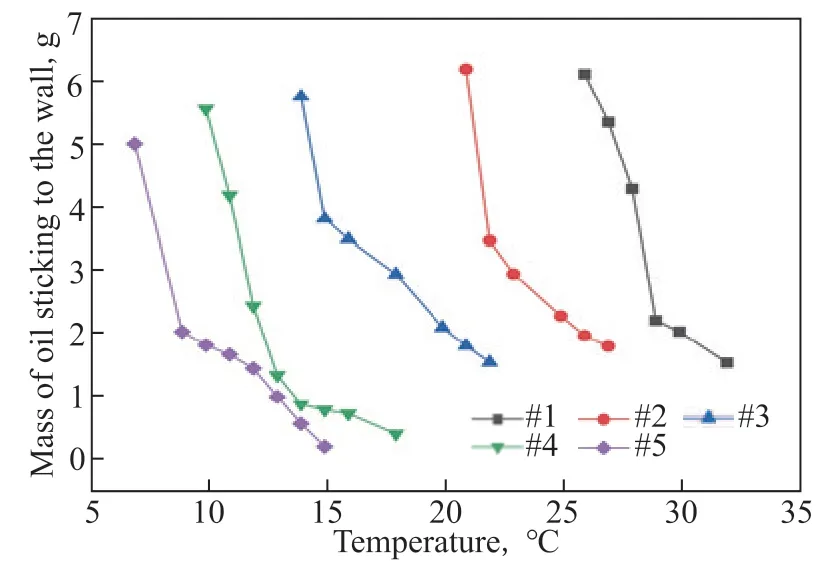
Figure 9 Mass of gelled oil sticking to the wall with different wax contents
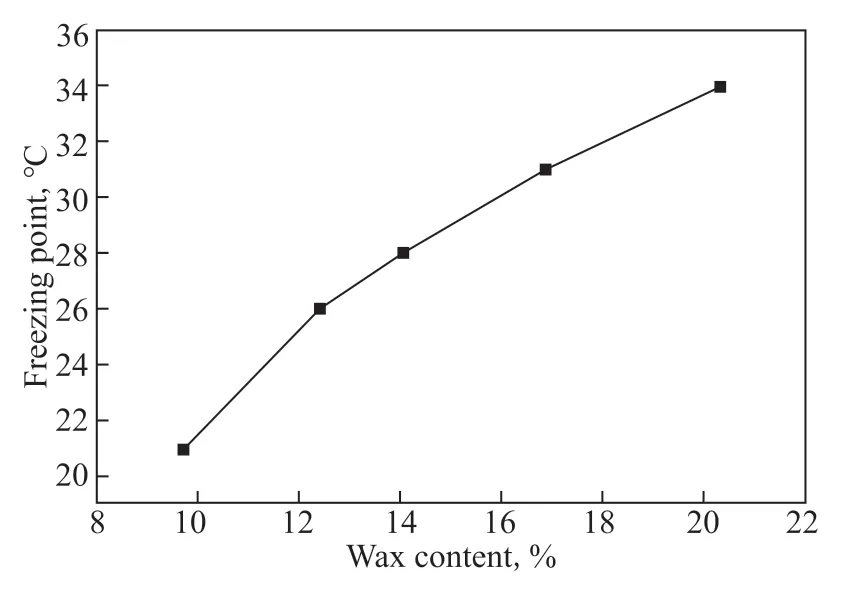
Figure 10 Variation of freezing point with wax content

Figure 11 Effect of wax content on results of wall-sticking experiments
With water contents of 70%, 80%, and 90%, WSOT is positively correlated with the wax content. As the wax content of the oil phase increases, the difference between the freezing point of the oil phase and WSOT shows a downward trend. The magnitude of this difference gradually decreases as the wax content increases.
3.1.3 Analysis of results
The results presented in this section demonstrate that wax affects the experimental results in three ways. First, the water film on the solid surface is destroyed under shear disturbance, and the part of the oil phase close to the oil-water interface contacts the solid surface. The polar compounds in the wax enable it to be preferentially adsorbed on the oil-water interface in the oil-water mixed system, and the N, O, and S functional groups are adsorbed on the solid surface[32-33]. Therefore, a higher wax content in the oil phase enables easier adherence to the solid surface, which is manifested by the increase in WSOT. The experiments were carried out at temperatures below the freezing point of the oil phase. Under the same temperature conditions, an oil phase containing wax precipitates wax crystals and forms a network structure. The wax crystal network is broken up under the action of shearing. However, under the same shear conditions, an oil-phase system with a higher wax content forms a relatively tight network structure due to the higher content of unbroken wax crystals. The volume of gelled oil is relatively high in these oil-water mixed systems, which increases the mass of the oil on the wall. Finally, under the condition of a high water content, the gelled oil in the low-temperature oil-water suspension forms a water-oilwater emulsion gel. In this system, the wax crystals are adsorbed on the interface between the dispersed droplets and the oil phase, and the size of the crystals precipitated in the oil phase remains the same under different wax contents. A higher wax content produces a stronger ability to wrap small water droplets, which increases the mass of the gelled oil on the wall.
In addition to the role of the wax component, the dispersed asphaltenes in crude oil have a strong spatial interference effect, causing the saturated wax molecules to exist in a supersaturated state in the crude oil. The aggregated asphaltenes act as a crystalline core for the wax molecules and promote the precipitation of wax molecules[49]. As the wax content gradually increases from crude oil AB-5 to AB-1, the asphaltene content also increases slightly. The dispersed asphaltenes in crude oil accumulate to a certain extent, which gradually reduces the freezing point of the crude oil. Consequently, the difference between the freezing point and WSOT gradually increases.
3.2 Influence of pH of water
3.2.1 WSOT experiments
The relationship between the WSOT of crude oil 3 and the pH of the water phase was quantitatively analyzed by adjusting the pH of the water phase to 4.6, 5.7, 6.5, 7.5, and 8.8 using HCl solution (0.1 mol/L) and NaOH solution (0.1 mol/L). The experimental results are shown in Figure 12.
In the acidic environment, WSOT gradually increases with increasing pH. When the pH is from 5.7 to 6.5, WSOT reaches its peak value of 32 °C. After entering the alkaline environment, WSOT decreases rapidly with further increases in the pH of the water phase. When the pH reaches 8.8, WSOT drops to 27 °C, which is 10 °C lower than the freezing point of crude oil 3.
3.2.2 Analysis of results
To analyze the reasons for the above trends, the contact angle of the oil-solid interface and the interfacial tension of the oil and water were measured using the devices specified in Section 2.2. The adhesion work was then calculated using Equation (3). The experiments were carried out at 35 °C, and the results are shown in Figure 13.
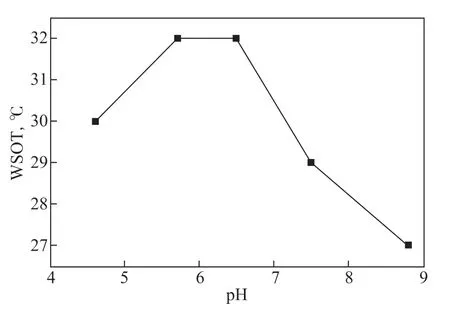
Figure 12 Effect of pH on WSOT (80% water content and 60 s-1 average shear rate)
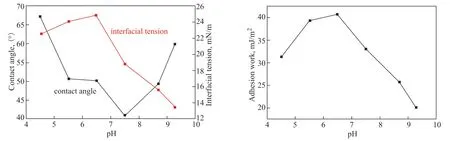
Figure 13 Effect of pH on contact angle, interfacial tension, and adhesion work
As the pH of the water phase increases, the contact angle of the oil-solid interface first decreases and then increases. The contact angle reaches its minimum value when the water phase is neutral. The change in contact angle with pH can be attributed to the change in surface charge. In acidic solutions, both the oil and solid surfaces have positive surface charges due to protonation. Hence, there is an electric double-layer repulsion between the oil and solid surfaces, which leads to a larger contact angle. In a solution with a pH of 5.5–6.5, the oil-solid interface charge is partially neutralized, which reduces the electric double-layer repulsion and contact angle. For a solution with a pH value greater than 7.5, the oil-solid interface is negatively charged due to the deprotonation of the interface, and electric double-layer repulsion occurs again.At low pH values, the interfacial tension of the oil and water shows an upward trend with increasing pH, reaching a maximum when the pH is about 7, before an obvious downward trend. In an acidic environment, H+reacts with the nitrogen and sulfur components in crude oil to form positively charged groups. These positively charged groups exhibit properties similar to cationic surfactants. Hence, they counteract the negative charge on the surface of the oil droplet and reduce the interfacial tension together with H+. In an alkaline environment, the carboxyl compounds in crude oil that can rapidly react with OH-contain small molecular compounds, such as naphthenic acid and fatty acids. These have a strong ability to diffuse to the oil-water interface and react with OH-to produce organic acid soaps with strong water solubility. These organic acid soaps contain strong interfacial active substances, which can reduce the oilwater interfacial tension.
With an increase in water-phase pH, the adhesion work first increases and then decreases. When the pH is 6.5, the adhesion work reaches its maximum value. When the adhesion work is large, the crude oil is more likely to adhere to the solid surface, and so the WSOT is higher. The curve and experimental results for WSOT are in good agreement, which verifies the accuracy of the experimental method.
3.3 Influence of water salinity
3.3.1 WSOT experiments
Solutions with five salinity levels were prepared to study how the water salinity affects WSOT. The specific configurations of the five solutions are listed in Table 6.
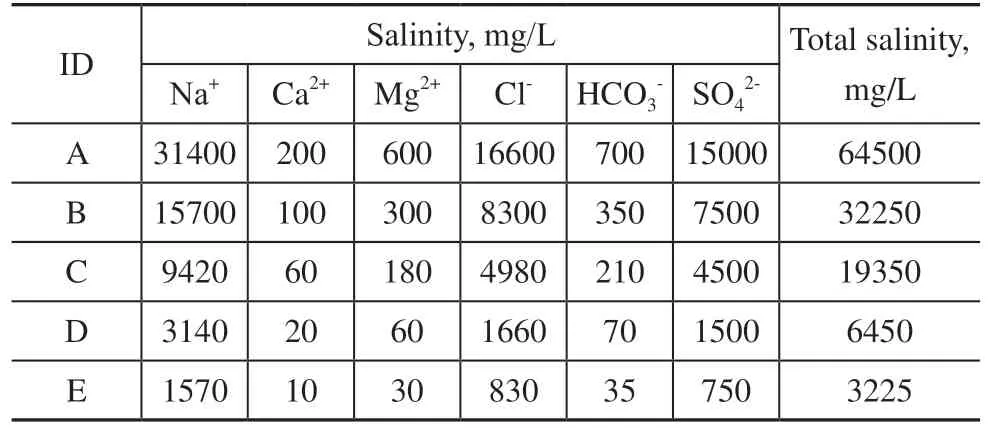
Table 6 Configurations of the five solutions with different salinities
The relationship between the WSOT of crude oil 3 and the salinity of the water phase was experimentally studied. Under the conditions of an 80% water content and 60 s-1shear rate, the change in WSOT is shown in Figure 14.

Figure 14 Effect of salinity on WSOT
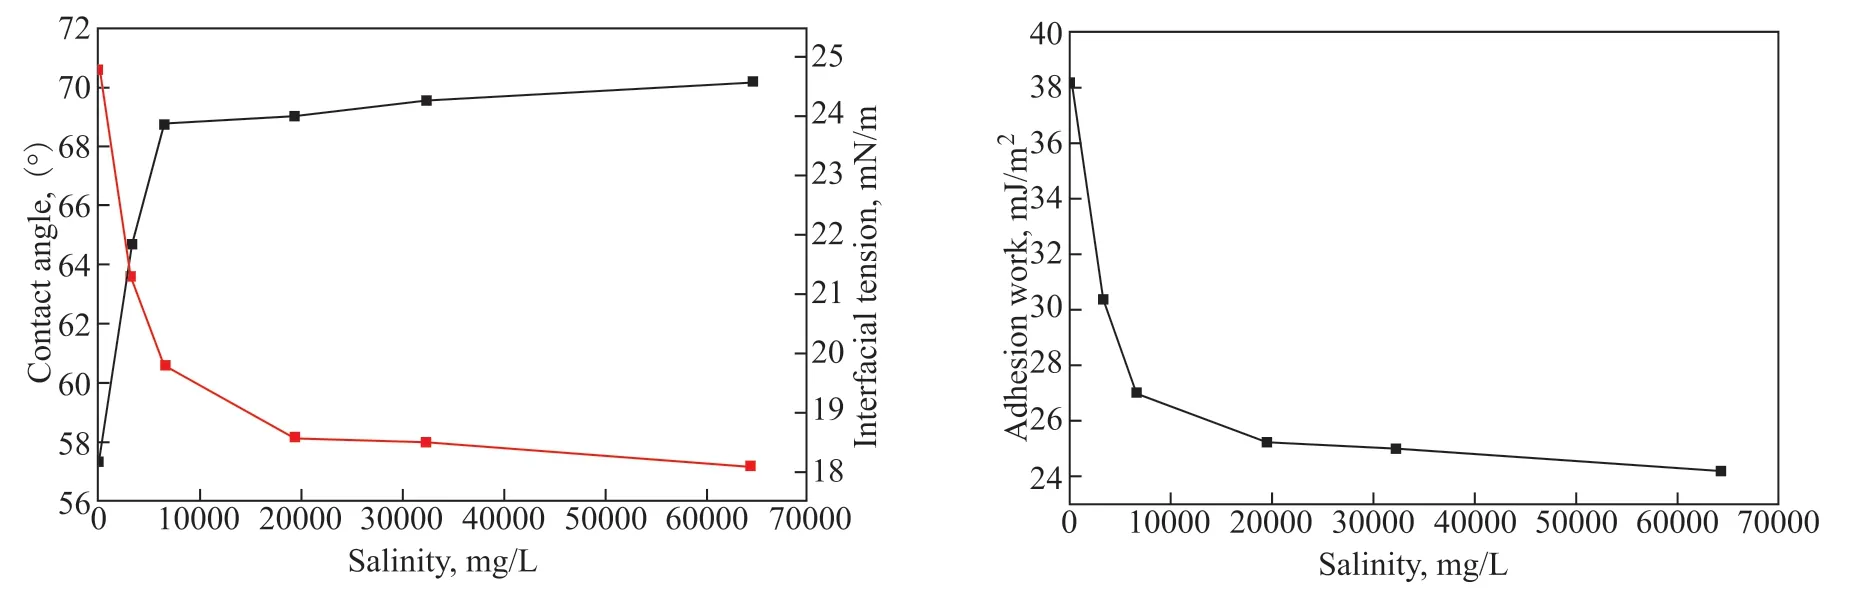
Figure 15 Effect of salinity on contact angle, interfacial tension, and adhesion work
When the salinity is in the range 0–6450 mg/L, WSOT drops from 32 °C to 31 °C as the salinity increases. When the salinity is in the range 6450–64500 mg/L, WSOT does not change significantly with increasing salinity.
3.3.2 Analysis of results
To analyze the experimental results, the oil-solid contact angle, oil-water interfacial tension, and oil-solid adhesion work were measured under the different salinities at 35 °C.At low levels of water salinity, the contact angle increases rapidly with any increase in salinity, and then becomes stable once the water salinity reaches a certain value. This experimental phenomenon can be explained by the change in the repulsive force of the electric doublelayer. According to Boltzmann’s distribution law, when the electrolyte concentration is low, the thickness of the electric double-layer decreases significantly with increases in ionic strength, resulting in a sharp increase in the repulsive force of the electric double-layer, which is represented by an increase in the oil-solid contact angle. When the electrolyte concentration is high, the repulsive force of the electric double-layer decreases with any further increase in electrolyte concentration, leading to no obvious change in the contact angle.
With an increase in water salinity, the oil-water interfacial tension decreases continuously. This is because the ionization equilibrium of oil-soluble interfacial active substances in crude oil shifts when they encounter ions in salt solutions. Consequently, interfacial active substances such as naphthenates are gradually dissociated from the crude oil, thus reducing the interfacial tension. With any further increase in salinity, the interfacial tension stabilizes rather than decreasing indefinitely due to the limited number of ions in the crude oil that can react.
The adhesion work was calculated using the contact angle and interfacial tension data. Its variation with water salinity is consistent with the WSOT experimental results, indicating that gelled oil cannot easily adhere to the wall at high levels of water salinity.
4 Conclusions
This paper has investigated the quantitative relationship between the oil and water components of crude oil and WSOT. The main components affecting the wall-sticking phenomenon were determined, and the impact of the interface properties on the oil-solid surface mechanical behavior was clarified.
We have found that, as the paraffin wax and polar compounds precipitate and are adsorbed on the oilwater interface to replace resins and asphaltenes, they are preferentially adsorbed on the wall surface, resulting in wax having the greatest impact on WSOT of all oilphase components. An increase in wax content produces a gradual increase in WSOT. In the presence of a water phase, the adhesion behavior between waxy crude oil and the wall surface is influenced by driving forces such as chemical action, the electric double-layer force, van der Waals force, and hydrogen bond force. As the pH of the water phase increases, WSOT gradually rises to a peak and then decreases rapidly, which is consistent with the variation of adhesion work with respect to the pH of the water phase. Therefore, an acidic/alkaline environment is more conducive to non-heating gathering and transportation. The water salinity has a small effect on WSOT. With an increase in salinity, the WSOT of crude oil 3 drops from 32°C to 31°C and then remains stable.
Acknowledgement:This work is finanically supported by the National Natural Science Foundation of China (NNFC, Grant No. 51534007).

- 中国炼油与石油化工的其它文章
- Synthesis and Evaluation of Microporous Metal Organic Frameworks for Light Hydrocarbon Adsorption
- Selection of Extraction Solvents for Bitumen from Indonesian Oil Sands through Solubility Parameters
- Synthesis of Hierarchical Porous Fe2O3/Al2O3 Materials and Study on Catalytic Viscosity Reduction of Heavy Oil
- Activated Carbon from Rice Husk with One-Step KOH Mechanical Mixing Activation as Adsorbent for Treating Phenolic Wastewater
- Effect of Particle Shape on Catalyst Deactivation during 2-Butene and Isobutane Alkylation of Liquid Phase in Fixed-Bed Reactor Using Particle-Resolved CFD Simulation
- Experimental and Numerical Investigation on Erosion Corrosion of the Air Cooler Tube Bundle in a Residue Hydrotreating Unit