
Optimized Process and Design: Incomplete Combustion in FCC Regenerators to Produce CO
2022-02-01 04:02YiCaiLiShiyuLiuZhiqiang
中国炼油与石油化工 2022年4期
Yi Cai; Li Shiyu; Liu Zhiqiang
(1. School of Chemical Engineering and Technology, Tianjin University, Tianjin 300350, China;2. Ningxia Ruiyuan Petrochemical Co., Ltd, Yinchuan 750004, China)
Abstract: The catalyst regeneration process running under the partial oxidation mode in traditional fluid catalytic cracking (FCC) units needs a carbon monoxide (CO) boiler to burn the flue gas, resulting in a large volume of CO2 emissions. In this study, the performance of a set of industrial serial-type FCC regenerators and the changes in flue gas composition were analyzed by establishing a model of the regenerators and the flue gas energy recovery section. Considering the value of utilizing CO, based on the simulation, this paper proposes two schemes for maximizing CO content in the flue gas of regenerators. The two sets of optimal process operating parameters were obtained using a genetic algorithm. Compared with the original process, the CO contents of flue gas in the two optimized processes increased to 6.6% and 12.5%, CO2 emissions were reduced by 48.4% and 96.7%, and the costs of CO production were 0.57 $/m3 and 0.84 $/m3, respectively.
Key words: FCC regenerators; rigorous process simulation; CO production; CO2 utilization
1 Introduction
Carbon monoxide (CO) can be produced from coal, oil, natural gas, biomass, and industrial exhaust gases such as blast furnace gas and Linz-Donawitz gas[1]. In industrial practice, CO is used to synthesize methanol, acetic acid, hydrogen, and a series of downstream products. In relation to the high demand for CO in the C1 chemical industry[2-3], the CO content of by-product gas of a catalytic cracking unit is expected to be enriched as supplementary feedstock for synthetic reactors nearby so as to further increase the required output.
Fluid catalytic cracking (FCC) regenerators are a core piece of equipment in FCC units. The function of an FCC is to burn the carbon deposit on the spent catalyst so that the activity of the catalyst can be restored[4]. Simulations of FCC regenerators have been widely studied. One of the earlier mathematical models of a regenerator was established by Pansing et al.[5], where the installation was described as a single-phase bed. To solve the difficulty of measuring the hydrogen combustion kinetics in industrial units accurately, Ford et al.[6]proposed that the rate of the hydrogen combustion reaction is 5–10 times that of the carbon combustion reaction. Han and Chung[7]put forward a detailed two-phase–two-regime model, in which the flow mode of gas in the regenerator is generally plug flow, while, for the solid phase; the dense bed was regarded as a continuous stirred-tank reactor (CSTR). Fernandes et al.[8]carried out a series of studies to obtain models that simulated the performance of industrial FCC units and could be adapted for different units of the same class. The entire gas–solid catalytic reaction can be described by a CSTR in their model, and the intrinsic CO/CO2ratio of coke combustion was proved to be affected by temperature and the contents of water, coke, and metal.Currently, with the popularization of computer technology and intelligent algorithms, research into the behavior of FCC regenerators is not limited to the establishment of mathematical models and process optimization. Rong[9]proposed a novel design scheme (oxy-regeneration) for the regeneration process, in which a mixed stream of O2and CO2gases was used as the auxiliary gas entering the regenerator. The design was proved to reduce CO2emissions effectively and simultaneously recover CO and CO2. Considering that CO generated by the incomplete oxidation of coke can promote the conversion of NO to N2, Li et al.[10]proposed a design scheme consisting of two-stage regenerators to reduce the content of NO in the regeneration flue gas effectively. Nabipour and Iranshahi[11]applied a chemical looping combination to residual FCC to improve the gasoline output of the riser and reduce coke generation on the catalyst effectively. Using the bioprocess simulators Aspen HYSYS and Aspen Plus, Wei et al.[12]established an industrial scale FCC model including a reactor–regenerator system and a CO2capture plant, and proposed a method for simultaneously optimizing CO2emissions and energy consumption in combination with heat integration. However, the purpose of most current studies is to further optimize the design or transformation in order to determine the appropriate operating parameters for the regenerator, and therefore its potential for CO preparation has been ignored. Note that the volume fraction (dry basis) of CO in the flue gas of a FCC regenerator reaches 2%–5%[13-14], and can be increased with the adjustment of operating conditions[9], such as incomplete combustion. The excess CO can be introduced into synthesizing reactors following separation.
The main aim of this study was to define appropriate operating conditions that contribute to the highest CO content in the flue gas of FCC regenerators and maximize their potential for retrofit. For this purpose, a steady-state model was established in order to simulate industrial FCC two-stage regenerators and the flue gas energy recycling section. To reduce CO2emissions and further increase CO content in the product, besides reducing the feed flow rate, an improved process was proposed, where a mixture of O2and CO2was introduced into the air blower in order to replace air as the agent supporting coke combustion in the case of incomplete combustion. To maximize the CO content, a genetic algorithm (GA) was employed in order to solve the constrained nonlinear problem (NLP). Finally, in order to evaluate the economic performance of the optimized processes, the CO production costs were calculated.
2 Process Description and Modeling
In this section, the regenerators and the flue gas energy recovery section are modeled, and the flowsheet is shown in Figure 1. The process consists of two regenerators (serial type), two external cyclones, a flue gas expander, a blower, a supercharger, and a CO boiler. The model is constructed as the theoretical basis for simulation and subsequent optimization, where the regenerators and the energy recovery section are formulated in MATLAB R2016a (www.mathworks.com) and Aspen Plus (www.aspentech.com), respectively.
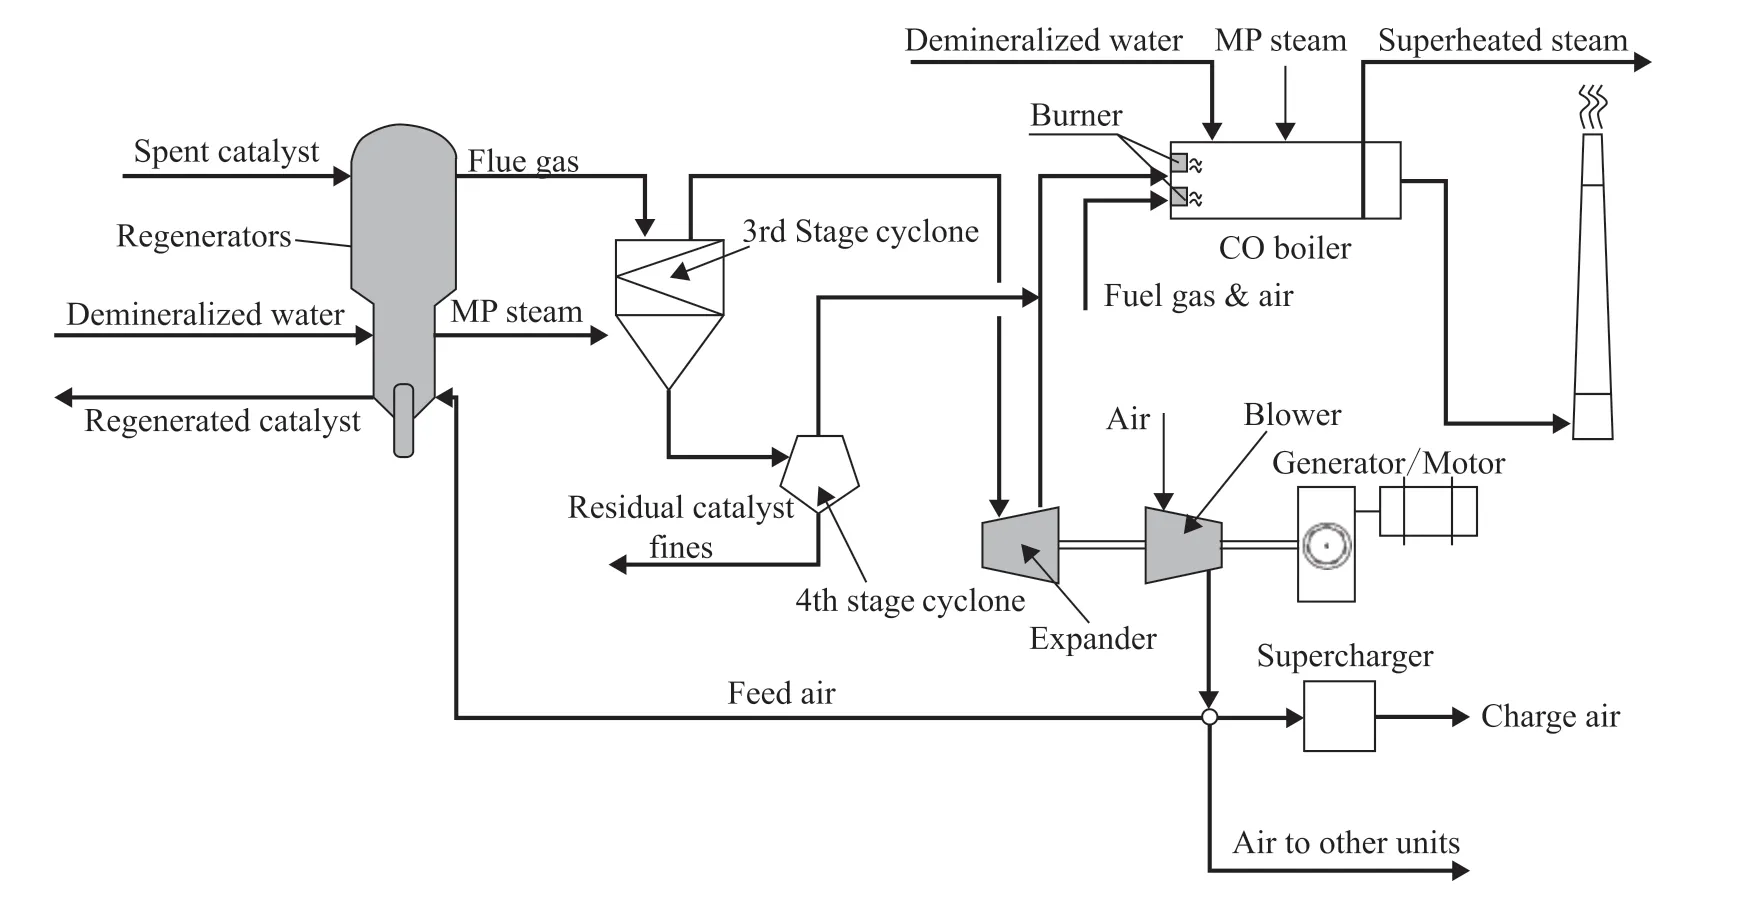
Figure 1 Process flowsheet for FCC regeneration with a CO boiler
2.1 Model of the regenerators
A schematic diagram of the model of the regenerators is shown in Figure 2. The spent catalyst is led to the first regenerator for coke burning through a slide valve, and is regenerated at a temperature of 940 K. The excess heat from the burning reaction is removed by the catalyst cooler. The catalyst is then transported to the middle of the dense bed of the second regenerator, and is completely regenerated in a countercurrent at a temperature of 970 K. Finally, the regenerated catalyst is transported to the riser reactor via another slide valve for recycling.

Figure 2 Schematic diagram of the serial type two-stage regenerators model
In this study, operating parameters that affected the composition of regeneration flue gas drew the most attention, so that the complex mass transfer process in the regenerator could be reasonably simplified. The dense bed of each regenerator was simulated as a single CSTR rather than as a classical two-phase model since its outlet parameters were not much different[8,15]. For the combustion kinetics of different industrial devices, correction coefficients need to be added appropriately in order to adapt to the actual operational data[16], and are related to the excess air coefficient[17]. Moreover, the quantity of catalyst stored in the freeboard was negligible compared with that in the dense bed, and the combustion of sulfur, nitrogen, and other elements in the spent catalyst contributed much less to the product than the coke[18]. In these regards, the various assumptions adopted are listed below.
1) Only the coke combustion and CO combustion reactions were carried out in the regenerators, which were controlled by the chemical reaction kinetics.
2) The hydrogen combustion kinetics were used only in the first-stage regenerator, and the rest of the hydrogen in the coke was burned out in the second-stage regenerator.
3) The dense bed was simulated as a CSTR, while the freeboard as a plug flow reactor (PFR), and the two regenerators were adiabatic.
4) The catalyst cooler had no chemical reaction and was integrated into the first-stage regenerator.
5) The gas entering the first-stage regenerator was fully mixed at the entrance, while its velocity was considered constant.
6) All of the catalyst particles returned to the bed after passing through the cyclones.
This study adopted the kinetic model of coke combustion and CO heterogeneous oxidation proposed by Fernandes et al.[8], as well as CO homogeneous oxidation proposed by Han and Chung[7]. The various expressions and parameters are listed in Table 1.
In Table 1,R,ε,ρ,w,P,σ,k,m˙,Mw,n˙,V,H,Q,A,h,Cp,Re,XC,Mc,u,d, andμrepresent the reaction rate, volume fraction, density, mass fraction, pressure, CO2/CO molar ratio, frequency factor, mass flow rate, molecular weight, molar flow rate, volume, specific enthalpy, heat, area, height, heat capacity, Reynolds number, conversion rate of the coke, catalyst inventory, velocity, diameter, and viscosity, respectively; subscripts including s, C, dry, wet, H, g, in, SC, out, D, F,σ, fg, mg, cyc, ct, mf, and t are for the solid phase, carbon in the coke, dry conditions, wet conditions, hydrogen in the coke, gas phase, entering into the units, spent catalyst, exiting out of the units, dense bed, freeboard, CO2/CO molar ratio, flue gas, mixed gas at the distributor, cyclone, catalyst transport line, critical fluidization, and particle exit, respectively; and superscript c is for the catalyst cooler.
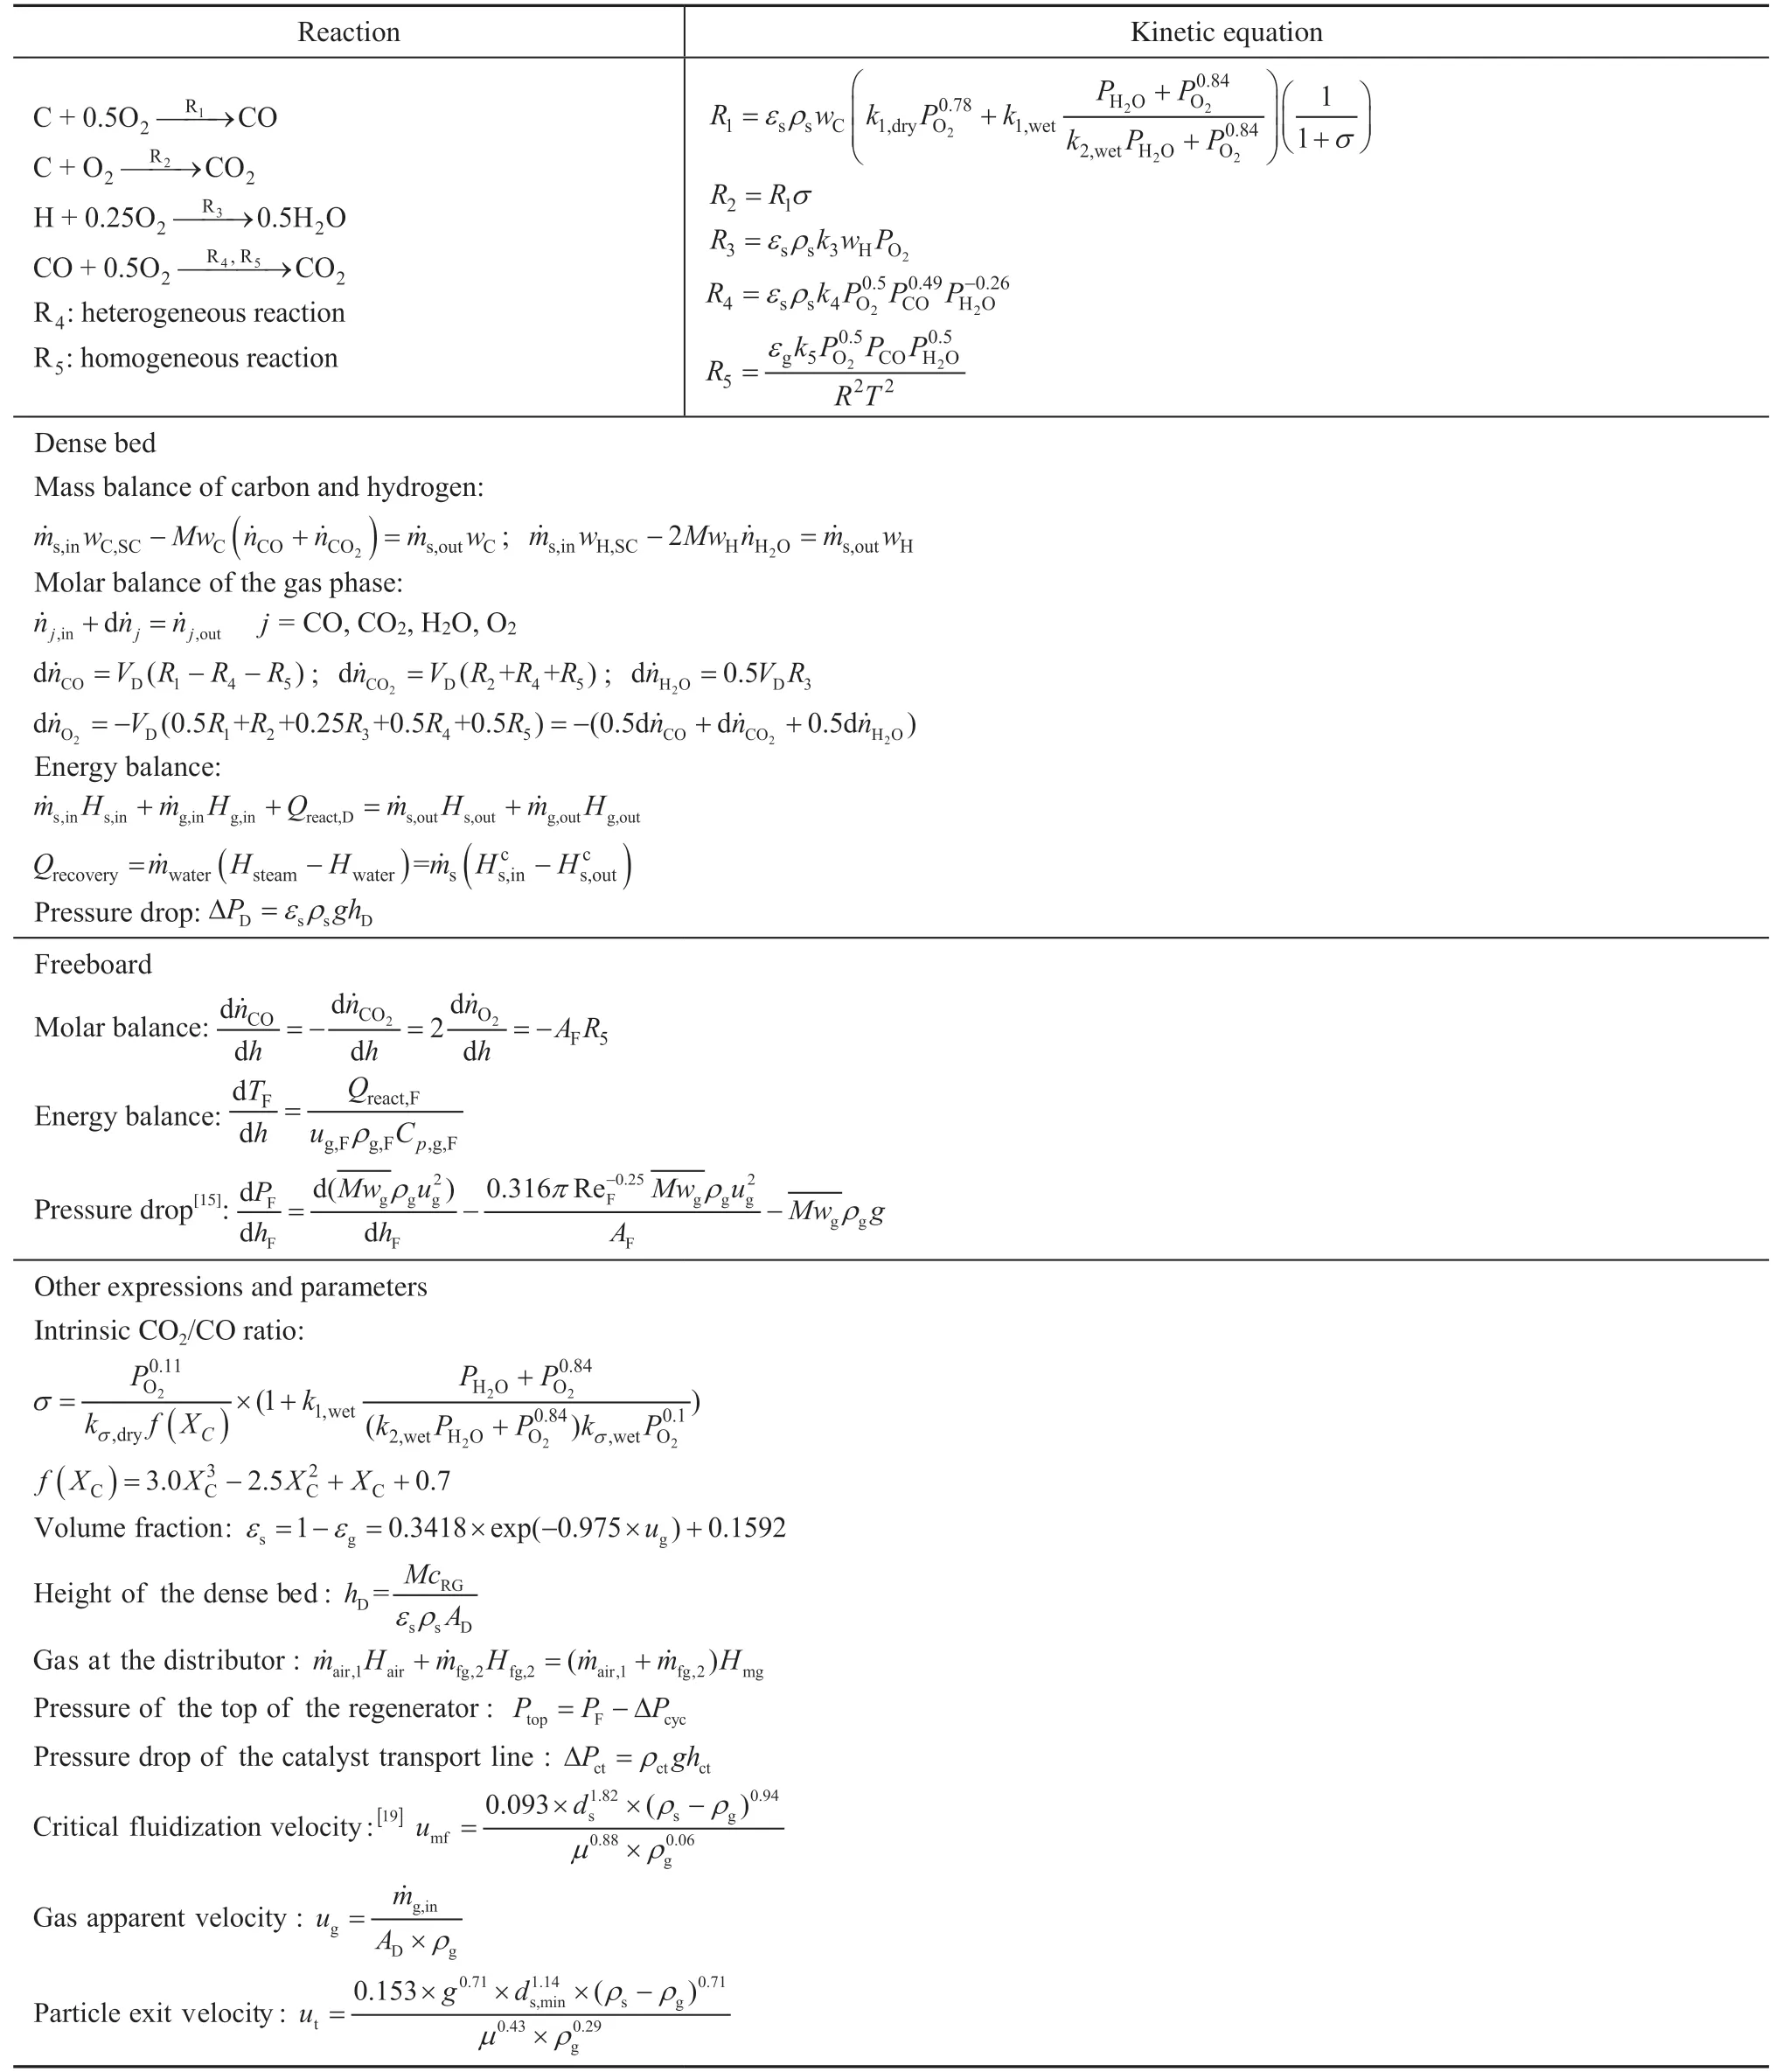
Table 1 Expressions and parameters used in the regenerators model
2.2 Model of the energy recycling section
In the boiler, there is a further improvement in the quantity of recoverable heat of the flue gas resulting from the combustion of CO in the burner, which then flows through the superheater, evaporator, economizer, and preheater to heat the feedwater. On the other side, following de-aeration, compression, preheating, and evaporation, the demineralized water from the pipe network becomes saturated steam and enters the superheater, together with the 3.5 MPa steam from the other steam generators, and the mixed steam is heated to 683 K.
Based on the simulation in Aspen Plus, a Peng-Robinson model was selected as the physical property method, and an RGibbs block was used to model the burner. To simplify the calculations, the mixing of flue gas and steam at the outlet of the CO boiler was regarded as isothermal, and the effect of equipment parameters was ignored. The flowsheet for this process is shown in Figure 3. The fuel gas was set as catalytic dry gas, and the excess air coefficient of the burner in the CO boiler was set as 1.5. The pinch point of the evaporator was set as 12.5 K.
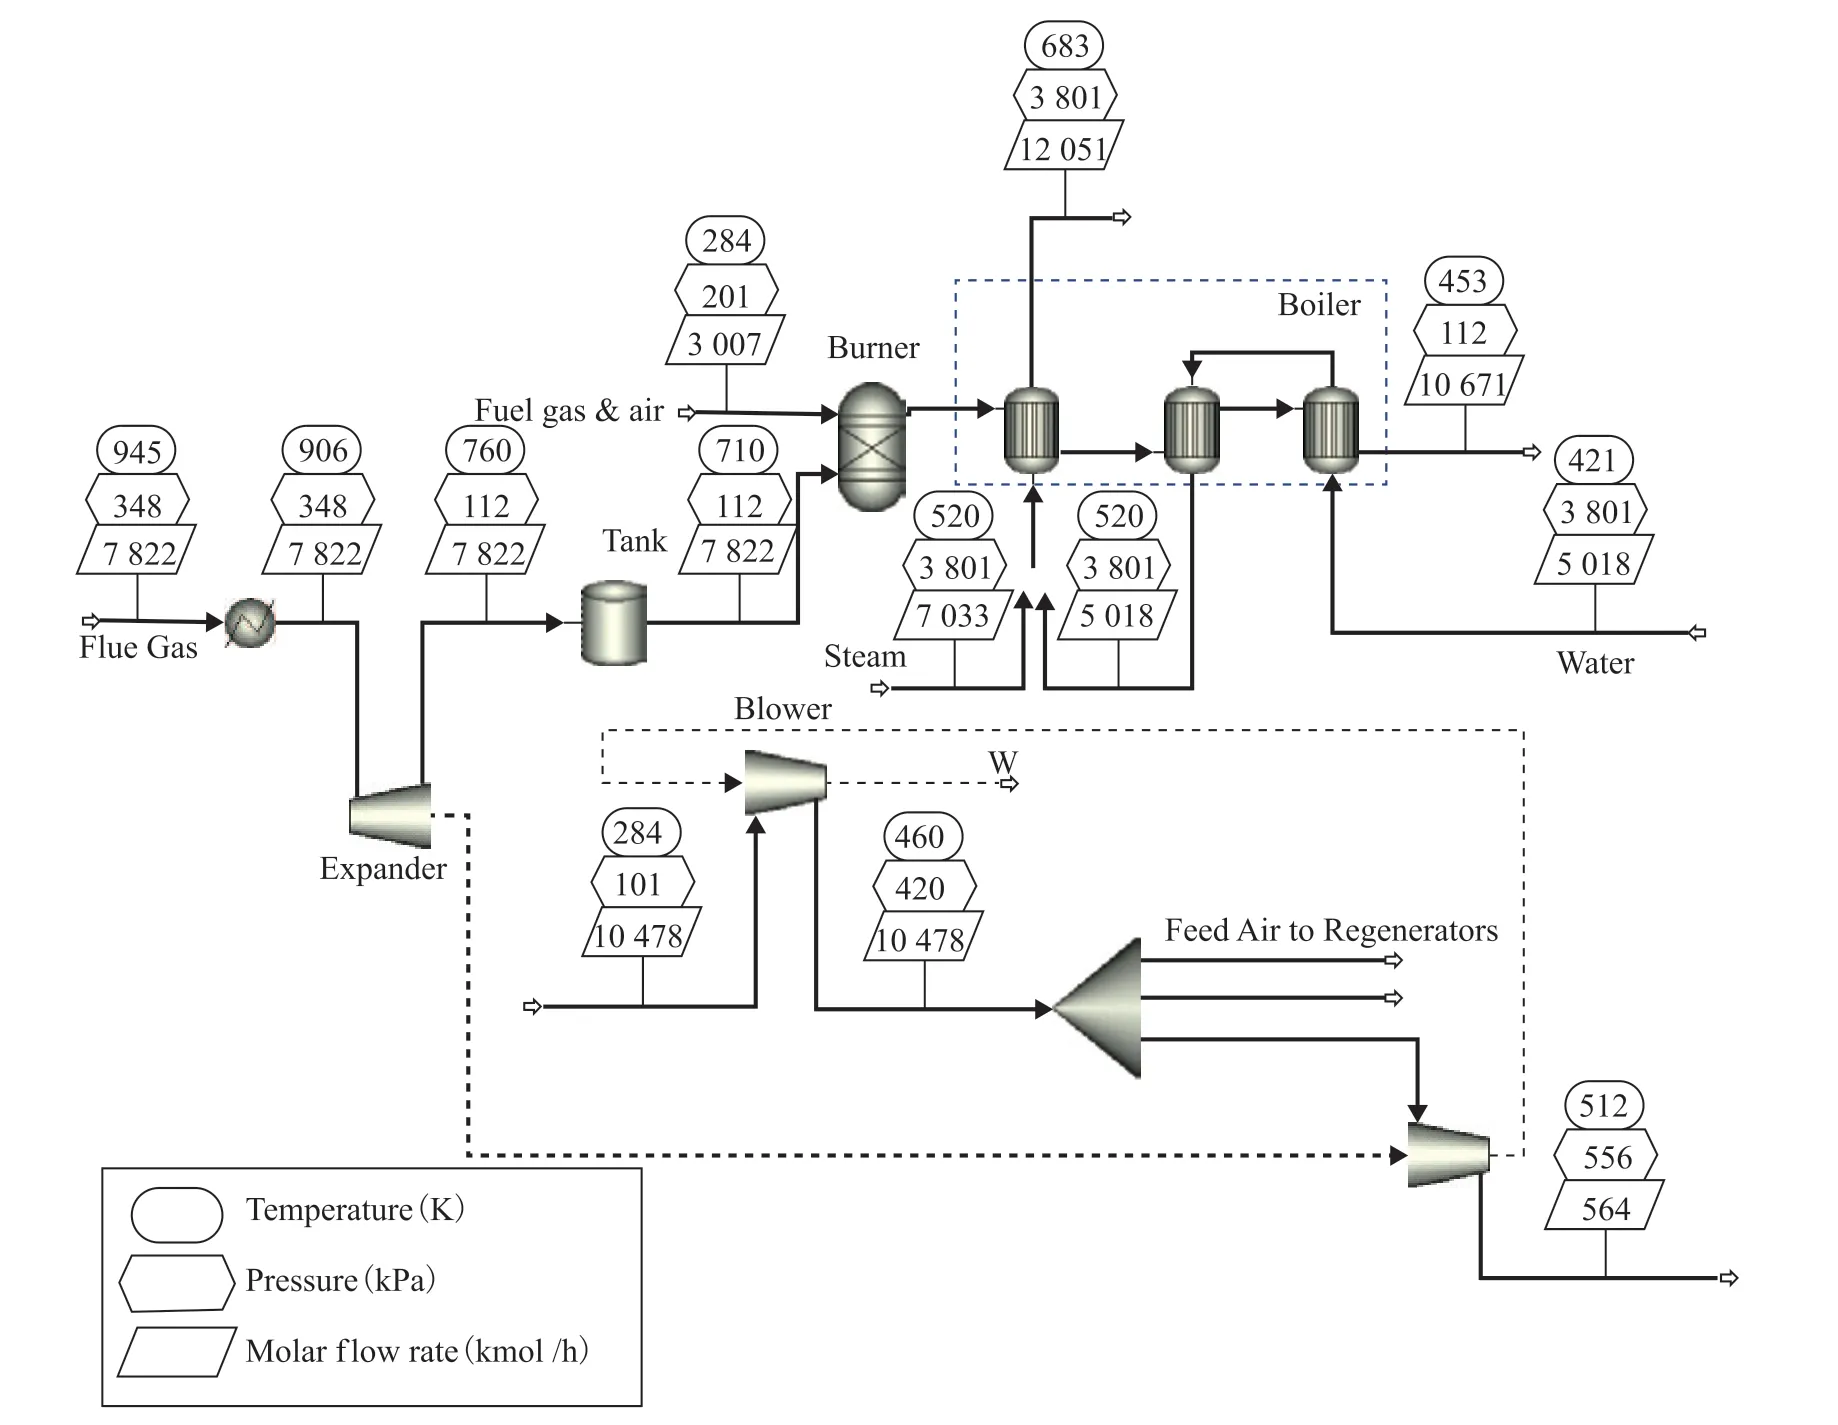
Figure 3 Progress diagram of the flue gas energy recycling section
2.3 Process validation
The equipment parameters and catalyst properties described in this paper are taken from industry data (Table 2), where the higher molar ratio of hydrogen to carbon in the coke results from the fact that the free water and bound water contained in the catalyst are not considered in the industrial analysis. The kinetic data used in the simulation are listed in Table 3. The simulation results reflected good agreement with the industry data (Table 4), which indicates that further analysis can be carried out.

Table 2 Parameters of the FCC regenerators

Table 3 Kinetic and thermodynamic data

Table 4 Model validation
3 Methodology
3.1 Optimization method
According to the model of the regenerators and the gas state equation, the pressure, velocity, and flow rate of the feed gas were constrained to each other, so it was impossible to study the optimal values of state variables individually using the control variable method. Thus, a GA was used in this paper to help find the optimal targets. In terms of economic benefit and coke burning intensity, the maximum CO content was selected as the objective.The interface of the two models was established in MATLAB to call the ActiveX automatic control server of Aspen Plus so as to run the simulation simultaneously. The optimized design steps are shown in Figure 4.

Figure 4 Flow diagram of the simulation-based objective process
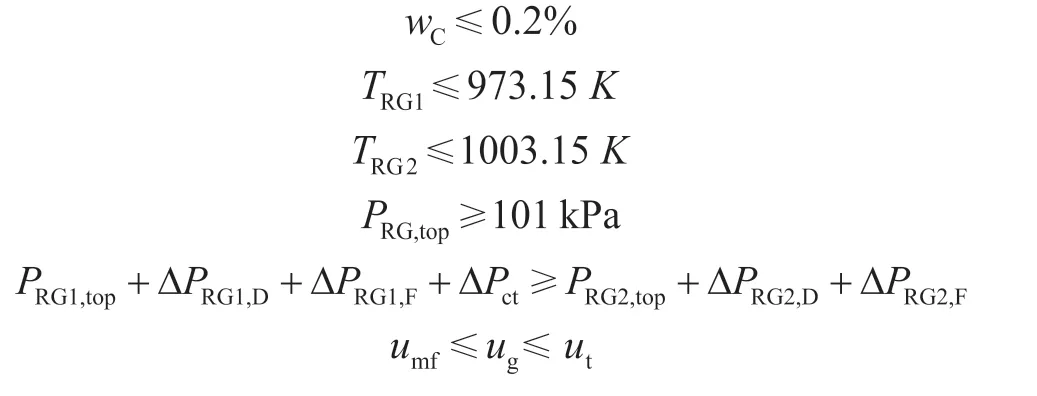
To maintain the catalyst activity, the temperature in the regenerator should not be too high. The driving force should be sufficient, and the fluidization state of the regenerators should be maintained. The constraints of the NLP can be conclusively set as:
3.2 Production costs
The CO production costs of the two processes are given by:
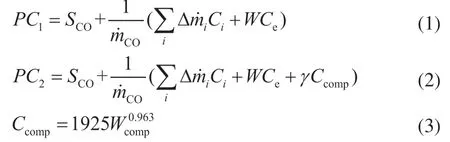
whereSCO,mCO, Δmi,Ci, ΔW,Ce,γ,Ccomp, andWcomprepresent the separation costs of CO, mass flow rate of CO, mass flow rate difference of raw material and product stream, price of raw materials and product stream, net power input, cost of electricity, conversion factor (2.5e−5), cost of the compressor, and the net power of the compressor, respectively.
The costs of the products, utilities, power, and the separation cost of CO are listed in Table 5. It is assumed that the flue gas is separated by COSORB[21]when air is introduced, and the CO2emission of the method was 0.190 kg CO2/kg CO[22]. Since it is more convenient to separate the mixture of CO and CO2, it was assumed that the flue gas was separated by pressure swing adsorption (PSA) when the mixed O2and CO2gases were introduced, and the CO2emission was 0.094 kg CO2/kg CO[22], and a gas compressor needed to be added to transport the gas mixture. It was assumed to operate 8000 hours a year, the investment payback period was 5 years, and the carbon tax was ignored.
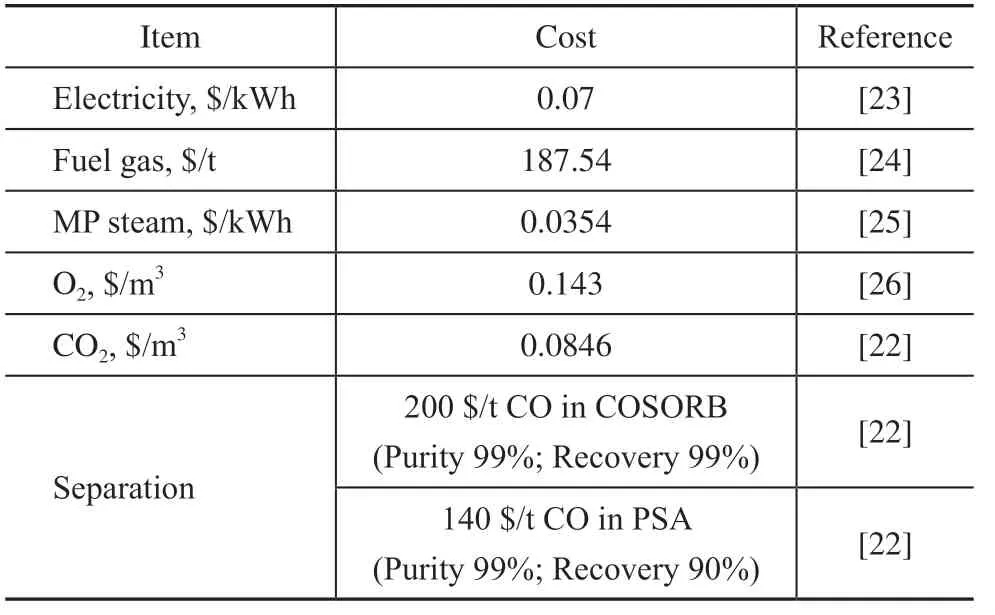
Table 5 Costs of raw materials, utilities, and products
4 Results and Discussion
4.1 Effects of temperature of spent catalyst on model parameters
The effect of temperature of the spent catalyst on the coke combustion reaction is shown in Figure 5. It can be seen that when the temperature increased by 10 K, the CO content increased by only 0.2% at most, but it took 4.14 MW of medium or high-grade thermal energy to heat the spent catalyst. It should be noted that too high a feed temperature readily caused hydrothermal deactivation of the catalyst. Obviously, the operation to change the temperature of the spent catalyst is not cost-effective.
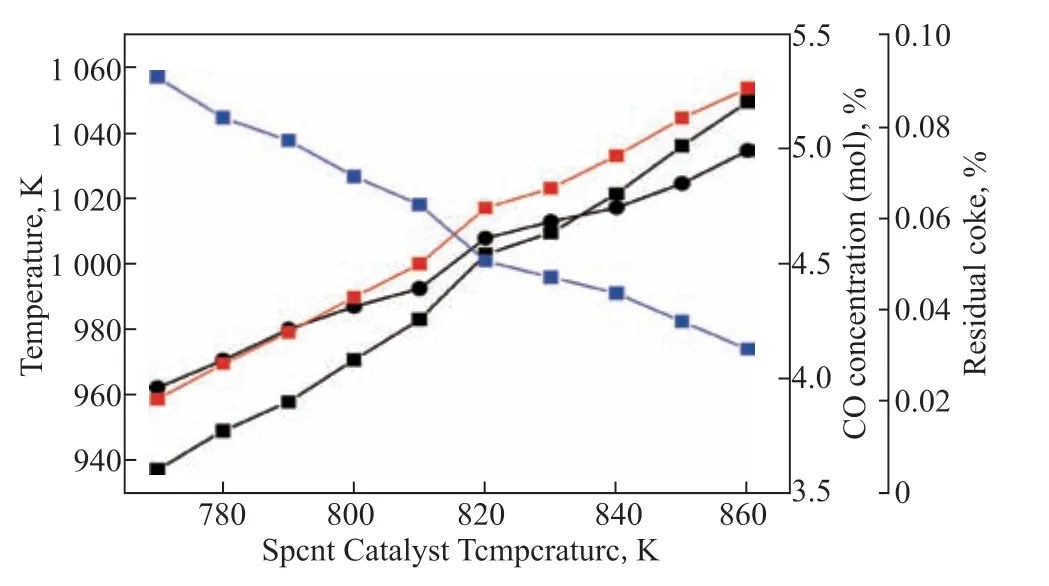
Figure 5 Effects of temperature of the spent catalyst on model parameters
4.2 Effects of recovered heat
Figure 6 shows the effects of heat recovered from the catalyst cooler under different conditions (base case (BC): air flow rate: 47 kg/s; air feed pressure: 320 kPa; feed ratio to the two regenerators: 1.5; high flow (HF) rate: air flow rate: 57 kg/s; low flow (LF) rate: air flow rate: 37 kg/s; high pressure (HP): air feed pressure: 465 kPa; low pressure (LP): air feed pressure: 175 kPa; high ratio (HR): feed ratio: 2.0; low ratio (LR): feed ratio: 1.0). There was a similar change between the temperature in the regenerator and the recovered heat, which illustrates that the regenerator temperature can be controlled by changing the recovered heat (Figure 6a and 6b). When the recovered heat was reduced by 10 MW, the CO content increased by 0.4% (Figure 6c) and the residual coke decreased by 0.015% (Figure 6d). As a comparison, cases of different air flow rates, pressures, and feed ratios (m˙air,RG1/m˙air,RG2) between the first regenerator and the second regenerator were studied. The ranges in which the CO content and the quantity of coke on the regenerated catalyst changed were sharpest with the variation of air flow rate (Figure 6c and 6d), indicating that the total air flow rate was the main factor affecting this. Moreover, a high air feed pressure (465 kPa) had negative effects on the CO content and positive effects on the coke burning intensity. A high air feed ratio (2.0) promoted an increase in both the former and the latter, while resulted in a large temperature difference between the two regenerators. To meet the requirements of the temperature for the regenerators (973.15 K, 1003.15 K), 0 to 20 MW was selected as the adjustment interval of the recovered heat, and 1.5 to 2.0 was selected as the adjustment interval of the feed ratio.
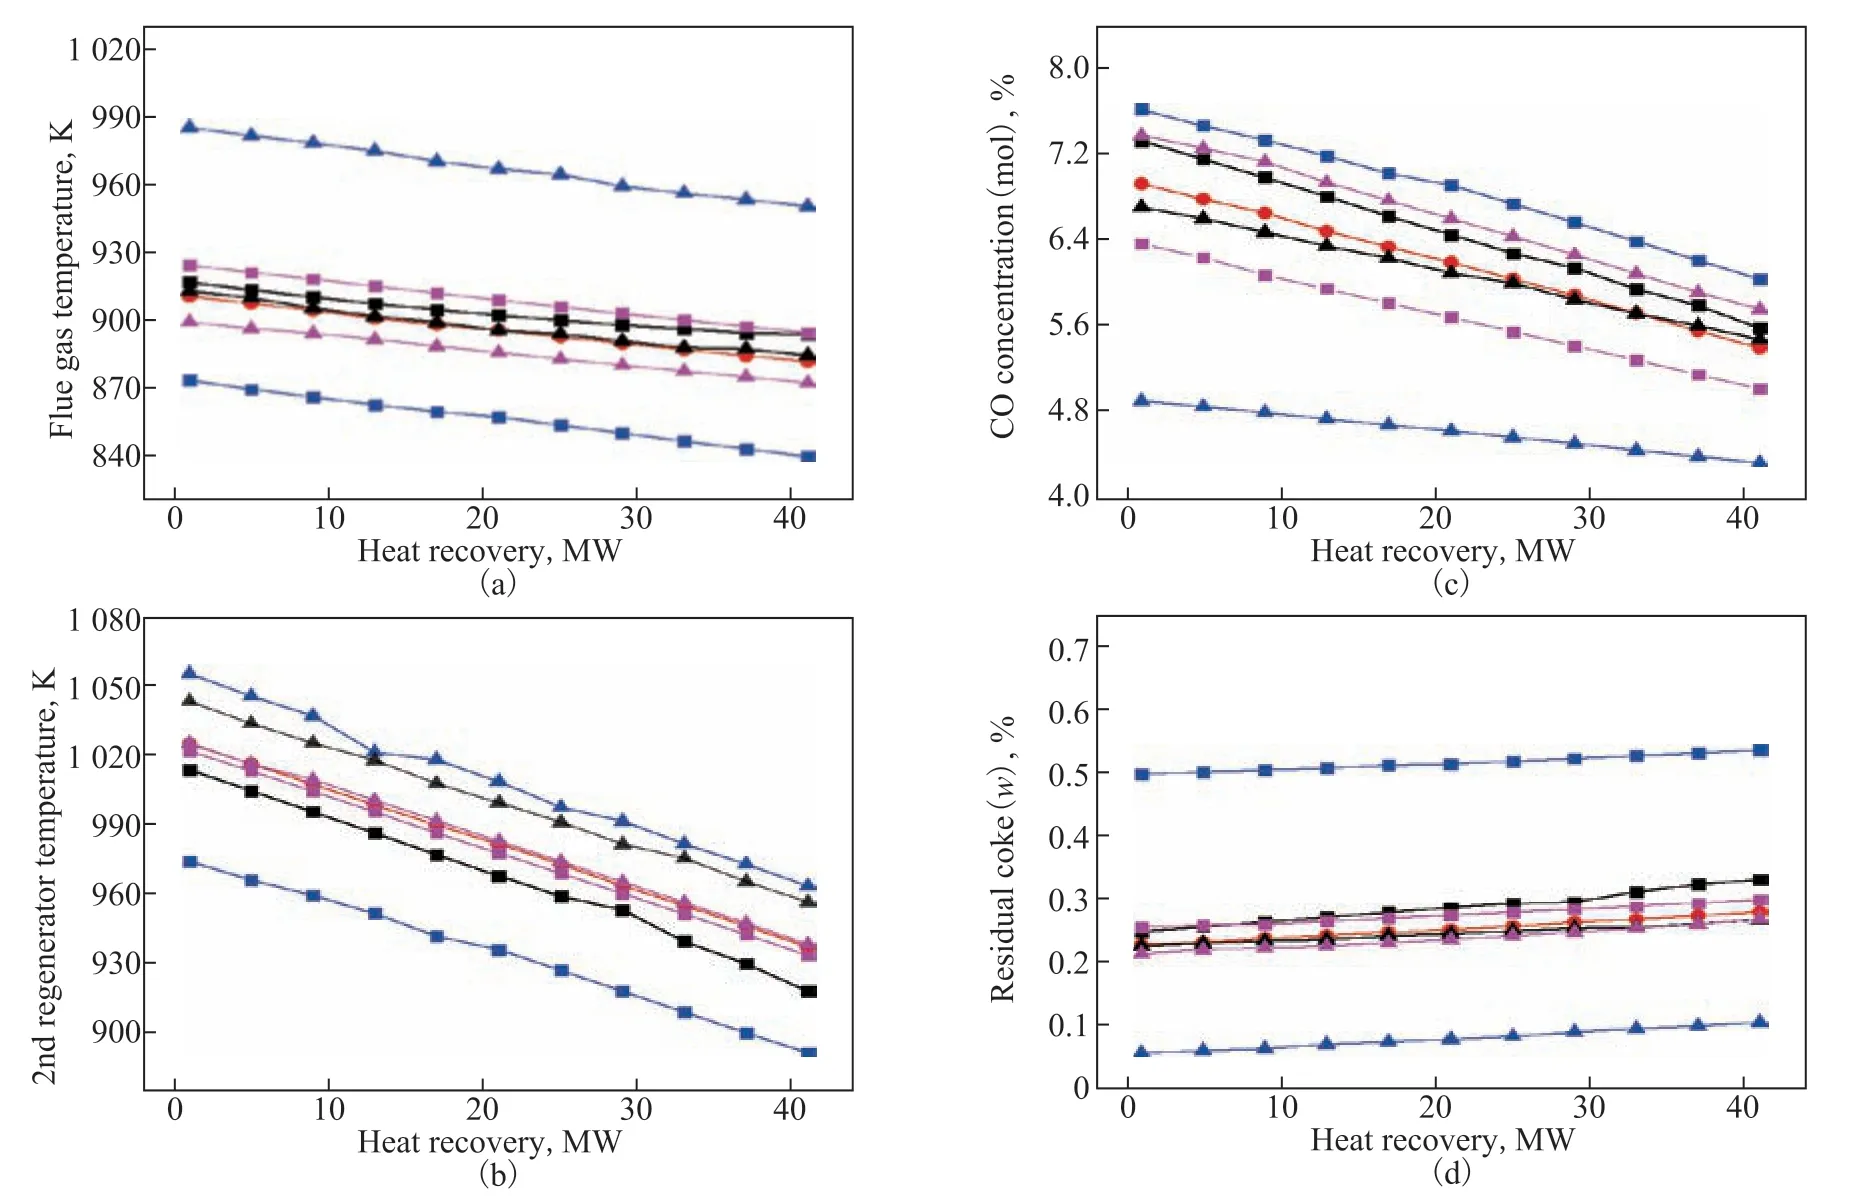
Figure 6 Effects of recovered heat on: (a) flue gas temperature; (b) temperature of the second-stage regenerator; (c) CO concentration of the flue gas; and (d) residual coke on the catalyst
4.3 Effects of feed gas composition
As important as the utilization value of the CO in the flue gas, the CO2emissions are also worthy of optimization. The mixed flue gas containing N2causes difficulties for separation and increases separation costs, and the separated vent gas is discharged directly, which leads to the emission of CO2. Therefore, it is proposed replacing the pressurized supporting air entering the regenerator with a mixture of O2and CO2[9]. The effects of O2concentration (feed O2molar flow rate: 0.35 kmol/s; pressure: 220 kPa; recovered heat: 15 MW) in the mixed gas on the CO content and coke burning intensity are shown in Figure 7. The CO content of the flue gas varied in the same way as the O2concentration in the feed gas (Figure 7a). With rising O2concentration, the residual coke of the regenerated catalyst decreased, while the temperature of the regenerators increased (Figure 7b), and the trend varied gently when the O2concentration exceeded 25%. This shows that increasing the O2concentration brings benefits to the coke combustion reaction, whose occurrence gradually shifted from the firststage regenerator to the second-stage one. Considering the economy of the purchased pure O2and the safety of the O2-rich mixture combustion, the O2concentration should not be too high. An O2molar concentration of 40% and a CO2molar concentration of 60% was taken to be the optimal composition of the mixed gas.
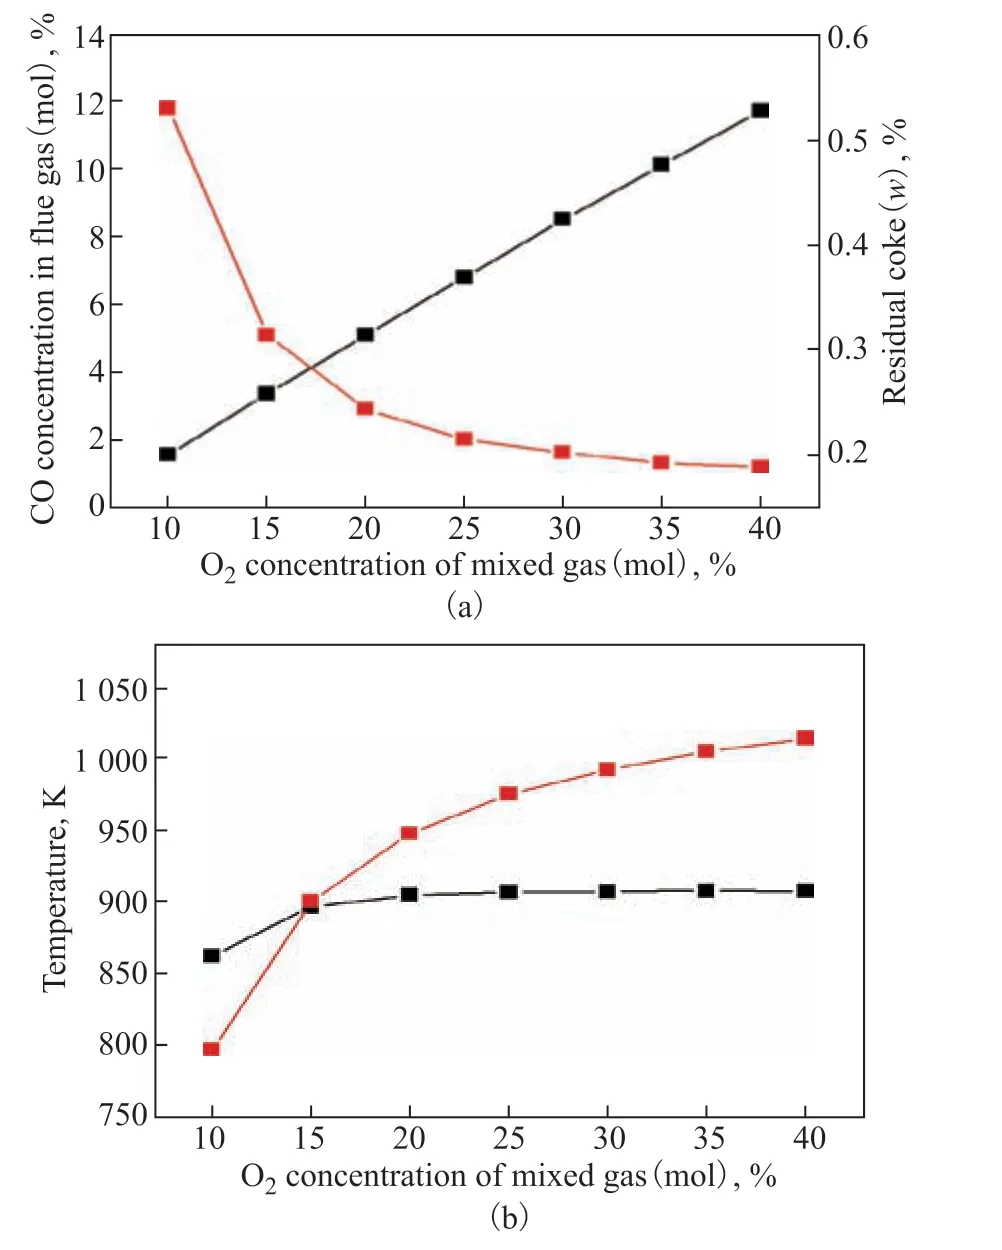
Figure 7 Effects of O2 concentration of the mixed gas on: (a) CO concentration and coke on catalyst; and (b) temperatures of the first and second regenerators
4.4 Effects of the feed gas state
The performance of the combustion reaction was further studied by varying the gas flow rate. At lower air flow rates, coke combustion was incomplete, and the CO2content increased with increasing air flow rate (Figure 8a, CO2), while the CO content was maintained. In this case, the post-combustion reaction of CO was limited, meaning that the coke combustion reaction was dominant and the CO/CO2ratio was high. Compared with the continuous decrease in CO content, the O2content increased with the transformation from incomplete to complete combustion, which was similar to the results of Han and Chung[7]. The coke content decreased with increasing pressure, and tended to be constant when the air pressure was higher than 270 kPa (Figure 8b). To meet the requirements for residual coke (0.2%), 47–52 kg/s was selected as the adjustment interval for the air flow rate, and 200–270 kPa was selected as the adjustment interval for air pressure. The case of the introduced mixed gases was similar to that for air (Figure 8c and 8d). A range of 34–39 kg/s was selected as the adjustment interval for the gas flow rate, and 150–210 kPa was selected as the adjustment interval for the gas pressure.
4.5 Optimized design
According to the sensitivity analysis, two situations, air as the feed gas and O2+CO2mixed gases as the feed gas, were considered in our study. In the optimized design 1, the feed air and the coke on the spent catalyst were burning incompletely in the regenerators, and the flue gas was sent to a separation section to recycle the CO following its heat recovery without combustion (Figure 9a). In the optimized design 2, the mixed gases went through the same process, and the separated CO2was partially recycled and mixed with the feed O2(Figure 9b), which reduced the cost of outsourcing.

Figure 8 Effects of state parameters of feed gas on model parameters: (a) air flow rate; (b) air pressure; (c) mixed gas flow rate; and (d) mixed gas pressure (P: pressure; EH: recovered heat)
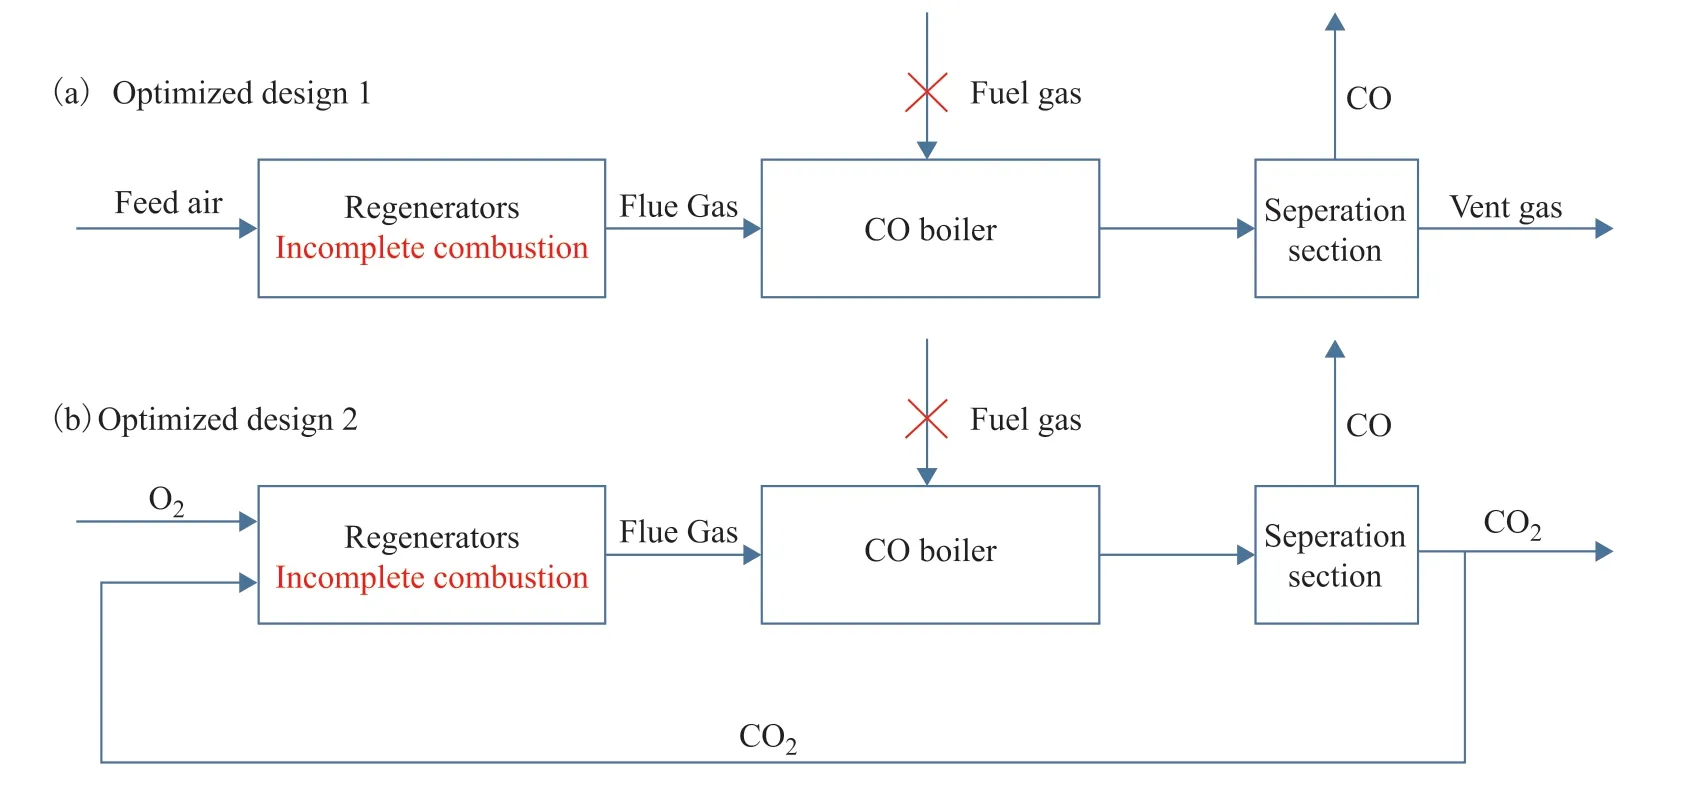
Figure 9 Gas-phase flow in the optimized designs
Table 6 presents the optimization interval of the variables and the optimization results obtained with use of the GA. The results indicated that the CO content reached 6.6% when air was introduced and 12.5% when the O2+CO2mixed gases were introduced.
4.6 Comparison of the optimized and conventional processes
Table 7 presents a detailed comparison of the conventional and optimized processes. In the conventional process, the combustion of the fuel and flue gases is used as the heat source for the CO boiler, resulting in a large quantity of CO2emissions (1398 kmol/h). All of the heat generated by the combustion gas was used to generate medium pressure (MP) steam (217.1 t/h). In the optimized process, it is used mainly to reduce the flow rate of the feed gas, to select an appropriate pressure as well as feed ratio, and to change the composition of the incoming gas so as to increase the CO content in the flue gas from 4.2% to 6.6% to 12.5%. The net power of the air blower was reduced from 15.3 MW to 8.0 MW and then to 6.7 MW. The CO production costs of the two optimized processes were 0.57 and 0.84 $/m3, respectively. This is equivalent to a cost of 0.27 $/m3of CO for further treatment of CO2. More importantly, due to the increase in the conversion rate of coke to CO, the CO2content in the flue gas was reduced effectively. In the optimized design 1, the CO2emission in the vent gas was reduced to 721 kmol/h; in the optimized design 2, the composition of the flue gas was mainly CO and CO2, which can be separated by effective means. Theoretically, high purity CO and CO2can be obtained out of the unit, that is, the CO2emissions can be dramatically reduced (46 kmol/h). However, the result of these designs is that the quantity of steam generated by the boiler is greatly reduced (46.6 and 55.6 t/h, respectively).

Table 6 Interval and optimized results for the selected variables

Table 7 Detailed comparison of the conventional and optimized design processes
5 Conclusions
Based on the simulations carried out with MATLAB and Aspen Plus, this study proposes two optimization schemes for fluid catalytic cracking (FCC) regeneration and the flue gas energy recycling section. The results showed that 231.2 kPa, 48.79 kg/s air or 171.0 kPa, 36.98 kg/s mixture of O2(40%) and CO2(60%) can be introduced as the feed gas, and combustion in the CO boiler is prevented. Compared with the conventional process, when air with a low flow rate is introduced, the CO content of the flue gas increased to 6.6%, and the CO production cost was 0.57 $/m3. When an O2and CO2mixture with a low flow rate was introduced, the CO content of the flue gas increased to 12.5%, and the CO production cost was 0.84 $/m3. The volume of fuel gas introduced into the boiler decreased by 100%, which reduced CO2emissions by 48.4% when introducing air and by 96.7% when introducing the O2and CO2mixture. The optimized processes can be integrated with the corresponding CO recovery, synthesis gas production, and CO2capture unit in future studies so as to expand the function of FCC regenerators and reduce the carbon emissions of petrochemical plants.
- 中国炼油与石油化工的其它文章
- Synthesis and Evaluation of Microporous Metal Organic Frameworks for Light Hydrocarbon Adsorption
- Selection of Extraction Solvents for Bitumen from Indonesian Oil Sands through Solubility Parameters
- Synthesis of Hierarchical Porous Fe2O3/Al2O3 Materials and Study on Catalytic Viscosity Reduction of Heavy Oil
- Activated Carbon from Rice Husk with One-Step KOH Mechanical Mixing Activation as Adsorbent for Treating Phenolic Wastewater
- Effect of Particle Shape on Catalyst Deactivation during 2-Butene and Isobutane Alkylation of Liquid Phase in Fixed-Bed Reactor Using Particle-Resolved CFD Simulation
- Experimental and Numerical Investigation on Erosion Corrosion of the Air Cooler Tube Bundle in a Residue Hydrotreating Unit