
On the green aurora emission of Ar atmospheric pressure plasma
2022-06-01 07:56FengwuLIU刘凤梧LanlanNIE聂兰兰andXinpeiLU卢新培
Plasma Science and Technology 2022年5期
关键词:兰兰
Fengwu LIU (刘凤梧), Lanlan NIE (聂兰兰) and Xinpei LU (卢新培)
State Key Laboratory of Advanced Electromagnetic Engineering and Technology,School of Electrical and Electronic Engineering, Huazhong University of Science and Technology, Wuhan 430074, People’s Republic of China
Abstract The Ar atmospheric pressure plasma was found to be an excellent laboratorial source for green aurora emission.However, the characteristic and production mechanism of the green aurora emission of the Ar atmospheric pressure plasma are still not clear.In this work,an Ar plasma in a long glass tube which emits intense green aurora light is investigated.With the long glass tube,it can be concluded that the green aurora emission in the Ar plasma is not owing to the mixture of Ar plasma plume with the surrounding air.It is also found that the green aurora emission often appeared beyond the active electrode when the active electrode is placed at the downstream of the gas flow.The green emission disappears when the traces amount of O2 or N2(about 0.05%-0.07%)is added to Ar.This is because the O2 molecules deactivate the upper state O(1S),which results in the decrease of the green emission.On the other hand,when N2 is added,Ar metastable atoms are quenched by N2,which results in the decrease of O atoms and eventually leads to the decrease of the green emission intensity.The intensity of the green aurora emission increases when the driving voltage frequency increases from 1 to 10 kHz.More importantly, it is found that the green aurora emission is not affected when a grounded stainless steel needle is in contact with the plasma plume.Thus,the green emission is not driven electrically.All these findings are helpful for the understanding of the physics and its applications of atmospheric pressure plasma jet in space physics, laser physics and other application areas.
Keywords: atmospheric pressure plasma jet, plasma optical emission, aurora emission
1.Introduction
It is well known that the emission from the forbidden oxygen transition(1S-1D,557.7 nm)is the source of the green aurora[1].This green aurora transition is considered as an attractive candidate for applications such as high energy laser [2, 3],materials [4] or waste water treatment [5].
Therefore,creating artificial aurora emission is not only a major project of aurora physics but also important for its applications.Some researchers have reported artificial aurora emission by electron beam excitation [6], photolysis of oxygen-containing compounds[7-10],or low pressure discharge tube[11-13].These experiments are often under low pressure with expensive and complex vacuum equipment.Open atmosphere is difficult for the production of O(1S)because O2concentration must be kept very low condition.
Recently, researchers observed green aurora line of wavelength 557.7 nm produced by atmospheric pressure plasma[14-20].Several early works reported the observation of the aurora line emission from atmospheric pressure DBD with N2or its mixtures as working gas[14,15,20].However,as the emission intensity of the aurora line is weaker than N2or NO emission, the green aurora emission is not obvious by naked eyes.Then, Sasaki et al reported visible green aurora emission from atmospheric pressure plasma jet (APPJ) with N2+ O2(7 slm + 50 sccm) as working gas [16].Sylvain Iséni reported weak green aurora emission in their Ar APPJ[17].However, the observed green aurora emission is still weak and not obvious.Motomura et al reported the green aurora emission of an Ar APPJ with high gas flow rate to keep low O2concentration in the jet region.Even so,the length of the plasma with green emission is very short [18].Recently,Jaiswal et al reported intense green aurora emission from an Ar APPJ driven by kHz AC power supply [19].Since Ar plasma jet is easy to build [21-26], it might be a potential source of the artificial aurora emission.
However, up to now, all the studies did not pinpoint the condition of the appearance of the green aurora emission.According to the result reported in reference [19], it seems like that the green aurora line emission appears when the plasma injects into the open air.But in our experiment, it is found that the green aurora emission can also be observed in a dielectric tube.
In the Earth’s atmosphere at high altitude,O(1S)is excited by the high-energy charged particles.In this work, we use atmospheric pressure DBD plasma, which also produces several high-energy charged particles, in particular high-energy electrons, to excite the O atoms.We present the investigation of the aurora green emission from the Ar plasma generated in a long quartz tube.As the gas component is kept constant by the long tube, it is found that the appearance of the green aurora emission is related to the position where the high voltage electrode is placed and the gas flow rate.According to the spatial resolved emission spectrum of the plasma, it is found that the green aurora emission intensity is high in the area where the Ar emission is weak.Besides, it is found that the green aurora emission disappears when about 0.05%-0.07%of O2and N2is added to the working gas.According to the dynamic characteristic of the discharge, the green aurora emission appears after the end of the main discharge.Finally,it is found that the appearance of the green emission is not affected when a grounded stainless steel needle is in contact with the plasma plume, which indicates that the green emission is not electrically driven.All these findings will be helpful for the understanding of the mechanism of the appearance of the green aurora emission and its application in space physics,laser physics and other application areas.
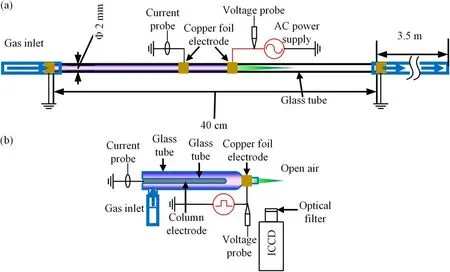
Figure 1.Schematic of the experimental apparatus.(a) Plasma generated inside a tube and (b) plasma generated in open air.
2.Experimental setup
The schematic illustration of the experimental setup is shown in figure 1.As shown in figure 1(a),a quartz tube with length of 40 cm is used in this experiment and its right end is connected with a 3.5 m flexible tube to minimize the diffusion of the surrounding air into the quartz tube.The inner and outer diameters of the quartz tube are 2 mm and 3 mm,respectively.The ring electrodes are made of copper foil with width of 5 mm.The distance between the two electrodes is 2 cm.One of the electrodes is connected to a kHz AC power supply.The voltage is fixed at 28 kV(peak to peak)with frequency of 9.8 kHz.The other electrode is grounded.Research grade Ar(99.999%) is used as working gas, and traces amount of O2and N2(0%-0.08%) is added to the main working gas Ar to see how it affects the green light emission.The gas flow rates are controlled by mass flow controller.
The optical emission spectrum is acquired by a halfmeter spectrometer(Acton Research Corporation SpectraPro-2500i)and a 1200 gr mm-1grating is used in this experiment.To acquire a fine resolution spectrum, an Andor ICCD(DH334T) was coupled with the Acton spectrograph.
Due to the poor repeatability of the discharge used in figure 1(a), another experimental setup driven by an Eagle harbor (NSP-120-30-P) nanosecond pulse power supply is used to capture the high speed photographs of the green emission as shown in figure 1(b).The outer and inner diameters of the discharge tube are 8 mm and 6 mm, respectively.The discharge tube has a length of 5 cm with a nozzle length of 1 cm.The inner column electrode which is made of soldering covered by glass tube serves as the ground electrode.The outer ring electrode made of copper foil is the high voltage (HV) electrode.The HV ring electrode has a width of 5 mm.To capture the dynamics of the green aurora emission of the plasma, a band-pass optical filter (Rayan BP550-10-254, center: 550 nm, bandwidth: 10 nm) is placed in front of the ICCD camera.
3.Results
The aim of this experiment is to investigate the specific conditions of the appearance of the ‘green plasma’.For the experimental setup of reference [19], Jaiswal et al observed apparent ‘green plasma’, where the active electrode is placed at the downstream of the Ar gas flow,which is different from the setup of most APPJ.Therefore, in the next, firstly, the relationship of the appearance of the ‘green plasma’ and placement of the active electrode at upstream or downstream is investigated.
The photographs of the Ar plasma with the active electrode placed at the downstream and upstream of the gas flow are shown in figures 2(a)and 3,respectively.Research grade Ar is used in the experiments,and the gas flow rate is adjusted from 0.5 to 6.0 l min-1.As the inner diameter of the quartz tube is 2 mm, we estimated the gas flow speed and indicated in figure 2(a).It is found that the plasma is much longer on the ground electrode side than on the active electrode side regardless the active electrode is placed on the downstream or the upstream of the gas flow as shown in figures 2(a) and 3.When the active electrode is placed at the downstream of the Ar gas flow as shown in figure 2(a),the‘green plasma’can be observed at the downstream of the active electrode.The green light emission is weak for the gas flow rate of 0.5 l min-1.When the gas flow rate is increased from 1.0 l to 3.0 l min-1,the length of the ‘green plasma’ increased dramatically and achieved the longest at flow rate of 3.0 l min-1.With further increase of the flow rate to 6 l min-1,the length of the‘green plasma’decreases slightly.The corresponding driving voltage and current waveforms for gas flow rate of 6 l min-1are shown in figure 2(b).It is clearly shown that the discharge current has many spikes and thus the repeatability of the discharge is poor.It should be emphasized that as the discharge is with poor repeatability, the current is the total current with the displacement current and conducting current.
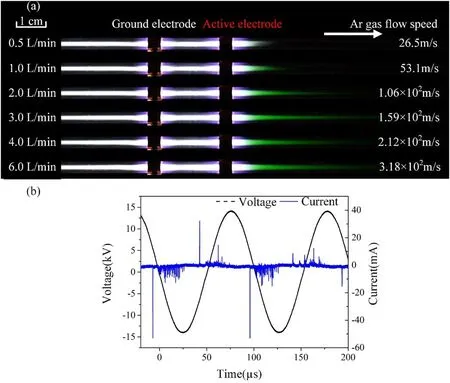
Figure 2.(a)Photographs of the Ar plasma with the active electrode placed at the downstream,the gas flow rate varies from 0.5 l min-1 to 6.0 l min-1.(b) The corresponding voltage and current waveforms.Gas flow rate: 6 l min-1; applied voltage: 28 kV (peak to peak);frequency: 9.8 kHz.
When the active electrode is placed at the upstream, the plasma at the downstream of the gas flow appears mainly white with weak green emission as shown in figure 3.No obvious green emission is observed on side of the active electrode at the upstream.When the gas flow rate is increased from 0.5 l to 3 l min-1, the appearance of the plasma has no obvious difference,which is different from that of figure 2.On the other hand, by decreasing the voltage to 20 kV (peak to peak), the green emission from the downstream of the gas flow of the ground electrode becomes more obvious as shown in figure 4.

Figure 3.Photographs of the Ar plasma with the active electrode placed at the upstream, the gas flow rate varies from 0.5 l to 6.0 l min-1.Applied voltage: 28 kV (peak to peak); frequency: 9.8 kHz.
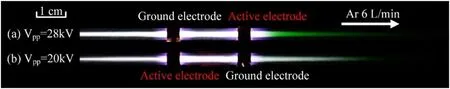
Figure 4.Photographs of the Ar plasma with the active electrode placed at(a)the downstream with applied voltage of 28 kV(peak to peak)and frequency of 9.8 kHz and (b) the upstream with applied voltage of 20 kV (peak to peak) and frequency of 9.8 kHz.
To investigate what kind of excited species emit the green light,the spatial resolved optical emission spectra of the plasma are measured by a half meter spectrometer with grating of 1200 gr mm-1and the entrance and exit slit width of 100 μm.The obtained optical emission spectra from 4 different positions of the Ar plasma with the active electrode placed at the downstream are shown in figures 5 and 6.At position 1,the plasma appears green,and it can be seen from figures 5(b)and 6 that only the emission centered at 557.7 nm is detected in the visible emission range (380-780 nm).The obtained emission is similar as that reported by Motomura et al [17], it is believed that the emission origins from the forbidden transition oxygen line (O(1S-1D), 557.7 nm) and the broaden structure is due to the emission of ArO excimer.It should be emphasized that there is no observed emission from the O(1D)to the ground state O(3P)at 630 nm which is commonly recognized in the aurora spectra.The lifetime of O(1D) is about 150 s, and it may be collisional quenched or re-excited in the discharge [11].As the tube is not vacuum sealed, there are still O2, H2O or some other oxygenates remaining in the tube or on the tube wall, which may be the source of the oxygen.At the other three positions,the plasma appears mainly white.According to their emission spectra as shown in figures 5(b) and 6(b)-(d), it can be seen that the white emission is owing to the continuum emission (about 380-650 nm) from the interaction of free electrons with ions and natural atoms.The corresponding main process is the photo-recombination:+hν.As reported by Treshchalov et al [21], the intensity of the continuum emission is proportional to the square of the electron density.It can be found from figures 5 and 6 that the continuum emission intensity is highest at the position 4 and at the position 3 between the two electrodes the continuum emission intensity is about half of that at position 4.The continuum emission intensity at position 2 next to the active electrode at the downstream is even weaker while its emission intensity at 557.5 nm is the highest.

Figure 5.(a)Photograph of the plasma and(b)emission spectra between 500 nm and 680 nm for different positions with the active electrode placed at the downstream.Gas flow rate: 2 l min-1; applied voltage: 28 kV (peak to peak); frequency: 9.8 kHz.

Figure 6.Emission spectra range between 200 nm and 500 nm of different positions with the active electrode placed at the downstream.(a)-(d) correspond to positions 1-4 in figure 5(a).
The emission spectrum at different positions when the ground electrode is placed at the downstream of the gas flow is shown in figure 7.In the UV range,the N2second positive system emission intensity is the weakest at position 1 next to the ground electrode and highest at position 3 next to the active electrode.It seems that the N2second positive system emission intensity is always the highest on the left of the left side electrode regardless the left side electrode is active electrode or ground electrode as shown in figures 7(b)and 6.On the other hand, it can hardly be detected of emission between 380 nm and 650 nm at position 3 next to the active electrode.At position 1 next to the ground electrode at the downstream of the gas flow, weak emission from the green oxygen line (557.7 nm) can be detected.Besides, the emissions intensity from excited Ar (420-450 nm, 650-900 nm not shown here) are the highest at position 2.
To acquire the fine profile of the green oxygen emission,the spectrometer coupled with an ICCD camera (Andor DH340) is used.The grating is 1200 gr mm-1and the entrance slit width is turned to 30 μm.The instrumental broadening width is about 0.06 nm.The exposure time of the camera is 100 μs.As shown in figure 8, the emission spectrum between 547 nm and 565 nm is acquired at position 2 of figure 5.
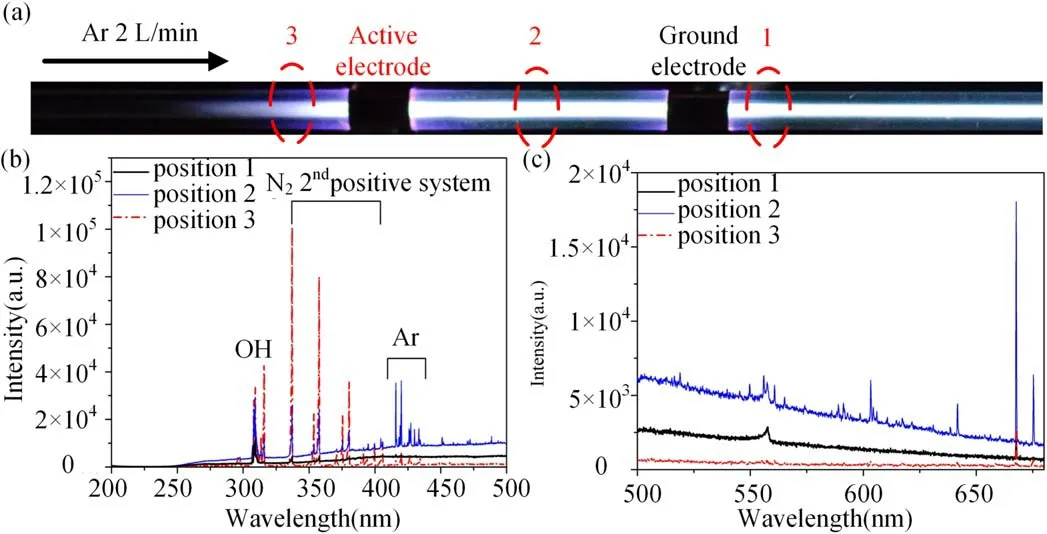
Figure 7.(a)Photographs of the plasma,(b)emission spectra between 200 nm and 500 nm,and(c)emission spectra between 500 nm and 680 nm of different positions with the active electrode placed at the upstream.Gas flow rate: 2 l min-1;applied voltage: 28 kV(peak to peak);frequency: 9.8 kHz.
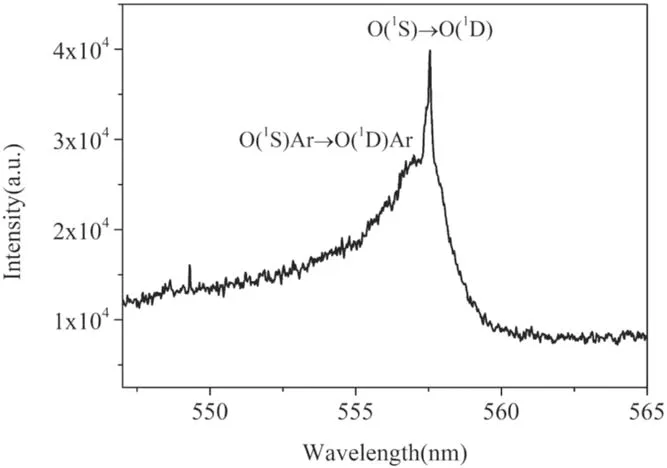
Figure 8.Fine resolution emission spectrum of the plasma at position 2 in figure 5(a) between 547 nm and 565 nm.
According to figure 2,the emission intensity of the green oxygen line is related to the gas flow rate.To better understand the mechanism of the green oxygen emission,the effect of the gas component on the green oxygen emission is investigated.As shown in figure 9, traces amount of N2and O2is added to the Ar, respectively.The total gas flow rate is kept at 6 l min-1.When 0.02% of N2is added, there is no obvious change of the green emission.The length of the‘green’ plasma decreases sharply when the percentage of N2is increased to 0.04%.When the N2percentage is further increased to 0.06% or more, the green emission disappears and a short white plasma plume appears.For the effect of O2,when the percentage of O2is added up to 0.05%, there is no obvious change of the plasma with green emission.However,when it is increased to 0.06%, the length of the plasma with green emission drops dramatically.The green aurora emission disappears and the discharge becomes unstable when the percentage of O2is further increased to more than 0.07%.
To further understand the mechanism of the appearance of the green emission, it will be helpful to acquire the dynamic behavior of discharge process.However, as mentioned previously, the discharge has poor repeatability with this device.Therefore, in the next part, an Ar plasma jet device is used to obtain the dynamic photographs of the plasma as shown in figure 1(b).For this device, the green plasma is generated in the surrounding air.Besides,it is found that the green emission disappears when the Ar plasma is driven by 1 kHz AC power supply(not shown here).Because the frequency of the AC power supply is more or less fixed,to invest the effect of the frequency on the green emission of the plasma, a pulsed power supply with the repetition frequency ranging from 1 to 10 kHz is used.As shown in figure 10(a),the ring electrode around the nozzle is connected to the power supply and the column electrode inside the discharge tube is grounded.Figure 10(b) shows the voltage waveforms for the pulse frequency of 3 kHz and 10 kHz while figure 10(c)shows the enlarged current and voltage waveforms for one pulse.As seen from figure 10(a),for the pulse frequency of 3 kHz, the plasma jet is composed of two parts, i.e.the inner green emission plume and the outer purple ring-shape emission part.The outer purple ring-shape part may be due to the turbulent flow of the Ar gas [22].The inner green emission plume appears diffused.With the increase of the pulse frequency,the green emission intensity became higher while the outer purple emission part gradually disappears.Figure 10(c)shows the voltage and current waveforms for the pulse frequency of 3 kHz and 10 kHz.The current is the conducting current which is the result of the total current subtracting the displacement current (current without gas flow).There is no obvious difference according to the discharge current waveforms.

Figure 9.Photographs of the Ar plasma with traces amount of(a)nitrogen,and(b)oxygen added to the working gas Ar.The active electrode is placed at the downstream of the gas flow.Total gas flow rate: 6 l min-1; applied voltage: 28 kV (peak to peak); frequency: 9.8 kHz.

Figure 10.(a)Photographs of the Ar plasma jet with the pulse frequency ranging from 1 to 10 kHz;(b)voltage and current waveforms of the Ar plasma jet with pulse frequency of 3 kHz and 10 kHz.Gas flow rate: 3 l min-1.

Figure 11.High speed photographs of the main discharge of the Ar plasma with pulse frequency of(a)3 kHz,and(b)10 kHz.Exposure time:5 ns.Gas flow rate:3 l min-1.Each photograph is accumulated 30 times.
The high speed photographs of the discharge for the pulse frequency of 3 kHz and 10 kHz are shown in figure 11.This corresponds to the main discharge period according to figure 10(c).However, at 10 kHz, no plasma plume injects into the open air during the main discharge process.Besides,at 3 kHz,the discharge originates from the HV ring electrode at about 95 ns, on the contrary, at 10 kHz, the discharge originates from the ground column electrode at about 80 ns.To focus on the green aurora emission, a band-pass filter center at 550 nm(bandwidth:10 nm)is placed in front of the ICCD camera.The high speed photographs of the discharges captured with the band-pass filter is shown in figure 12.At 3 kHz,the emission of the plasma plume in the open air in this range is produced during 330 ns and earlier(not shown here),which might origin from the Ar continuum emission.On the other hand, for the pulse frequency of 10 kHz, as shown in figure 12(b), in the open air, there is no emission before 630 ns.Only after 750 ns, the green emission appears and propagates slowly (shown in the dotted line ellipse) and its propagation speed is 3.7 × 10³m s-1.According to the gas flow rate of 3 l min-1and the inner diameter of the nozzle of 1 mm,the gas flow speed is about 63.7 m s-1,which is slower than the propagation speed of the green emission.
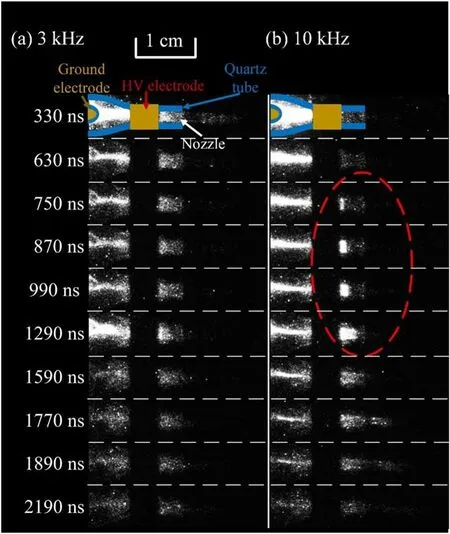
Figure 12.High speed photographs of the emission process after the main discharge process Ar plasma jet with pulse frequency of (a) 3 kHz, and (b) 10 kHz.A band-pass filter center at 550 nm(bandwidth:10 nm)is placed in front of the ICCD camera Exposure time: 30 ns.Gas flow rate: 3 l min-1.Each photograph is accumulated 3000 times.

Figure 13.The related energy levels diagram of the oxygen atom.
4.Discussion
To better understand the mechanism of the appearance of the green emission, the excited and radiative transition progress of the green emission is discussed in the section.The related energy levels of the oxygen atom are shown in figure 13[11].
The upper state O(1S) of the 557.7 nm emission has an excitation energy of 4.17 eV, it can be produced in the Ar mixture discharge by the following reactions [23]:

For the emission progress, the Einstein coefficient of the 557.7 nm (O(1S) → O(1D)) emission is 1.26 s-1.Therefore,at high pressure, the collisional quenching will predominate over radiation,which makes it difficult for the observation of the green emission.It was reported that the addition of noble buffer gas could reduce the collisional quenching of the O(1S)atoms.Hampson and Okabe[8]obtained relative efficiency of the induced radiative decay of O(1S) by Xe, Kr, Ar, N2, H2and He of 23.5:1.7:1.0:0.6:0.23:0.03.The weakly coupled radiating molecular species formed by the O(1S)with foreign species such as Ar, Kr, Xe have much larger transition probabilities than the atomic transition owing to the collision induced emission [9].LeBlanc et al [11] proposed that the transition O(1S)→O(1D) is forbidden by the selection rule,ΔJ = 0, ±1, and it becomes allowed when coupled with foreign atoms by the selection rule ΔΩ = 0, ±1.With Ne and He, no molecular species can be formed.In conclusion,the green emission at or near 557.7 nm can often be observed in the laboratory with Ar or N2discharge but hardly with He.
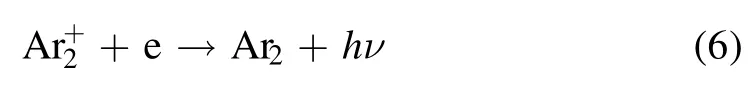
As shown in figures 6 and 7, intense Ar UV-vis continuum emission is observed between the two electrodes and next to the ground electrode regardless of the gas flow direction.The strong green emission can always be observed at the position without the continuum emission.As reported by Treshchalov et al [21], the continuum emission is due to the interaction of free electrons with ions or neutral atoms,including the process of photo-recombination, slowing down of electrons on ions and atoms.In high pressure Ar plasma,the main positive charge species areions.Therefore, the continuum emission is produced by the following process:
In their experiments, the most intense continuum emission is observed near the cathode sheath where it is characterized by a high electron density, and it is found that the emission intensity is proportional to the square of the electron density.As shown in figures 6 and 7, comparing the continuum emission intensities at different positions, it is speculated that, the electrons concentrate between the two electrodes and beyond the ground electrode.Therefore, there is low density of electrons beyond the active electrode, and the green emission is the strongest next to the active electrode as shown in figure 5.Therefore, low density of electrons might be the precondition of the appearance of the green emission.
As for the effect of the additional O2or N2on the green aurora emission.It was reported by Filseth et al [10], the upper state O(1S) could be deactivated by the oxygen molecules rapidly with a deactivation rate coefficient of 3.6×10⁻¹³cm3molecule-1s-1.With very limited addition of O2, the O2molecules are decomposed into O atoms.Further the trace amount of O2to about 0.06%, as shown in figure 9(b), more O2molecules exist in the plasma and deactivate the upper state O(1S),which results in the decrease of the green emission.The deactivation rate coefficient of O(1S) by N2is less than 2×10-16cm3molecule-1s-1.Therefore,the addition of N2is supposed to have no effect on the green emission.However, as shown in figure 9(a), with the addition of 0.04% or more N2, the green emission decreases sharply and disappears with the addition of 0.06%N2.This can be explained by the effect of N2on the Ar discharge process.As the Ar metastable atoms have an energy closed to the excitation energy of the N2second positive system, a resonant reaction easily occurs between the argon metastable atoms and molecular nitrogen.The Ar metastable atoms are highly quenched by the addition of N2,which may cause the decrease of O atoms and eventually lead to the decrease of the green emission.More researches are needed for the better understanding of the effect of the addition gas on the green emission.
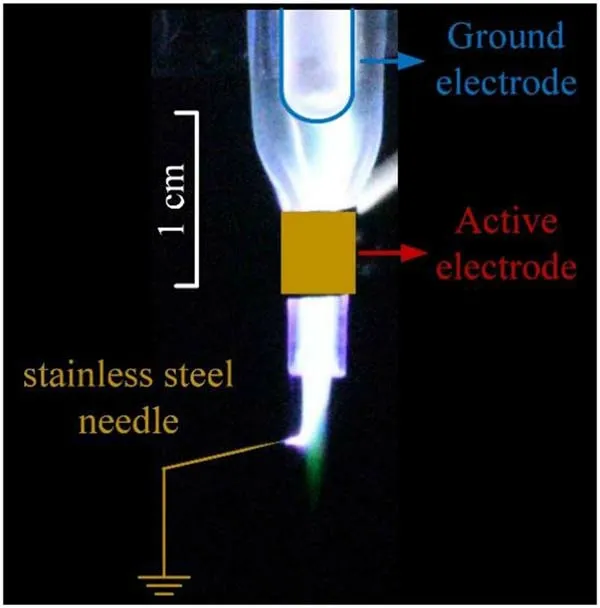
Figure 14.Photograph of the Ar plasma jet touched with a ground stainless steel needle.Gas flow rate: 3 l min-1.Applied voltage; 8 kV; pulse frequency: 10 kHz.
As shown in figure 12(b),the green emission beyond the active electrode appeared at 750 ns while the applied voltage decreases to low level and the discharge current is almost zero.Thus, the green emission might be gas flow driven,which is different from the normal electrically driven noble gas plasma jet [24].To verify this speculation, a grounded stainless steel needle is placed near the plasma jet as shown in figure 14.It can be seen that the green emission is not affected by the grounded stainless steel needle.Therefore, it is suspected that the green emission is not electrically driven.However, as the propagation speed of the green emission as shown in figure 12 is much higher than the gas flow speed,thus it is unlikely to be driven by the gas flow alone.More works are needed to better understand the mechanism of the green emission.
5.Conclusion
In this work, the mechanism of the production of the ‘green’Ar plasma is investigated.By using a long glass tube connected with a 3.5 m flexible tube to minimize the diffusion of the surrounding air into the quartz tube, it is found that the green plasma is not related to the diffusion of the surrounding air.The green plasma could appear on the downstream of the active electrode side when the active electrode is placed at the downstream of the gas flow.
According to the optical emission spectra,it is found that the green aurora emission mainly appears at the region where Ar UV-vis continuum emission is weak.It is assumed that the appearance of the green aurora emission is related to the gas flow and electrons distribution of the plasma.Further studies show that the green emission disappears when about 0.05%-0.07% of O2or N2is added to the working gas.However,there mechanisms are different.When O2is added, the O2molecules deactivate the upper state O(1S), which results in the decrease of the green emission.On the other hand, when N2is added,Ar metastable atoms are quenched by N2,which results in the decrease of O atoms and eventually leads to the decrease of the green emission.
We discussed the possible production mechanism of the aurora emission in the Ar atmospheric pressure plasma and gave some explanations for the phenomena in the experiments.However, there are some other open questions on the green emission that need further investigation.For example,why is the aurora emission propagation speed higher than the gas flow speed? Why is there no green aurora emission around the active electrode when the active electrode is placed on the upstream? More experiments and simulations are needed in the future investigation for the further explanation of these phenomena.
It is believed that all the results presented in the paper are helpful for the understanding of the appearance of the green aurora emission and its application in space physics, laser physics and other application areas.
Acknowledgments
This work was supported by the National Key Research and Development Program of China(No.2021YFE0114700)and National Natural Science Foundation of China (Nos.52130701 and 51977096).
猜你喜欢
农业工程学报(2022年14期)2022-10-19
心理与健康(2020年11期)2020-11-19
故事会(2019年23期)2019-12-05
戏剧之家(2019年4期)2019-03-28
作文大王·低年级(2018年6期)2018-07-05
动漫界·幼教365(中班)(2018年1期)2018-05-14
婚姻与家庭·性情读本(2016年4期)2016-04-19
小天使·二年级语数英综合(2015年12期)2015-12-04
故事作文·低年级(2009年9期)2009-12-10
故事作文·低年级(2009年8期)2009-11-25
 Plasma Science and Technology2022年5期
- Plasma Science and Technology的其它文章
- Synthesis of Ag-decorated vertical graphene nanosheets and their electrocatalytic efficiencies
- Upgrade of an integrated Langmuir probe system on the closed divertor target plates in the HL-2A tokamak
- Numerical study of atmospheric-pressure argon plasma jet propagating into ambient nitrogen
- Effects of O2 addition on the plasma uniformity and reactivity of Ar DBD excited by ns pulsed and AC power supplies
- Design and first result of combined Langmuir-magnetic probe on J-TEXT tokamak
- Selective catalytic reduction of NOx with NH3 assisted by non-thermal plasma over CeMnZrOx@TiO2 core-shell catalyst