
Experimental Investigation on the Interactions Between Dam-Break Flow and a Floating Box
2022-06-14 04:02WANGDongxuandDONGSheng
WANG Dongxu, and DONG Sheng
Experimental Investigation on the Interactions Between Dam-Break Flow and a Floating Box
WANG Dongxu, and DONG Sheng*
College of Engineering, Ocean University of China, Qingdao266100, China
An experiment that investigates the interactions between dam-break flow and a floating box is reported in this paper. The interaction processes are described in detail, and the effects of reservoir depth, clearance between the structure and vertical wall, and structure motion on the observed interactions are discussed. Results indicate that interactions are mild if the reservoir depth is relatively small and most of the water flows through under the structure. However, as the reservoir depth increases, the interactions intensify, and overtopping and wave splashing occur. The incident wave is divided into two parts by the structure: 1) a jet generated by wave impact and 2) the water flowing through under the structure. The water flowing through under the structure is the main factor influencing the motion of the structure. The phenomenon of secondary slamming is observed in all of the test cases, and the relative motion of the structure and free surface explains the occurrence of secondary slamming.
dam break; floating box; wave splashing; secondary slamming
1 Introduction
Dam break, a harmful disaster that could cause massive losses to life and property, refers to the collapse of a dam, which causes the water in the reservoir to flow out abruptly and chaotically. The resulting turbulent flow generates extensive damage to downstream structures and vegetation.
Studies on dam-break problems have been conducted for many years. The foci of these studies include the evolution of dam-break flow (Jánosi, 2004) and the impactof dam-break flow on downstream structures (Bukreev andZykov, 2008). The approaches used in these studies mainly include field observation (Gerritsen, 2005), theoretical anal- ysis (Yilmaz, 2013), experiments (Lauberand Hager, 1998), and numerical modeling (Kao and Chang, 2012).
Dam-break flows can be classified into two categories depending on whether the downstream bed is initially dry or wet; the flow motions of these two categories are known to be different. Stansby(1998) investigated the initial stages of dam-break flow experimentally and found that a horizontal jet can be observed if the downstream bed is dry; otherwise, a vertical mushroom-like jet is observed. The interaction between the jet and the dry bed or downstream water layer was observed to be fairly complex, and undulating bores could be generated during the interaction process.
The bore generated by dam-break flow is frequently con-sidered in experimental studies because this phenomenon is a type of surface flow characterized by strong nonlinearity. In the field of coastal engineering, for example, O’Donoghue(2010) proposed a comprehensive study of the swash on impermeable slopes; in this work, the bore generated by dam-break flow was adopted. Lu(2018) investigated the run-up of breaking bores on an impermeable slope and compared the dry-bed and wet-bed cases. Mokhtar(2019) conducted an experiment to study the impact pressure of tsunami-induced bores on a perforated seawall; in this study, the tsunami-induced bore was generated by dam-break flow. The distribution of impact pressures on a vertical wall was summarized, and an equation to evaluate the maximum impact pressure was proposed.
According to Buchner (2002), the interaction between dam-break flow and a horizontal deck is analogous to that of green water events. Therefore, undulating bores are wide- ly used for green water prediction in ocean engineering (Ryu, 2007; Hu, 2015). Compared with using regular waves (Greco, 2005), using the bore generated by dam-break flow improves the utilization of high-resolution facilities, lowers the cost of the experiment, and shortens its duration (Hernández-Fontes, 2019).
To the best of our knowledge, the downstream structure considered in dam-break experiments is mostly fixed (Gre- co, 2007; Hernández-Fontes, 2018; Ozmen-Ca- gatay and Kocaman, 2011). Therefore, in the present study, we conduct an experiment to investigate the interactions between dam-break flow and a floating box. The floating box is employed to simulate common floating structures, such as heaving buoys and barges. The aims of this experiment are: i) to investigate the fluid–structure interaction (FSI) process between a rigid floating structure and dam-break flow, ii) to study the impact pressure of bores on a floating structure, and iii) to provide experimental data for validating numerical models.
The rest of this paper is organized as follows. Section 2 describes the experimental setup, Section 3 analyzes the relevant FSI processes, and Section 4 provides an extensive discussion of the experimental results. Finally, Section 5 provides the conclusions.
2 Experimental Setup
2.1 Configuration
The experiment is conducted at the laboratory of Ocean University of China and features a two-dimensional design.The translational and rotational motions of the structure are considered. The experimental configuration is presented in Fig.1.
The experiment is performed in a glass-wall water tank measuring 2.0m in length, 0.8m in height, and 0.6m in width. A gate is installed 0.5m away from the right wall of the water tank to separate the water tank into two sections: one section is used as a reservoir, and the other section contains the initial water layer. LetHandHdenote the water depth of the reservoir and initial water layer, respectively. In the experiment,His set to 0.15m, and three values ofHare considered: 0.25, 0.3, and 0.35m. A parameterthat denotes the ratio ofHtoHis introduced. The values offorHvalues of 0.25, 0.3, and 0.35m are 0.6, 0.5, and 0.429, respectively.

Fig.1 Experimental configuration. WG, wave gauge.
2.2 Gate Opening System
In the experiment, the gate is lifted via a gate-opening system that is analogous to the system used by Lobovský(2014). The opening system comprises a gate slide, an aluminum frame, two pulleys, a strong rope, and a weight. Rubber materials are utilized inside the gate slide to prevent water leakage from the reservoir. The gate is lifted by the rope when the weight (29kg) is released. The water inside the reservoir flows out abruptly when the gate is lifted to simulate dam-break flow. According to Lauber and Hager (1998), the non-dimensional opening time can be defined as:

whereis the actual opening time, andis the gravity acceleration. Sufficiently sudden removal is realized when<1.414. In the present experiment, the values offorHvalues of 0.25, 0.3, and 0.35m are 0.18, 0.22, and 0.24s, respectively. The calculatedvalues are 0.89, 1.02, and 1.06, all of which are less than 1.414.
2.3 Data Acquisition
0denotes the distance between the center of the floating box and the left wall of the water tank. Two0values are considered in the experiment: 0.3 and 0.75m. If0=0.3m, the floating box is left located and separated from the left wall by a small clearance. According to Zhang(2020), the motion of water between a floating structure and the left wall is mostly of the quasi-piston type, and the horizontal force acting on the structure is significantly larger than that observed in the case without the vertical wall. If0=0.75m, the floating box is centrally located. In this case, the effect of the vertical wall is not significant, and the run-up process occurs after most of the water has passed through the structure.
The length, width, and height of the floating box are 0.3, 0.595, and 0.1m, respectively. Because the experiment is two-dimensional, the width of the floating box is similar to the width of the water tank. A gap (0.25cm) is designed between the floating box and sidewall of the water tank to avoid their collision. The mass and moment of inertia of the floating box are 5.35kg and 0.045kgm2, respectively. Fig.2 provides a two-dimensional sketch of the floating box. The draught of the floating box is 0.03m. Two pressure probes (PPs) are placed on the surface of the floating box; the first PP is located at the air-water interface, and the second PP is located on the freeboard, which is 0.03m away from the top of the structure. The sampling frequency of the PP is 1000Hz.
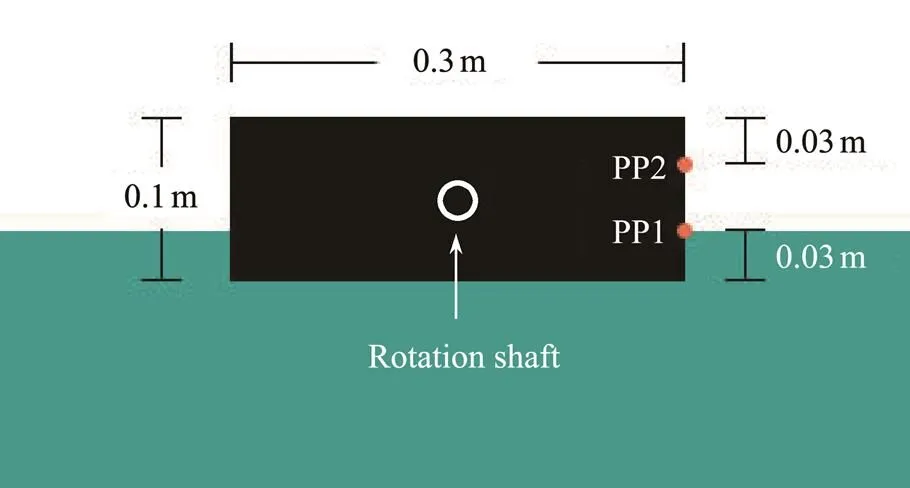
Fig.2 Floating box. PP, pressure probe.
Two wave gauges (WGs) are adopted in the experiment to capture surface elevations. The first WG is placed on the left wall of the water tank to measure the run-up. The second WG is placed 1.3m away from the left wall to measure the initial and reflected wave profiles. The sampling frequency of the WG is 50Hz.
The motion states of the floating structure are measured using an Optotrak Certus capture system (Northern Digital Inc., Waterloo, Canada). Several tracking markers are installed on the floating structure, and the signals transmitted by the markers are captured by the collection device displayed in Fig.1. Because the tracking markers are sufficiently lightweight, they hardly interfere with the movement of the structure. Two degrees of freedom are considered: heave and pitch. The sampling frequency of the Optotrak Certus capture system is 100Hz.
The parameters considered in the experiment are summarized in Table 1. ThreeHvalues, two0values, and two motion states are considered; thus, a total of 12 different experiments are performed. The rotational motion of the structure is not rigidly constrained because the strong and immediate impact induced by dam-break flow may damage the box if the rotational motion is completely constrained. Thus, in cases where the structure is subject to heave only, pitch motion may be observed. However, because the rotational angle is small in these cases, it can be ignored. Each case is repeated thrice, and the final resultis obtained by averaging the results of each set of experiments.

Table 1 Parameters considered in the experiment
3 FSI Process Induced by the Incident Bore
3.1 Structure: Centrally Located and Heave Only
The configuration of the case presented in this subsection is analogous to the case of a pile-restrained floating wave energy converter (Ning, 2016). The FSI process for the case of=0.6 is displayed in Fig.3. The moment of the topmost image in Fig.3 is defined as0, and the moments of the subsequent images are defined on the basis of this image. The right side of the structure is defined as seaward, and the left side of the structure is defined as leeward. At the initial stage of the experiment, the bore generated by dam-break flow propagates from seaward to leeward. In the following analysis, the left wall of the water tank is called the rear wall. Parameter0is defined arbitrarily, which means its value is mutable for different cases. An arbitrary0is used in the experiments for several reasons. First, because the experiments are transient, the sampling process begins before the gate is raised to ensure that all of the data are captured; however, this process renders the task of keeping all0values identical fairly difficult. Second, because0is introduced only to facilitate the analysis, focusing on the time span among different moments, rather than the actual starting point, may be more meaningful for interpreting the results.
At=0, a bore shaped like a solitary wave is observed to propagate toward the structure. At=0+0.18s, the bore strikes the seaward surface of the structure. Because the amplitude of the bore is small, the water hardly overtops the structure. Most of the water passes through under the structure; thus, the leeward water level rises, and the structure moves upward. At=0+0.5s, the water passes through under the structure, and the seaward free surface near the structure falls considerably. The relative motion of the structure and free surface forms a hollow, which causes the draught of the seaward surface of the structure to equal 0. At=0+0.62s, most of the water has passed through under the structure, and the structure begins to move downward because of gravity. The hollow is quickly filled with water, which generates secondary slamming with air bubbles trapped in the water. During secondary slamming, the structure moves downward, but the free surface on the seaward surface of the structure moves upward. At=0+0.8s, the leeward water begins to climb the rear wall. At=0+0.94s, maximum run-up occurs on the rear wall, and a reflected wave is observed on the seaward surface. At=0+1.28s, the leeward water begins to move backward because of rear-wall reflection. The subsequent FSI process may be deduced to be analogous to the FSI process induced by the incident bore. As expected, at=0+1.74s, the same phenomena noted at=0+0.5s are observed.
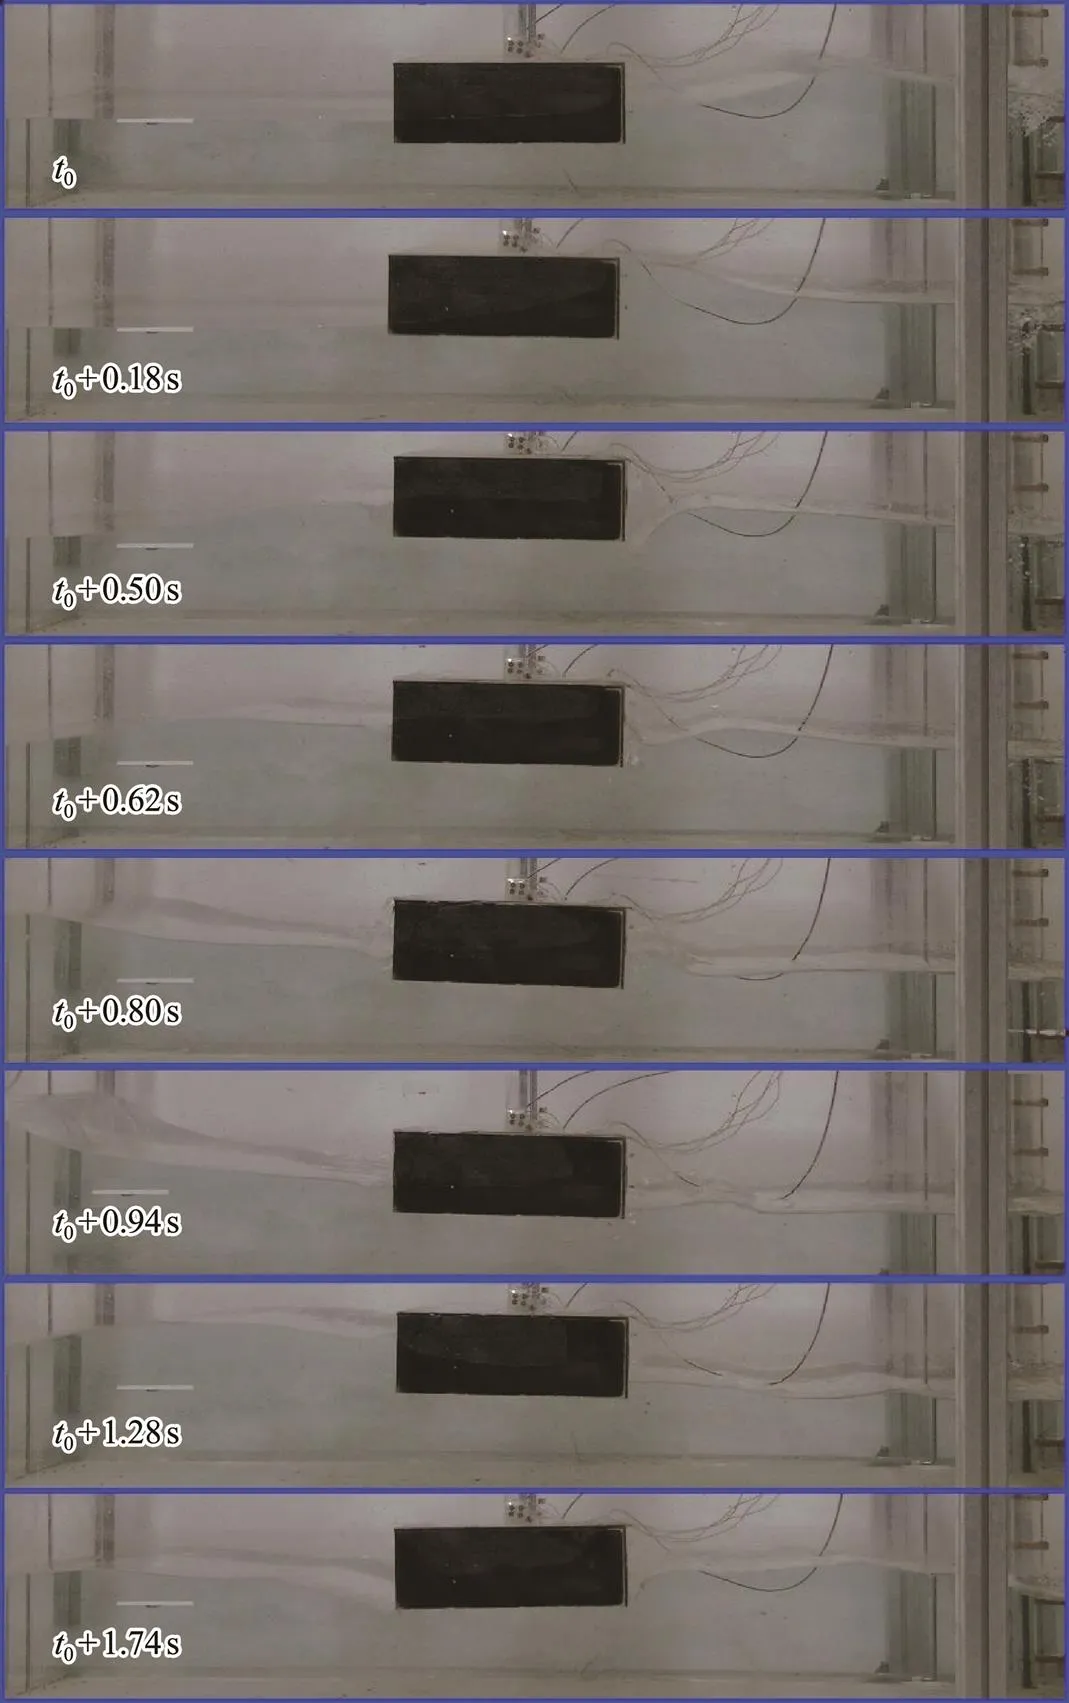
Fig.3 FSI process for the case of γ=0.6. The structure can heave freely and is centrally located.
The FSI process for the case of=0.5 is displayed in Fig.4. Asdecreases, the amplitude of the bore increases. Therefore, obvious overtopping can be observed at=0+0.18s. At=0+0.48s, the bore is divided into two parts by the structure. The first part overtops the structure and then propagates horizontally, while the second part flows under the structure. Hollows are observed in the seaward and leeward sides of the structure, which means secondary slamming will subsequently occur. The mechanism behind the formation of the seaward hollow is identical to that described in Fig.3, and the occurrence of the leeward hollow can be explained as follows: when water flows under the structure, the gravity of the latter acts on the former; when the water passes through the lower-left corner of the structure, this vertical constraint disappears immediately. Thus, the water gains an upward velocity component as soon as it passes through the structure, and the leeward hollow observed in Fig.4 is formed. A similar leeward hollow appears in Fig.3, but this phenomenon is not obvious because the velocity of the water is relatively small. At=0+0.86s, maximum run-up occurs on the rear wall. Compared with the run-up presented in Fig.3, the run-up presented in Fig.4 is higher, and obvious wave splashing can be observed. From=0+1.14s, the reflected wave begins to interact with the structure.

Fig.4 FSI process for the case of γ=0.5. The structure can heave freely and is centrally located.
The FSI process for the case of=0.429 is displayed in Fig.5. The whole process observed in Fig.5 is analogous to the process described in Fig.4 but more intense. At=0+0.8s, maximum run-up with intense wave splashing occurs. In fact, in the experiment, the splashing is so intense that it exceeds the measurement range of WG1, and some water splashes out from the water tank. At=0+1.6s, hollows can be observed in the leeward and seaward sides of the structure, which means secondary slamming will subsequently occur.
The data measured in the experiment are compared in Fig.6; here, the horizontal axis represents the time, while the vertical axes represent the surface elevation, impact pressure, and motion state from top to bottom. The data clearly reveal thatsignificantly affects the results. The initial surface elevations measured by WG2 from the threedam-break flows differ. This finding is reasonable because a smallermeans a larger reservoir water depth, which is critical to dam-break flow. For example, Shigematsu(2004) observed that the turbulence following gate release increases asdecreases. Three apparent peaks in the surface elevations measured by WG1 can be observed, and the amplitudes of these peaks decrease over time. When the run-up signal reaches its peak, the heave motion signal reaches its approximate trough because most of the water is on the leeward side when the maximum run-up occurs, as observed in Figs.3–5. Obvious secondary slamming can be observed in the curves measured by PP1, and the first occurrence of secondary slamming is highlighted in Fig.6. The amplitude of secondary slamming is smaller than the amplitude of the first impact induced by the incident bore. However, at PP2, the measured impact pressure hardly contains secondary slamming, which indicates that secondary slamming has a limited effect on the freeboard surface when the structure cannot rotate.

Fig.5 FSI process for the case of γ=0.429. The structure can heave freely and is centrally located.
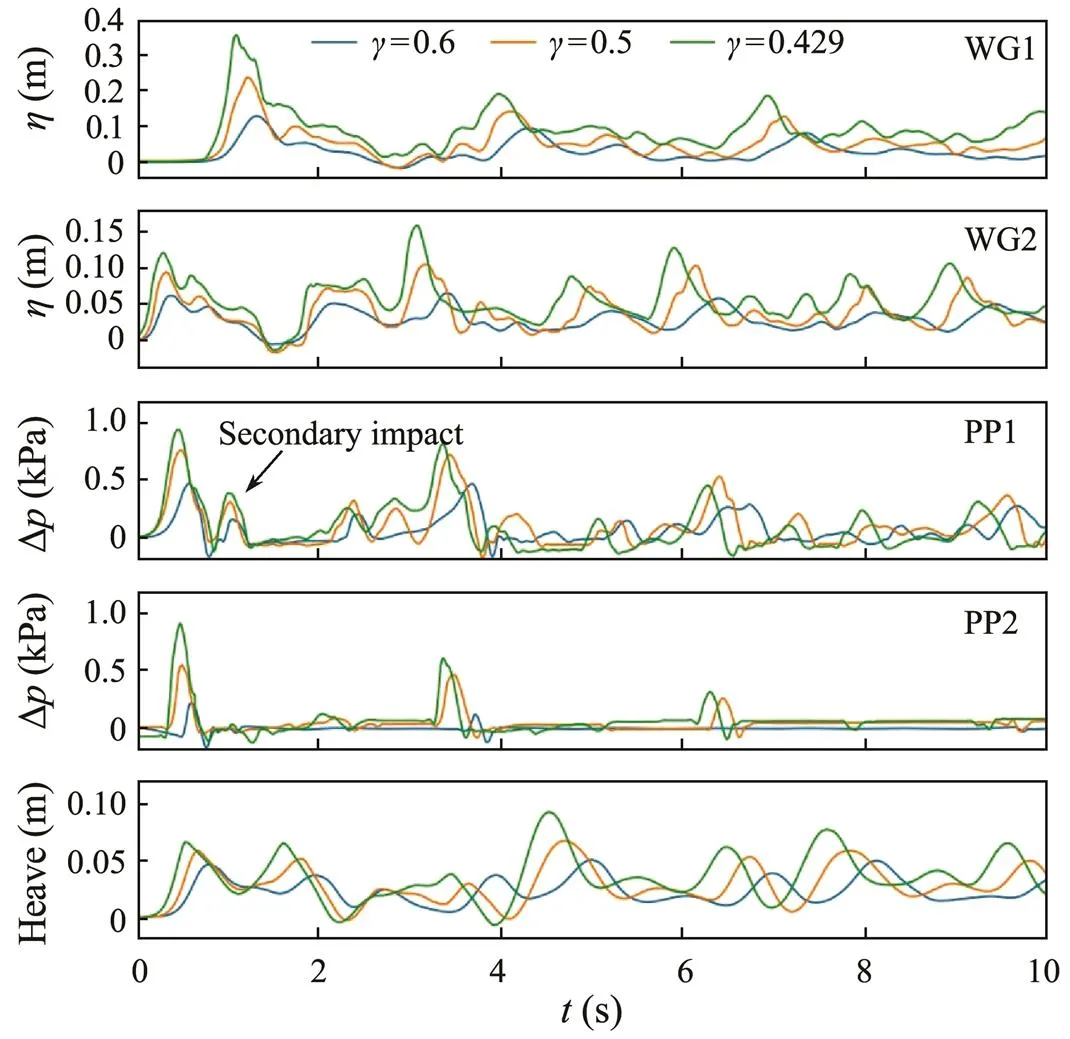
Fig.6 Comparison of the results obtained from cases of different γ. The structure can heave freely and is centrally located.
3.2 Structure: Centrally Located with Simultaneous Heave and Pitch
The FSI process becomes more complicated when the structure can heave and pitch simultaneously. The configuration of the case presented in this subsection is analogous to the case of a barge under the attack of a beam tsunami.
The FSI process for the case of=0.6 is displayed in Fig.7. At the initial moment, a bore propagates toward the structure. At=0+0.34s, the bore strikes the structure, and the structure is driven to turn anticlockwise. At=0+0.46s, water-on-deck occurs, and the overtopping water is concentrated in the upper-right corner of the structure. Most of the water passes through under the structure, and the free surface near the seaward surface of the structure begins to drop. The water passing under the structure induces a push on the lower-left corner of the structure, causing it to turn clockwise. At=0+0.62s, an obvious hollow is observed between the structure and the seaward free surface. When a structure rotates, the resulting rotation may also promote the occurrence of a hollow. During clockwise rotation, the lower-right corner of the structure acts like a paddle that pushes the water beneath the structure toward the leeward direction. Thus, the free surface near the seaward surface of the structure drops below the bottom of the structure. A similar hollow is not observed in the leeward direction because the structure has a clockwise rotational angle, which weakens the flow separation (Jung, 2006) induced by the lower-left corner of the structure. At=0+0.74s, secondary slamming with obvious wave splashing occurs on the seaward surface, and an obvious transmitted wave appears in the leeward surface. At=0+1.04s, maximum run-up occurs on the rear wall, and the leeward water level is significantly higher than the seaward water level. At=0+1.34s, the water propagates backward, and the subsequent FSI process is analogous to the process described for=0+0.34s. In Fig.7, the rotational angle may be concluded to be strongly related to water level. If the leeward water level is higher than the seaward water level, the rotational angle is clockwise; otherwise, the rotational angle is anticlockwise.
The FSI process for the case of=0.5 is displayed in Fig.8. At=0+0.2s, the bore strikes the structure violently, causing the latter to rotate anticlockwise. An obvious jet can be observed above the structure. At=0+0.32s, the jet above the structure continues to propagate. The structure turns clockwise under the effect of the water passing under it. At=0+0.46s, the structure has a clockwise rotational angle. The jet above the structure is divided into two parts: the first part passes through the structure and then strikes its leeward free surface, and the second part flows back along the top surface of the structure and then drops into the hollow formed between the structure and its free surface. At=0+0.58s, a transmission wave appears on the leeward side because most of thewaterhaspassedthroughthestructure.Secondaryslam- ming with wave splashing occurs on the seaward surface. At=0+0.86s, maximum run-up occurs on the rear wall. However, the phenomenon of wave splashing is not observed, which contrasts the phenomenon observed in Fig.4. At=0+1.14s, the water is reflected by the rear wall. The FSI process between the reflected wave and the structure is analogous to the FSI process induced by the incident bore. As expected, water-on-deck occurs at=0+1.42s, and a hollow appears at=0+1.74s.

Fig.7 FSI process for the case of γ=0.6. The structure can heave and pitch freely and is centrally located.
The FSI process for the case of=0.429 is displayed in Fig.9. Compared with the interactions observed in Fig.8, the interactions presented in Fig.9 are more intense. For example, at=0+0.34s, the jet generated by wave splashing is considerably disordered. At=0+0.46s, part of the jet strikes the rising leeward free surface violently, while another part flows back along the top surface of the structure. At=0+0.9s, maximum run-up with intense wave splashing occurs on the rear wall. At=0+1.18s, a hollow is observed between the rear wall and free surface. The formation of this hollow may be explained as follows. Gravity causes the water on the rear wall to drop after the run-up, and most of the leeward water flows backward because of the reflection of the rear wall. As the leeward water moves with a relatively large horizontal velocity, the water volume in the vicinity of the rear wall decreases rapidly. Thus, the free surface on the rear wall descends considerably, and a hollow is formed. The hollow is not observed in the cases of=0.6 and=0.5 because the horizontal velocity of the water is not sufficiently large in these cases. At=0+1.34s, secondary slamming with wave splashing is observed on the rear wall. At=0+1.86s, the leeward free surface becomes extremely disordered: the wave reflected by the rear wall strikes the wave reflected by the structure, and wave breaking can be observed during this wave-wave interaction.

Fig.8 FSI process for the case of γ=0.5. The structure can heave and pitch freely and is centrally located.

Fig.9 FSI process for the case of γ=0.429. The structure can heave and pitch freely and is centrally located.
The data measured in the previous experiments are compared in Fig.10. The impact pressure signal measured by PP2 in the case of=0.5 is different from the other two signals measured previously; specifically, the zero position rises considerably when=0.5. The reason behind this phenomenon is unknown, but we believe it may be due to some limitations of the experimental facility. Furthermore, the signals measured by PP2 include secondary slamming, which differs from the observation in Subsection 3.1. This phenomenon can be explained as follows. When secondary slamming occurs, the structure has a clockwise rotational angle. In other words, compared with the case in which the structure heaves only, the freeboard in the present case is closer to the free surface, as seen in Fig.7 at=0+0.62s. Therefore, the effect of secondary slamming on the freeboard cannot be ignored when the structure can rotate.

Fig.10 Comparison of the results obtained from cases of different γ. The structure can heave and pitch freely and is centrally located.
3.3 Structure: Left Located with Heave Only
The configuration of the case presented in this subsection is analogous to the case in which a heaving buoy is placed in front of a coastal wall (Zhang, 2020).
The FSI process for the case of=0.6 is displayed in Fig.11. At the initial moment, a bore is observed to propagate toward the structure. At=0+0.2s, the bore strikes the seaward surface of the structure. The water hardly over- tops the structure, and most of the water passes through under the structure. At=0+0.46s, the structure moves upward, and the seaward water level descends while the leeward water level rises. Thus, a hollow appears between the structure and seaward free surface. At=0+0.64s, secondary slamming occurs, and air bubbles are incorporated into the water near the structure. The water level rises considerably on the leeward side, and the water demonstrates quasi-piston-type motion, which is slightly analogous to the water motion observed in narrow-gap problems (Tan, 2019). The free surface in the leeward side is nearly flat, in contrast to the phenomenon observed in the case of0=0.75m. At=0+0.92s, most of the reflected wave passes through under the structure, and the floating box is lifted. The draught of the floating structure equals approximately 0, and the floating structure falls because of gravity. At=0+1.2s, the structure falls into the water, and small hollows are observed between the structure and free surface.

Fig.11 FSI process for the case of γ=0.6. The structure can heave freely and is left located.
The FSI process for the case of=0.5 is displayed in Fig.12. In contrast to the case of=0.6, overtopping can be observed at=0+0.2s. At=0+0.52s, the small clearance between the rear wall and structure causes run-up to occur immediately. In addition, the jet generated by wave impact strikes the rear wall and leeward free surface directly. The water flowing under the structure causes the latter to move upward, and hollows are observed in both the seaward and leeward sides. The reason behind the occurrence of these two hollows is elaborated in Subsection 3.1. At=0+0.66s, secondary slamming occurs in the leeward and seaward surfaces. The leeward water level increases and exceeds the top of the structure. The leeward free surface is highly chaotic because of collisions between the jet, rear wall, and leeward free surface. At=0+0.84s, the water moves toward the seaward side due to rear-wall reflection, and the leeward free surface descends. The structure is lifted a second time before it de- scends, and the water remaining on the structure splashes outward. At=0+1.0s, the structure reaches its highest position, at which point its draught is approximately equal to 0. The leeward free surface on the leeward remains highly disordered. Subsequently, the structure drops because of gravity, and hollows are observed, as seen in Fig.12 at=0+1.18s.
The FSI process for the case of=0.429 is displayed in Fig.13. As expected, the interaction process is analogous to the process observed in Fig.12, but the interaction of the jet and leeward water is more intense in the present case. Water-on-deck occurs at=0+0.34s. Compared with the overtopping observed in the case of=0.5, the present overtopping carries a larger water volume because of the increase in bore amplitude. At=0+0.78s, the leeward water level rises and exceeds the top of the structure considerably. The jet generated by overtopping strikes the leeward water, which results in intense wave splashing. Subsequently, the reflected water propagates backward, and the floating box moves upward.

Fig.12 FSI process for the case of γ=0.5. The structure can heave freely and is left located.
The data measured in the experiments are compared in Fig.14. As expected, the run-up increases asdecreases. The maximum run-up measured in the case of=0.429 is nearly thrice that measured in the case of=0.6. At PP1, the pressure amplitude of secondary slamming is smaller than that observed in Subsection 3.1 because the motion states of the structure are different in these two cases. This observation is discussed further in Subsection 4.1.
3.4 Structure: Left Located with Simultaneous Heave and Pitch
The FSI process differs from that described for previous causes when the structure can rotate. The configuration of the case presented in this subsection is analogous to the sea-keeping case studied by Kristiansen and Faltinsen (2010).
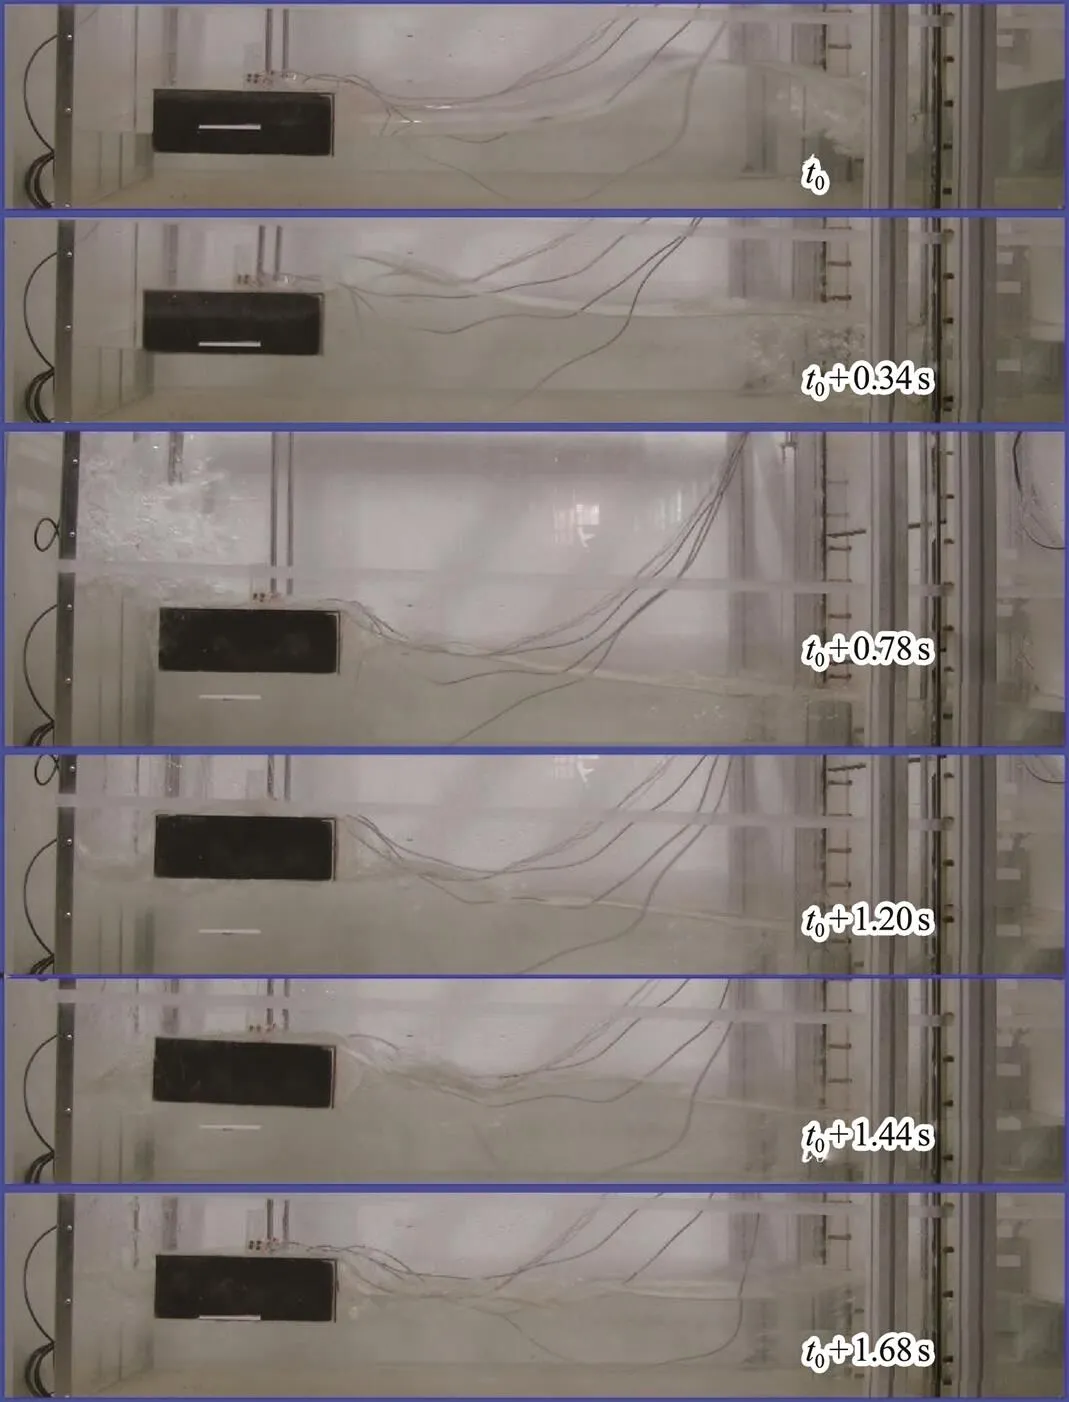
Fig.13 FSI process for the case of γ=0.429. The structure can heave freely and is left located.
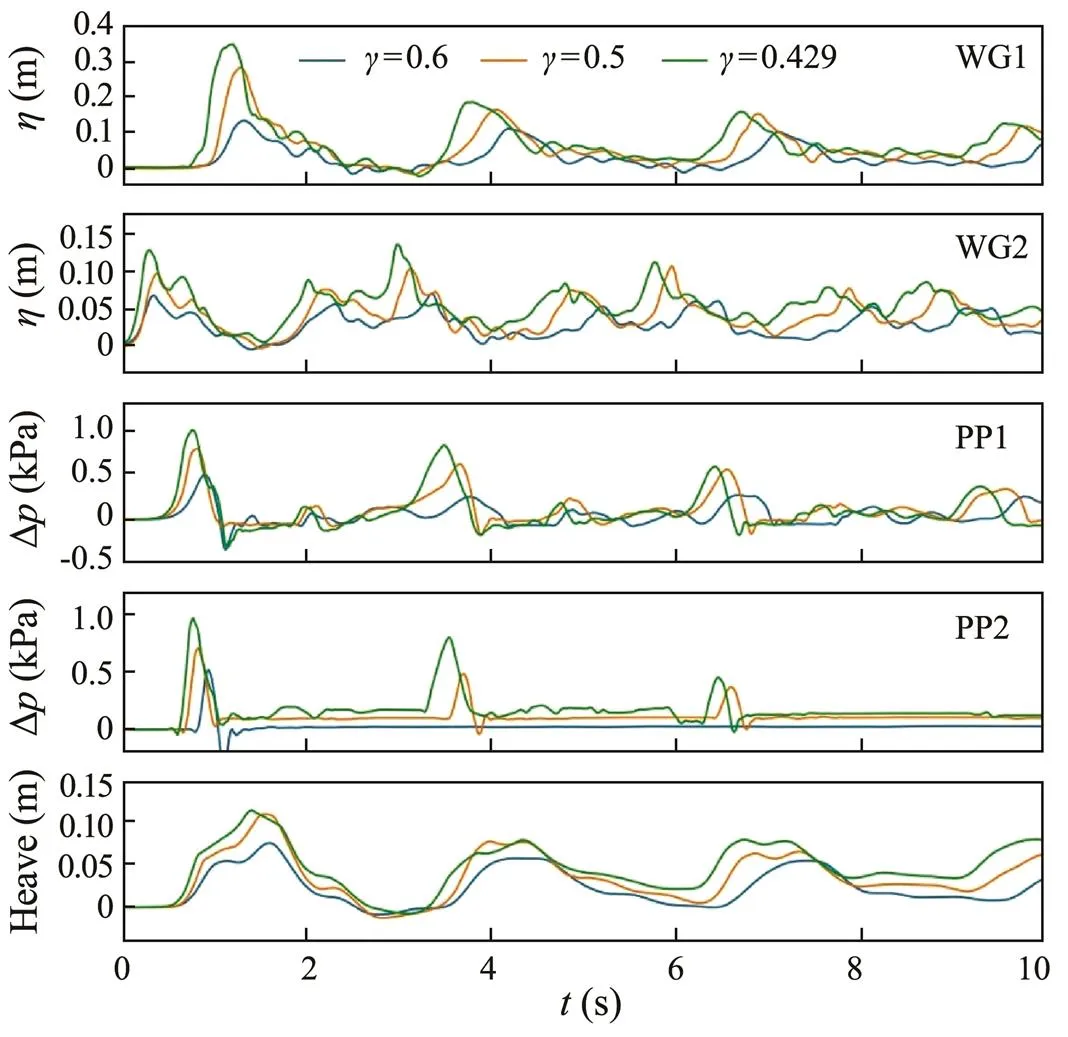
Fig.14 Comparison of the results obtained from cases of different γ. The structure can heave freely and is left located.

Fig.15 FSI process for the case of γ=0.6. The structure can heave and pitch freely and is left located.
The FSI process for the case of=0.5 is displayed in Fig.16. At=0+0.3s, the incident bore strikes the structure. A jet is formed, and the structure is forced to turn anticlockwise. However, because the water flows through under the structure, the structure turns clockwise immediately, as seen at=0+0.4s. At=0+0.56s, the maximum rotational angle of the structure is reached. The water level rises significantly in the leeward side, and the jet strikes the leeward free surface. On the seaward side, the overtopping water flows back along the top surface of the structure and falls into the hollow formed between the structure and free surface. At=0+0.72s, maximum run-up occurs on the rear wall. The free surface on the leeward side is sloped, and wave splashing is observed. At=0+0.96s, the water moves backward because of the reflection of the rear wall, and the structure is lifted. At=0+1.14s, most of the water has passed through the structure, and the rotational angle of the structure is anticlockwise. During the run-up process, the rotational angle of the structure hardly changes from=0+0.56s to=0+0.72s. However, from=0+0.72s to=0+1.34s, the rotational angle of the structure changes rapidly.
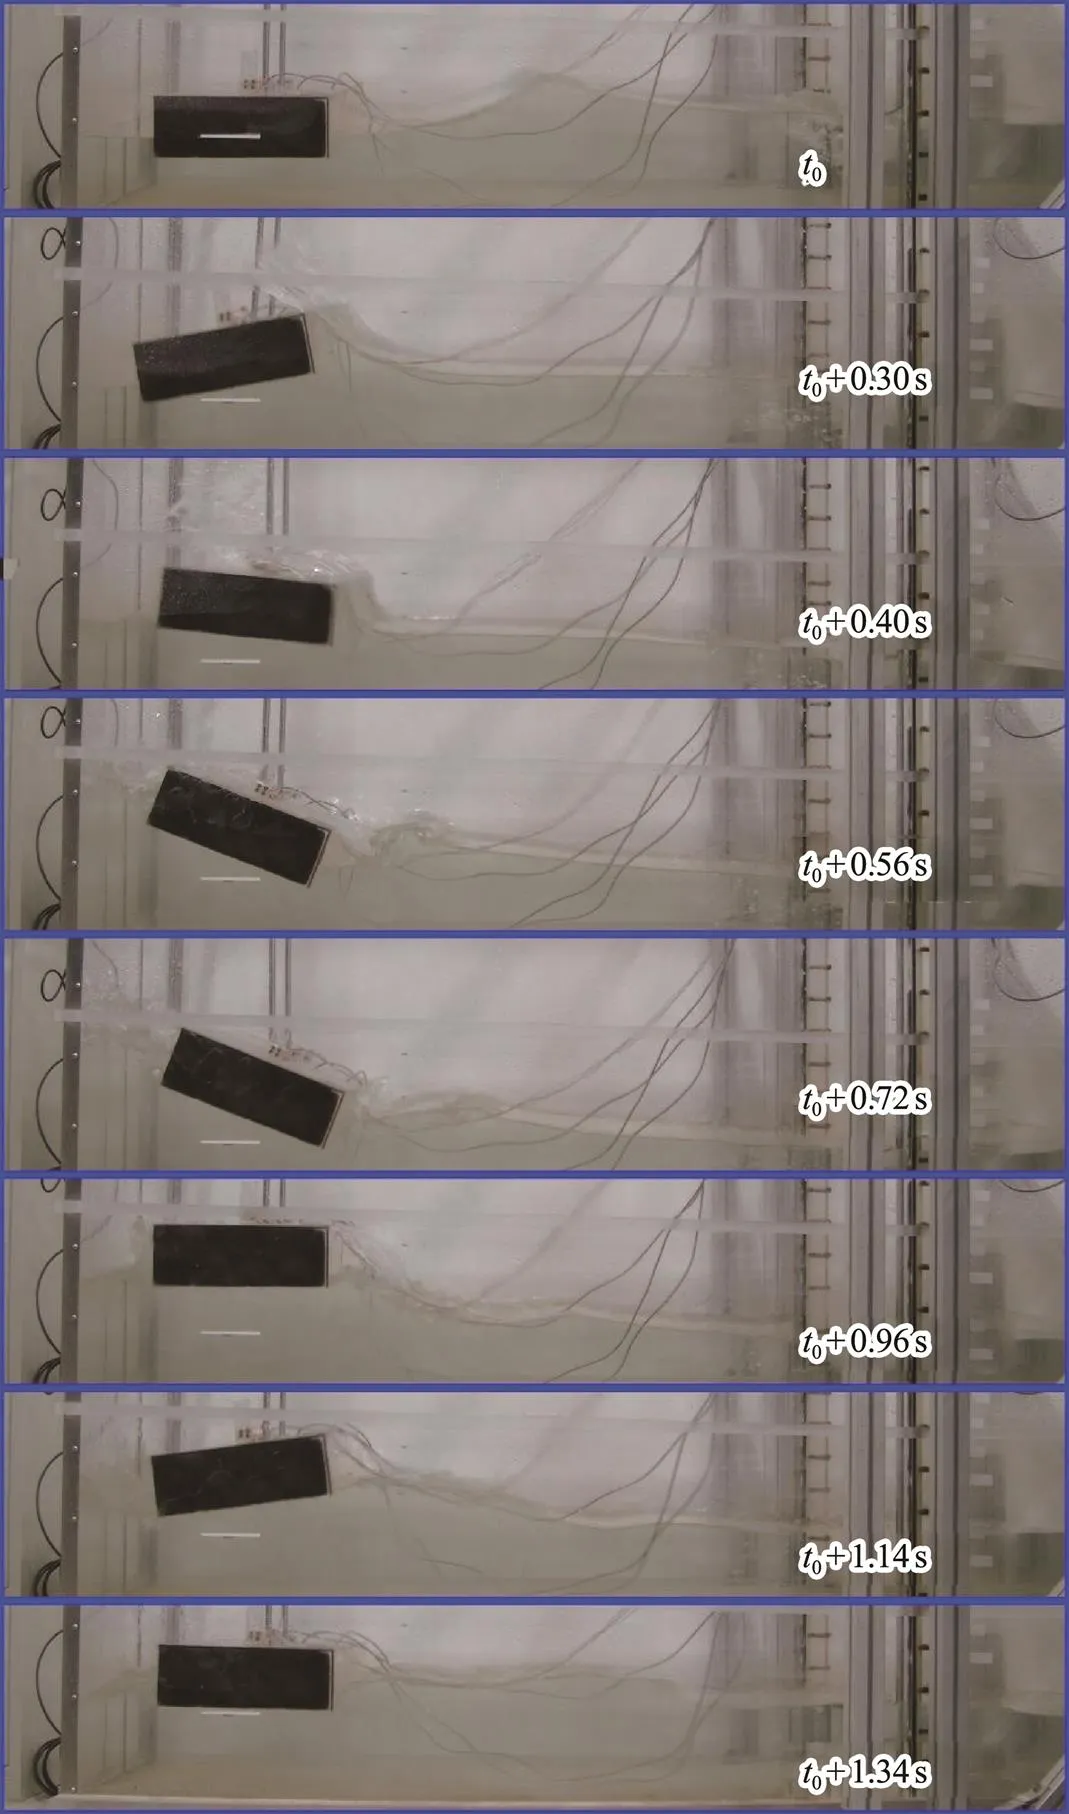
Fig.16 FSI process for the case of γ=0.5. The structure can heave and pitch freely and is left located.
The FSI process for the case of=0.429 is displayed in Fig.17. The complete FSI process is analogous to the process presented in Fig.16. AsHincreases, the volume of the overtopping water increases, and the jet acquires a large horizontal velocity, as seen at=0+0.46s. From=0+0.58s to=0+0.9s, the structure is lifted by the water, but its rotational angle barely changes. Subsequently, the water is reflected by the rear wall. At=0+1.06s, the leeward water level descends, and the structure turns anticlockwise. At=0+1.26s, most of the water has passed through under the structure, and the structure turns clockwise.
The data measured in the experiment are compared in Fig.18. In general, the maximum run-up height increases asdecreases. This relationship is logical because the amplitudes of the incoming bores are different, as seen in the signals measured by WG2. The amplitude of the impact pressure of the first wave decreases compared with those in the cases listed in Subsection 3.3. Furthermore, the amplitude of secondary slamming increases and approaches that of the first wave impact because of the difference in motion states of the structure. This observation is discussed further in Section 4.
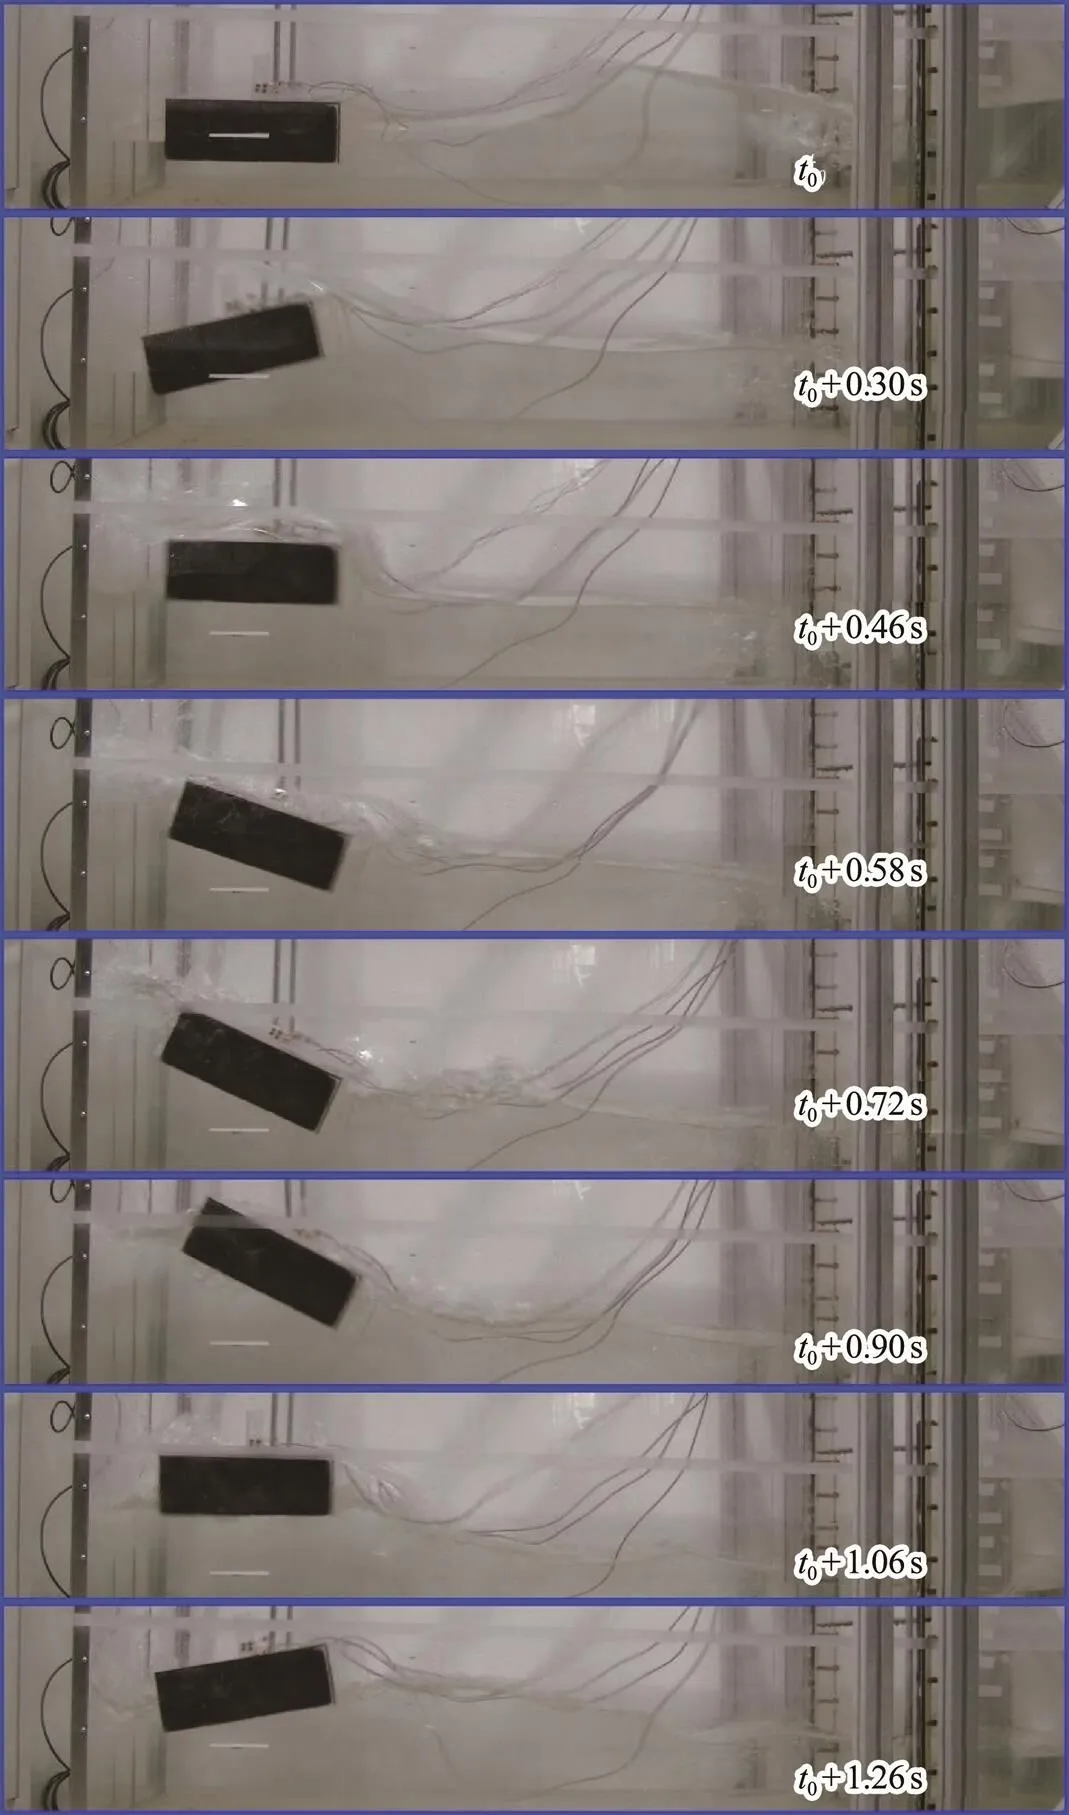
Fig.17 FSI process for the case of γ=0.429. The structure can heave and pitch freely and is left located.
4 Discussion
4.1 Effect of Clearance Between the Structure and Rear Wall on the Interactions of Dam-Break Flow and a Floating Box
The effect of the clearance between the structure and rear wall on the interactions of dam-break flow and a floating box is discussed in this subsection. Here, the cases of=0.6 are considered because the FSI process is relatively mild, and overtopping and wave splashing hardly occur.
The cases in which the structure heaves only are first discussed, and a comparison of the results is presented in Fig.19. In terms of the surface elevation measured by WG2, the two signals nearly coincide with each other at the initial 0.5s, which is expected. In terms of the surface elevation measured by WG1, the maximum run-ups of the two cases occur simultaneously at approximately=1.4s, and the amplitudes obtained are nearly identical. Obvious phase differences in the pressure signals can be observed. This finding is logical because the incident bore rapidly reaches the structure when the clearance is large. The impact pressures for the two cases measured by PP1 share an amplitude of 0.5kPa. However, the amplitudes of the impact pressures measured by PP2 are different. The impact pressure obtained in the case of0=0.3m is larger than that obtained in the case of0=0.75m.
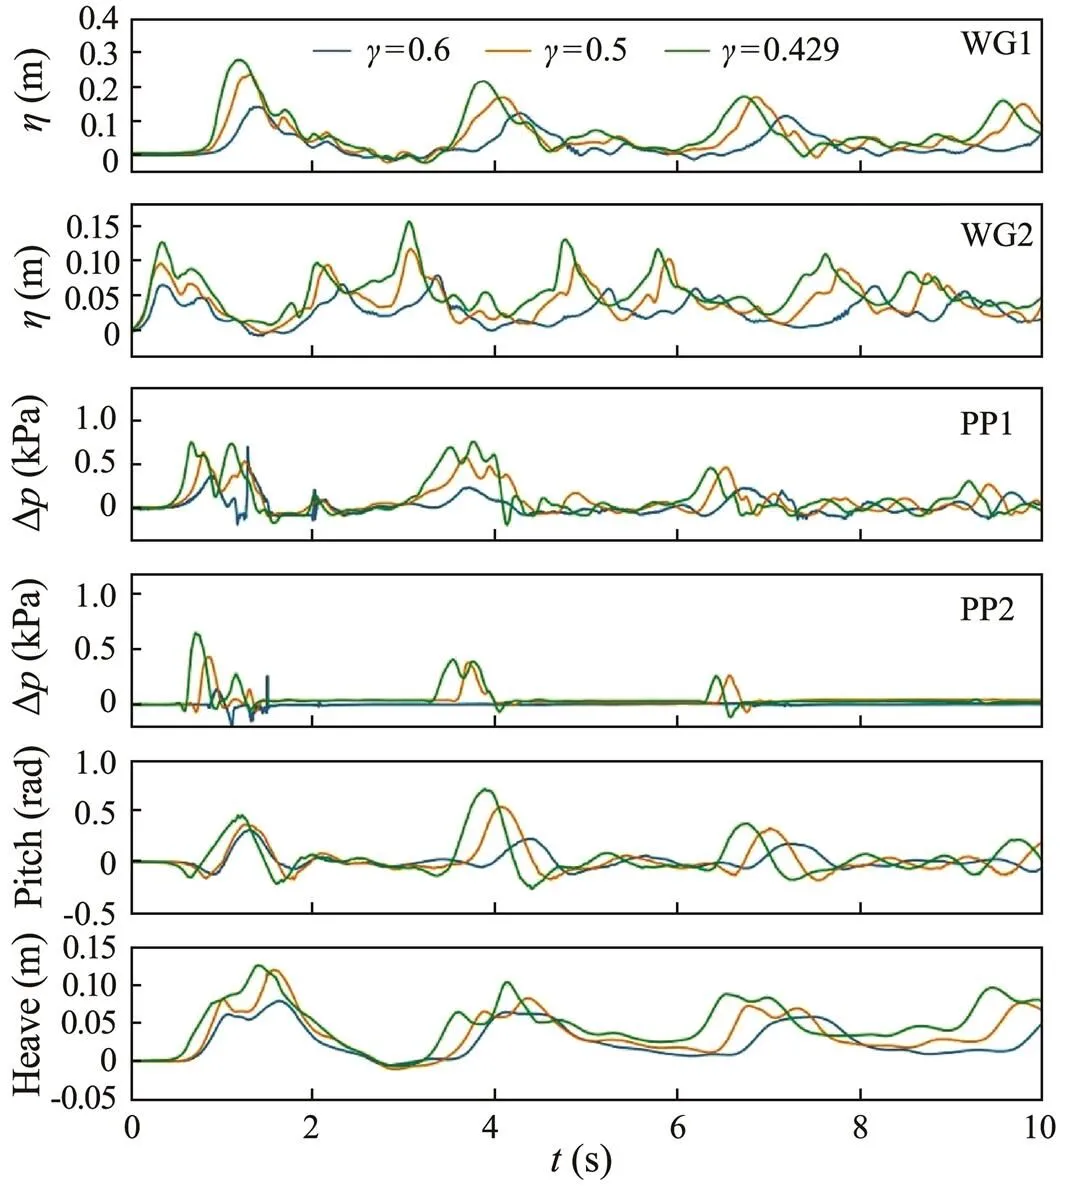
Fig.18 Comparison of the results obtained from cases of different γ. The structure can heave and pitch freely and is left located.
Three dashed lines are introduced in Fig.19 to mark the moments in which secondary slamming occurs to clarify the relationship between secondary slamming and the motion of the structure. From left to right, the dashed lines are labeled L1, L2, and L3; L1 and L3 represent the case of0=0.75m, while L2 represents the case of0=0.3m. As described in Subsection 3.1, secondary slamming occurs after most of the water has passed through the structure. When secondary slamming occurs, the structure descends to a low position because of gravity. At the moment marked by L1, run-up on the rear wall may be expected to occur, which indicates that most of the water has passed through under the structure. The curve of motion states indicates that the structure is descending. Similarly, at the moment marked by L3, the structure is at a relatively low position since most of the water has passed through under the structure a second time because of rear-wall reflection. These observations agree with the discussion presented in Subsection 3.1.
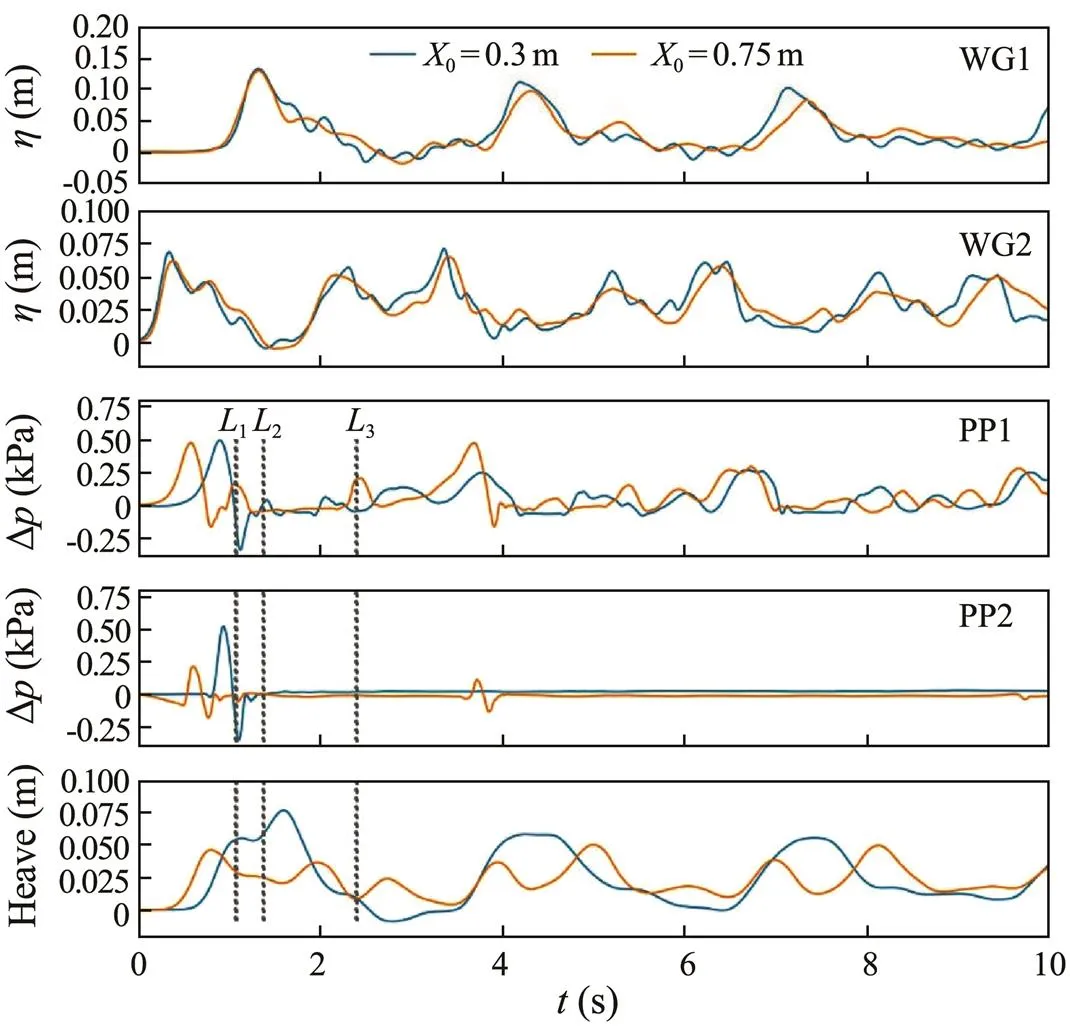
Fig.19 Comparison of the results obtained from cases of different clearance. The structure can heave freely, and γ=0.6.
As observed in Subsection 3.3, the amplitude of secondary slamming decreases as the clearance decreases because the motion state of the structure in the case of0=0.3m is considerably different from that in the case of0=0.75m. With respect to the motion signals measured in the case of0=0.75m, an obvious descending process can be observed from approximately 0.9s to 1.5s (Fig.19). This descent affects the secondary slamming process. As discussed in Subsection 3.1, during secondary slamming, the structure moves downward while the free surface on the seaward surface of the structure moves upward. However, the observed descending process disappears in the motion signal measured in the case0=0.3m. Because of the small clearance available, reflection occurs immediately. Therefore, at the moment marked by L2, the structure is lifted, rather than lowered, by the reflected water. In other words, the structure and free surface on the seaward surface of this structure move upward simultaneously. Therefore,comparedwiththeamplitudeofsecondaryslam- ming measured in the case of0=0.75m, the amplitude of secondary slamming measured in the case of0=0.3m is smaller.
A comparison of the results obtained from cases in which the structure heaves and pitches simultaneously is presented in Fig.20. The amplitude of secondary slamming is similar to the amplitude of the first impact induced by the incident bore. Furthermore, the maximum impact pressure presented in Fig.20 is smaller than that presented in Fig.19. This phenomenon may be explained as follows. On the one hand, the structure has a negative rotational angle (, an anticlockwise angle in the experiment) when the first wave impact occurs. In other words, the displacement of the PP has a horizontal component oriented in the same direction as the incident bore. Such relative motion weakens the impact pressure, similar to the observation presented in Subsections 3.2 and 3.4. On the other hand, when secondary slamming occurs, the rotational angle of the structure is evidently positive (, clockwise in the experiment). Com- pared with the case in which the structure heaves only, the seaward surface of the structure in the present case is closer to the free surface. Therefore, the amplitude of secondary slamming increases when the structure can rotate.
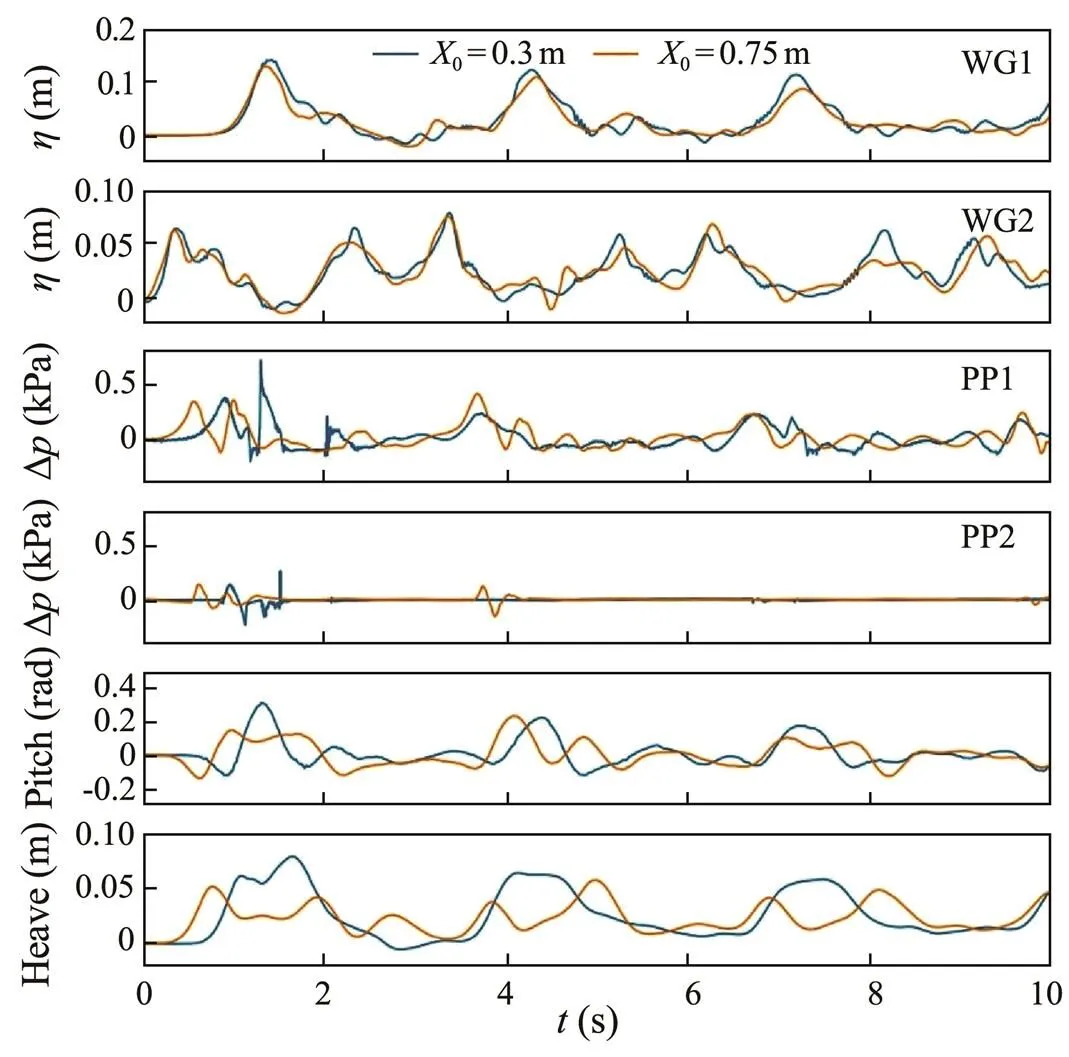
Fig.20 Comparison of the results obtained from cases of different clearance. The structure can heave and pitch freely, and γ=0.6.
4.2 FSI Process Induced by Reflected Waves
The FSI process induced by reflected waves is analyzed in this subsection. In terms of the surface elevation measured by WG2, when=0.429, the amplitude of the reflected wave at approximately=3.0s is larger than that of the incident bore. Thus, when the structure is centrally located, the heave motion amplitude at approximately= 4.5s is the largest among the amplitudes obtained (Figs.6 and 10). By comparison, when the structure is left located, the rotational angle at approximately=4.0s is the largest among the angles obtained (Fig.18).
The large amplitude of reflected waves can be elaborated as follows. The downstream water layer is static prior to gate release. When the gate is lifted, the water in the reservoir flows out abruptly, but the static water layer resists this sudden disturbance. Therefore, a mushroom-like bore appears, and wave breaking occurs in the forward and reverse directions (Jánosi, 2004). In other words, not all of the water propagates toward the structure before the first wave impact. This process is supported by the fact that all of the signals measured by WG2 feature a dual-peak shape within the first 1.0s.
Next, we focus on the maximum rotation that appears in the case of=0.429 and0=0.3m because large rotations are more harmful than large heaves in practical engineering. Fig.21 displays the FSI process induced by the reflected wave; here, the0used is equal to that in Fig.17. At=0+2.82s, the reflected wave propagates toward the structure, and the leeward water level is lower than the seaward water level. At=0+3.08s, the wave strikes the structure. The structure is lifted, and overtopping occurs. However, although the reflected wave has a larger amplitude compared with the incident bore generated by dam-break flow, wave splashing is not observed. At=0+3.18s, the leeward water level rises, and the structure begins to turn clockwise. At=0+3.32s, the leeward water level rises considerably; because the rotational angle observed is fairly large at this point, the overtopping water flows back along the top surface of the structure. At=0+3.52s, the maximum rotational angle of the structure appears, and the leeward water level ceases to rise. At this point, the rotational angle is so large that great losses may occur if a barge (or any other vessel) is to experience this angle. At=0+3.68s, the leeward water propagates under the structure, causing the latter to turn anticlockwise. At=0+3.92s, most of the leeward water has passed through the structure. The rotation of the structure generates an obvious wave on the seaward surface. At=0+4.32s, the leeward water level is close to the seaward water level, and the rotational angle of the structure equals approximately 0. The newly generated wave moves backward, and wave breaking can be observed. Furthermore, as seen in Fig.18, the run-up induced by the reflected wave is smaller than that induced by the incident bore. Therefore, wave splashing may be deduced to have a significant effect on the run-up; the bore amplitude also affects the rotation of the structure significantly.

Fig.21 FSI process induced by the reflected wave for the case of γ=0.429. The structure can heave and pitch freely and is left located.
4.3 Maximum Run-up on the Rear Wall
LetRdenote the maximum run-up on the rear wall. The maximum run-up for all cases is presented in Fig.22; here, the horizontal axis represents, and thevertical axis represents the non-dimensional run-up valueR/H. When=0.6, the values ofR/Hare similar and consistently smaller than 0.6. As discussed in Section 3, when=0.6, the incident bore has a small amplitude and horizontal velocity, and overtopping and wave splashing hardly occur. Therefore, the FSI process is mild, and the run-up height is low.
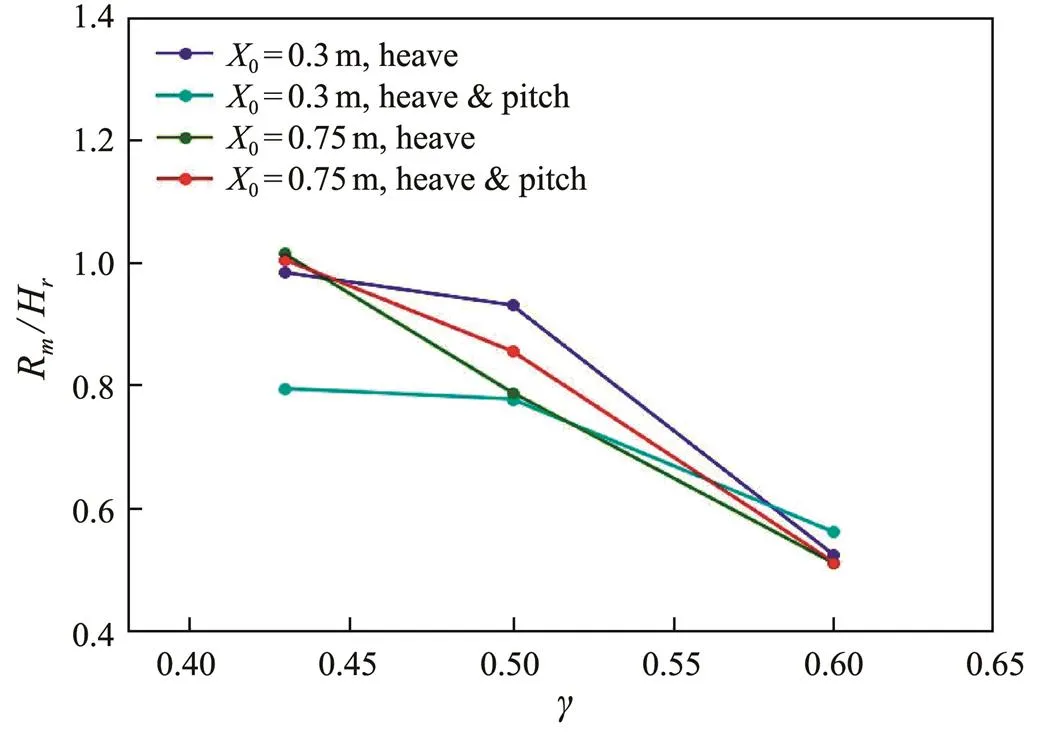
Fig.22 Non-dimensional maximum run-up on the rear wall.
Asdecreases, the amplitude of the incident bores increases andR/Hincreases considerably. The FSI process becomes intense, and non-linear phenomena, such as over- topping and wave splashing, appear. When=0.429, the values ofR/Hobtained from the cases of0=0.75m are slightly larger than 1.0, while the values ofR/Hobtained from the cases of0=0.3m are smaller than 1.0. In practical engineering, the effect of the clearance on the run-up tends to be more significant than that observed in the present experiment. For example, in the cases of0=0.75m, the run-up height may exceed the measurement range of the WG, as seen in Fig.5 at=0+0.8s, as well as in Fig.9 at=0+0.9s. Thus, the values ofR/Hobtained from the cases of0=0.75m are smaller than the actual values. Such discrepancies may be investigated in future research by using numerical modeling.
For the cases of0=0.3m, the jet generated by overtopping affects the run-up considerably. Because the structureis close to the rear wall, the jet directly strikes the rear wall with a relatively large horizontal velocity, resulting in wave splashing. In the case where the structure heaves only, wave splashing is extremely chaotic, and the falling water strikes the run-up water, which causes the leeward free surface to become highly disordered, as seen in Fig.13 at=0+0.78s. However, when the structure can rotate, the results of wave splashing are not as chaotic as that observed in the case when the structure heaves only, as seen in Fig.17 at=0+0.72s, because the rotation of the structure weakens the jet. Therefore, the measured run-up for the case in which the structure can rotate is smaller than that for the case in which the structure heaves only.
5 Conclusions
An experiment that investigates the interactions of dam-break flow and a floating box is reported. The FSI process is elaborated, and the effects of reservoir depth, clearance between the structure and rear wall, and motion of the structure on these interactions are discussed. The hollow between the structure and free surface and the phenomenon of secondary slamming are also observed and discussed.
The value ofaffects the FSI process significantly; indeed, the smaller the value of, the more intense the FSI process. When=0.6, the FSI process is mild and water hardly overtops the structure. Therefore, most of the water passes through under the structure. When theis less than 0.6, overtopping and wave splashing occur. The incident bore is divided into two parts by the structure: the first part is a jet generated by the wave impact and the second part is comprised of water passing through under the structure.
The heave motion of the structure is mainly induced by the water passing through under the structure. Specifically, the structure is lifted when water passes through under it. After the water has passed through the structure, the structure drops because of gravity. The pitch motion of the structure is induced by the incident wave and water passing through under the structure. In the experiment, the impact of the incident wave drives the structure to turn anticlockwise initially. The water passing through under the structure subsequently drives it to turn clockwise, during which the leeward water level rises while the seaward water level descends.
When the clearance between the structure and rear wall is small, rear-wall reflection occurs immediately to affect the motion states of the structure. Thus, the maximum translational and rotational motions measured in the case of0=0.75m are smaller than those measured in the case of0=0.3m. Furthermore, when the clearance is small, the leeward water motion is quite different from that observed in the case of0=0.75m. If the structure heaves only, the water demonstrates quasi-piston-type motion, which is slightly analogous to the water motion observed in narrow-gap problems. If the structure can heave and rotate simultaneously, the water body motion observed is slightly analogous to the motion observed in resonant-sloshing problems. A small clearance also causes the effect of the jet to become more significant: the jet hits the rear wall directly and initiates wave splashing. The falling water generated by wave splashing generates disorder on the leeward free surface, which affects the run-up on the rear wall.
Secondary slamming is caused by the relative motion of the structure and free surface. When the structure heaves only, the amplitude of secondary slamming is smaller thanthe amplitude of the first wave impact induced by the incident bore. Secondary slamming can be observed on both sides of the structure and hardly affects the freeboard surface. When the structure can rotate, the amplitude of the first impact decreases and the amplitude of secondary slam- ming increases. As a result, the amplitudes of the first impact and secondary slamming are relatively similar. When the structure can rotate, secondary slamming occurs on only one side of the structure, and its effect on the freeboard sur- face is non-negligible.
The occurrence of maximum run-up on the rear wall is also discussed. The values ofand0affect the maximum run-up significantly, and the rotational motion of the structure weakens the run-up process.
Acknowledgements
The study was supported by the National Key Research and Development Program of China (No. 2016YFC0303401), the National Natural Science Foundation of China (No. 51779236), and the National Natural Science Foundation of China-Shandong Joint Fund (No. U1706226).
Buchner, B., 2002. Green water on ship-type offshore structures. PhD thesis. Delft University of Technology.
Bukreev, V. I., and Zykov, V. V., 2008. Bore impact on a vertical plate., 49 (6): 926-933.
Gerritsen, H., 2005. What happened in 1953? The Big Flood in the Netherlands in retrospect., 363 (1831): 1271-1291.
Greco, M., Colicchio, G., and Faltinsen, O. M., 2007. Shipping of water on a two-dimensional structure. Part 2., 581: 371-399.
Greco, M., Faltinsen, O. M., and Landrini, M., 2005. Shipping of water on a two-dimensional structure., 525: 309-332.
Hernández-Fontes, J. V., Esperança, P. de T. T., Graniel, J. F. B., Sphaier, S. H., and Silva, R., 2019. Green water on a fixed structure due to incident bores: Guidelines and database for model validations regarding flow evolution., 11 (12): 2584.
Hernández-Fontes, J. V., Vitola, M. A., Silva, M. C., Esperança, P. de T. T., and Sphaier, S. H., 2018. On the generation of isolated green water events using wet dam-break.–, 140 (5): 51101.
Hu, Z., Xue, H., Tang, W., and Zhang, X., 2015. A combined wave-dam-breaking model for rogue wave overtopping., 104: 77-88.
Jánosi, I. M., Jan, D., Szabó, K. G., and Tél, T., 2004. Turbulent drag reduction in dam-break flows., 37 (2): 219-229.
Jung, K. H., Chang, K.-A., and Jo, H. J., 2006. Viscous effect on the roll motion of a rectangular structure., 132 (2): 190-200.
Kao, H. M., and Chang, T. J., 2012. Numerical modeling of dambreak-induced flood and inundation using smoothed particle hydrodynamics., 448: 232-244.
Kristiansen, T., and Faltinsen, O. M., 2010. A two-dimensional numerical and experimental study of resonant coupled ship and piston-mode motion., 32 (2): 158176.
Lauber, G., and Hager, W. H., 1998. Experiments to dambreak wave: Horizontal channel., 36 (3): 291-307.
Li, J., You, Y., Chen, K., and Zhang, X., 2019. Numerical computations of resonant sloshing using the modified isoAdvector method and the buoyancy-modified turbulence closure model., 93: 101829.
Lobovský, L., Botia-Vera, E., Castellana, F., Mas-Soler, J., and Souto-Iglesias, A., 2014. Experimental investigation of dynamic pressure loads during dam break., 48: 407-434.
Lu, S., Liu, H., and Deng, X., 2018. An experimental study of the run-up process of breaking bores generated by dam-break under dry- and wet-bed conditions., 12 (2): 1840005.
Mokhtar, Z. A., Mohammed, T. A., Yusuf, B., and Lau, T. L., 2019. Experimental investigation of tsunami bore impact pressure on a perforated seawall., 84: 291-301.
Ning, D., Zhao, X., Göteman, M., and Kang, H., 2016. Hydrodynamic performance of a pile-restrained WEC-type floating breakwater: An experimental study., 95: 531-541.
O’Donoghue, T., Pokrajac, D., and Hondebrink, L. J., 2010. Laboratory and numerical study of dambreak-generated swash on impermeable slopes., 57 (5): 513-530.
Ozmen-Cagatay, H., and Kocaman, S., 2011. Dam-break fow in the presence of obstacle: Experiment and CFD simulation., 5 (4): 541-552.
Ryu, Y., Chang, K.-A., and Mercier, R., 2007. Application of dam-break flow to green water prediction., 29 (3): 128-136.
Shigematsu, T., Liu, P. L.-F., and Oda, K., 2004. Numerical modeling of the initial stages of dam-break waves., 42 (2): 183-195.
Stansby, P. K., Chegini, A., and Barnes, T. C. D., 1998. The initialstages of dam-break flow., 374 (1): 407-424.
Tan, L., Lu, L., Tang, G., Cheng, L., and Chen, X., 2019. A viscous damping model for piston mode resonance., 871: 510-533.
Yilmaz, O., Korobkin, A. A., and Iafrati, A., 2013. The initial stage of dam-break flow of two immiscible fluids. Linear analysis of global flow., 42: 60-69.
Zhang, Y., Li, M., Zhao, X., and Chen, L., 2020. The effect of the coastal reflection on the performance of a floating breakwater-WEC system., 100: 102117.
(Oceanic and Coastal Sea Research)
https://doi.org/10.1007/s11802-022-4842-4
ISSN 1672-5182, 2022 21 (3): 633-646
(November 17, 2020;
January 11,
2021; accepted January 18, 2021)
© Ocean University of China, Science Press and Springer-Verlag GmbH Germany 2022
Corresponding author. Tel: 0086-532-66781125 E-mail: dongsh@ouc.edu.cn
(Edited by Xie Jun)
 Journal of Ocean University of China2022年3期
- Journal of Ocean University of China的其它文章
- Effect of Intertidal Elevation at Tsuyazaki Cove, Fukuoka,Japan on Survival Rate of Horseshoe Crab Tachypleus tridentatusEggs
- Asian Horseshoe Crab Bycatch in Intertidal Zones of the Northern Beibu Gulf: Suggestions for Conservation Management
- Variational Solution of Coral Reef Stability Due to Horizontal Wave Loading
- High Microplastic Contamination in Juvenile Tri-Spine Horseshoe Crabs: A Baseline Study of Nursery Habitats in Northern Beibu Gulf, China
- Influence of Autonomous Sailboat Dual-Wing Sail Interaction on Lift Coefficients
- Nonlinear Dynamic Analysis and Fatigue Study of Steep Wave Risers Under Irregular Loads