
Nonlinear Dynamic Analysis and Fatigue Study of Steep Wave Risers Under Irregular Loads
2022-06-14 04:12GUHongluGUOHaiyanLIXiaominLIFuhengandLIUZhen
关键词:页码
GU Honglu, GUO Haiyan, LI Xiaomin, 2), *, LI Fuheng, and LIU Zhen
Nonlinear Dynamic Analysis and Fatigue Study of Steep Wave Risers Under Irregular Loads
GU Honglu1), GUO Haiyan1), LI Xiaomin1), 2), *, LI Fuheng1), and LIU Zhen1)
1) College of Engineering, Ocean University of China, Qingdao 266100, China 2) Shandong Provincial Key Laboratory of Ocean Engineering, Ocean University of China, Qingdao266100, China
As a reliable alternative option for traditional steel catenary risers (SCRs), steep wave risers (SWRs) have been widely applied to deepwater oil and gas production. However, the nonlinear dynamic analysis of SWRs is more complicated than that of traditional SCRs due to their special configuration and significant geometric nonlinearity. Moreover, SWRs are highly susceptible to fatigue failure under the combined excitation of irregular waves and top floater motions (TFMs). In this study, considering irregular waves and TFMs, a numerical SWR model with an internal flow is constructed based on the slender rod model and finite element method. The Newmark-βmethod is adopted to solve the dynamic behavior of SWR. Moreover, the Palmgren-Miner rule, a specified S-N curve, and rainflow counting method are applied to estimate the fatigue damage. An efficient numerical computation procedure,, DRSWR, is programmed with MATLAB in this study. Calculation results are compared with those of OrcaFlex to verify the accuracy of the DRSWR. The nonlinear dynamic response and fatigue damage of an SWR under the combined excitation of irregular waves and TFMs are obtained, and a comprehensive parametric analysis is then conducted. The analysis results show that the buoyancy section undergoes the highest level of stress and fatigue damage under the combined excitation of irregular waves and TFMs. An internal flow with high velocity and high density produces a high level of fatigue damage. The buoyancy factor and length of the buoyancy section should be set moderately to reconcile the reduction of the top tension with increased fatigue life. These results are expected to provide some reference significance for the engineering design of SWR.
steep wave riser; slender rod model; nonlinear dynamic analysis; fatigue damage; sensitivity analysis
1 Introduction
In recent years, offshore oil and gas exploitation has been transferred to deep- and ultra-deepwater. The increase in the length of traditional steel catenary risers (SCRs) results in a significant increase in the top tension. In addition, severe top floater motions (TFMs) and harsh environmentalconditions will lead to high levels of structural stress, dynamic buckling, and serious fatigue damage accumulation at the hang-off point and touchdown zone (TDZ). Thus, traditional SCRs may not be suitable for deepwater oil andgas exploitation (Wu and Huang, 2007; Yang and Li, 2011; Kim, 2015).
Accordingly, wave risers (WRs) emerge as the times require, which mainly include lazy wave risers (LWRs) and steep wave risers (SWRs). By installing several buoyancy modules to the middle section of traditional SCRs to form an arc bend section, WRs greatly reduce the tension at the hang-off point. The dynamic response between the top floater and TDZ is decoupled, so the adaptability of the WRs to the TMF is greatly improved. Among WRs, the configuration of SWRs is steeper, the horizontal span is smaller, and the bottom of the riser is almost perpendicu- lar to the seabed, which can effectively avoid the problem of seabed stability. In addition, SWRs are well adapted to situations where the internal flow density changes, so they have significant advantages in deepwater oil and gas pro- duction (Bai and Bai, 2014). However, the design and anal-ysis of SWRs face many prominent difficulties, such as complex overall configuration and nonlinear coupling of the internal flow. Moreover, SWRs will have large defor- mation and rotation angle under harsh environmental con- ditions, which will produce a significant geometric non- linearity. This condition further increases the difficulty of model establishment and structural dynamic analysis.
Extensive studies have been performed on traditional SCRs and LWRs, including static responses, dynamic behaviors, and pipe-soil interactions (Kirk and Etok, 1979; Fu and Yang, 2010; Yang and Li, 2011; Wang, 2012; Elosta, 2013; Ruan, 2014; Wang, 2014; Bai, 2015; Kim and Kim, 2015; Wang, 2018; Liu and Guo, 2019; Cheng, 2020), whereas studies on SWRs are relatively fewer.
Santillan(2010) simplified an SWR into a slender elastic rod and analyzed the static and dynamic responses of the SWR through the finite difference method (FDM). Sun and Qi (2011) conducted a global analysis of an SWRusing OrcaFlex and presented a parameter analysis on the dynamic response of SWR under different current velocities and lengths of the buoyancy module. Based on the large deformation beam theory and mechanics equilibrium principle, Qiao(2016) established the motion equations of SWRs and combined the FDM andshooting method to perform a static analysis of SWRs under current. Liu and Guo (2018) established a numerical SWR model with an internal flow based on the slender rod model. In addition, they performed a series of parameter sensitivity analyses on the static and dynamic responses of SWRs.
All the studies reviewed here indicate that the nonlinear dynamic response of SWRs has not been studied in detail and comprehensively. Most of the present studies have ignored the role of internal flows and simplified waves and TFMs to harmonic motion, which is inconsistent with actual ocean conditions. In addition, present studies on the dynamic response of SWRs are extremely lacking. There are few reports on the nonlinear dynamic analysis and fatigue study of SWRs under the combined excitation of internal flows, irregular waves, and TFMs.
The primary objective of this study is to investigate the nonlinear dynamic behavior and fatigue damage of SWRs subjected to irregular waves and TFMs and provide a certain reference significance for the practical engineering applications of SWRs. Considering the internal flow, the governing equations of SWR are established based on the slender rod model. The finite element method (FEM) is applied to discretize governing equations, and the Newton-Raphson and Newmark-β methods are used to solve the nonlinear static and dynamic responses, respectively. Moreover, the Palmgren-Miner rule, a specified S-N curve, and rainflow counting method are applied to estimate the fatigue damage of SWRs.
This paper is organized as follows: in Section 2, the numerical model of SWRs is briefly described. In Section 3, the accuracy of the DRSWR is verified by comparing its results with those of OrcaFlex. In Section 4, the nonlinear dynamic response and fatigue damage of SWRs under the combined excitation of irregular waves and TFMs are presented. A series of sensitivity analyses are performed to investigate the influencing parameters in the fatigue damage of SWRs. Finally, in Section 5, the conclusions are summarized.
2 Mathematical Models
2.1 SWR Model
A typical SWR model is presented in Fig.1. The riser consists of three parts: decline section A–B, buoyancy section B–C–D, and hang-off section D–E–F. The decline section A–B is suspended in water from the touchdown point (TDP) to the beginning of the buoyancy section, which is almost perpendicular to the seabed near the TDP. The upward buoyancy of the buoyancy section is greater than the downward gravity. Thus, an arc bend is generated, and the peak of the arc bend is called the arc bend point. The hang-off section represents the riser section from the end of the buoyancy section to the hang-off point, which has a sag bend, and the lowest point is called the sag bend point. The hang-off point of the riser is connected with a floater, and the TDP is connected with a subsea base.
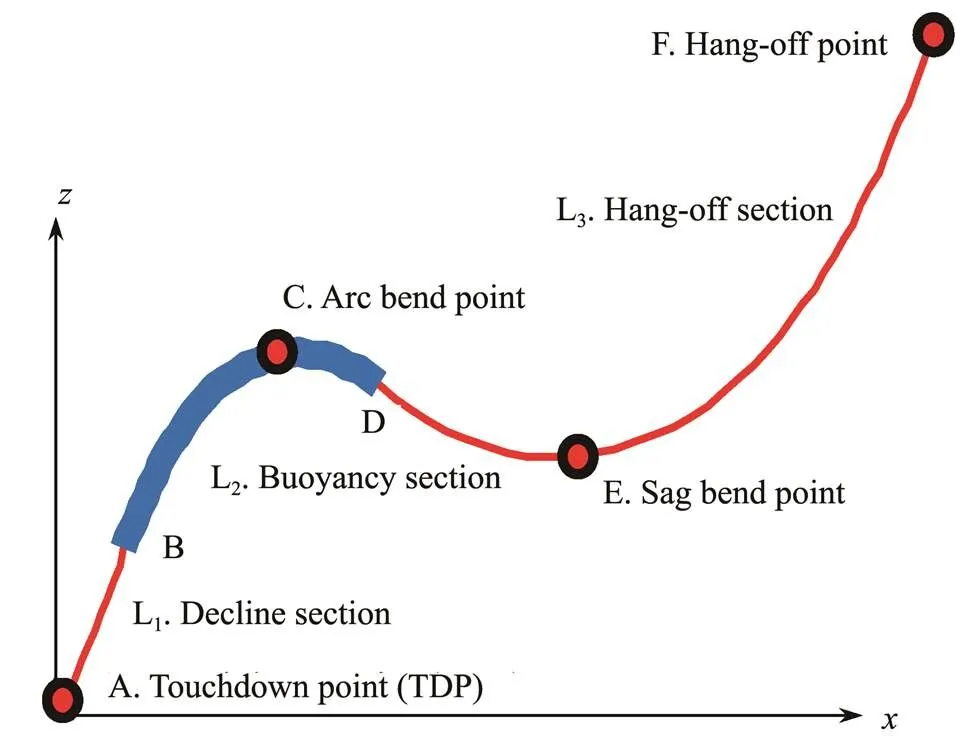
Fig.1 Typical configuration of an SWR.
2.2 Slender Rod Model
In recent years, a special elastic rod theory based on absolute coordinates has been widely applied to the numericalsimulations of slender flexible structures (Ruan, 2014, 2016; Kim and Kim, 2015; Cheng, 2020). This theory eliminates the process of converting physical parameters from local coordinates to global coordinates, which is necessary for commercial software (, OrcaFlex and Flexcom 3D), making the numerical model efficient. Thus, based on the slender rod model (Garrett, 1982),, an absolute coordinate approach as mentioned above, the governing equations of SWR are established.
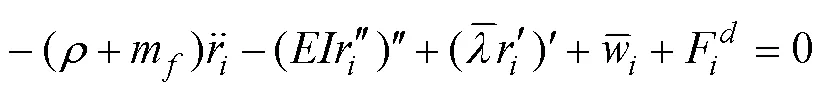
As shown in Fig.2, the centerline of the rod deformed state is represented by the space curve(,), which is a function of the arc lengthand time. Assuming that the arc length of the rod does not change, the internal force state of any point on the rod can be completely represented by the resultant forceand bending moment. Moreover, the effects of the moment of inertia and shear deformation are ignored. From the conservation of linear and angular momenta, the motion equations of the rod with the internal flow can be obtained (Garrett, 1982).
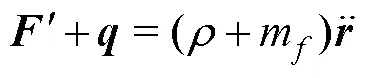
, (2)
whereand mare the mass of the rod and internal flow per unit length,is the external force per unit length, andis the external moment per unit length. According to the Euler-Bernoulli beam theory,can be expressed as
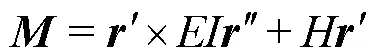
whereis the bending stiffness andis the section torque. Generally, the effects of the uniform torque and distributed external torque can be ignored for SWRs. Thus, the motion equations of rod can be written as
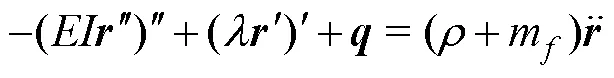
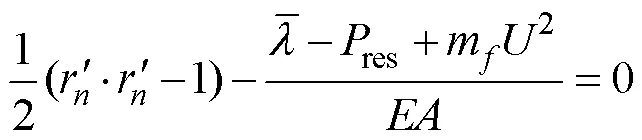
Assuming that the SWR is extensible and the elongation is small, the deformation compatibility equation of SWR can be obtained:
where EA is the axial tensile stiffness of the riser.
2.3 Simulations of TFMs and Irregular Waves
The motion analysis of the top floater is directly related to the sea surface motion. The response of the top floater to the significant wave height is generally estimated by the response amplitude operators. In this paper, only the surge effect of the top floater is considered. The motion response of the top floater can be expressed by the motion model recommended by Sexton and Agbezuge (1976):
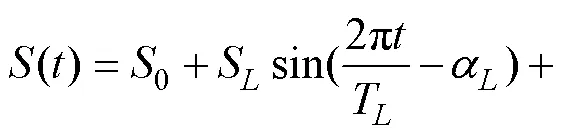
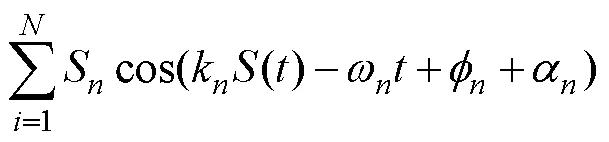
The three terms at the right end of the equation are the mean offset, low-frequency motion, and wave-frequency motion, where0is the mean offset;Sis the single amplitude of the vessel drift;Tis the period of the vessel drift;αis a phase angle between the drift motion and wave, which is usually taken as 0;Sis the amplitude response of the vessel to a specific wave (period:T=2π/ω, amplitude:A); andk,, andare the wave number, wave phase angle, and phase angle between the TFM response and wave period, respectively.
The JONSWAP spectrum can be used in a wide range and applied to waves at different growth stages. Thus, the JONSWAP spectrum recommended in DNV RP C205 (DNV, 2007) is selected to simulate irregular waves:
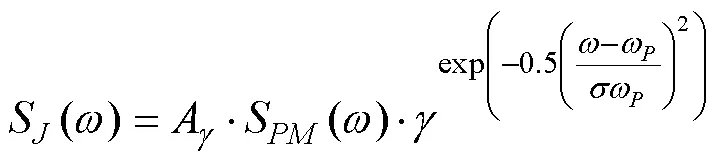

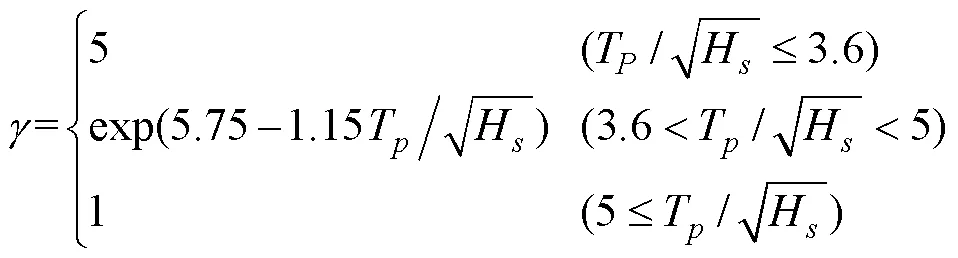
whereA=1−0.287lnis a normalizing factor,His the significant wave height,ω=2π/Tis the angular spectral peak frequency,Tis the peak period, andis the nondimensional peak shape parameter. For1, the JONSWAP spectrum reduces to the PM spectrum. For the values of, the following value can be applied:
The irregular waves and corresponding water particle kinematics are simulated by the Longuet-Higgins model (Borgman, 1969) from their respective spectra.
2.4 Load Analysis
For an SWR in a marine environment, the external loadcan be expressed as follows:
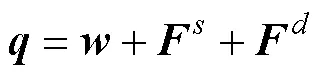
whereis the weight per unit length,andare the hydrostatic and hydrodynamic loads per unit length, respectively.
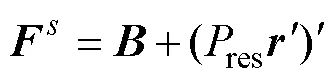
whereis the buoyancy force per unit length, and the second term at the right end of the equation is the load caused by the pressure difference between the two ends of the riser, whereres=pA−pAis the hydrostatic pressure.
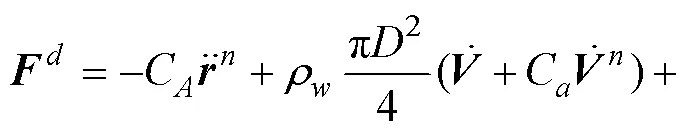
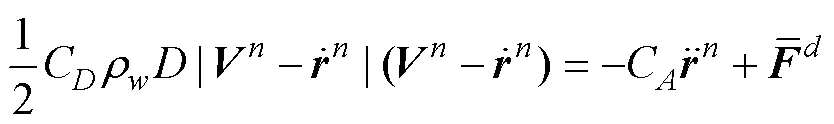
The hydrodynamic force mainly includes the inertial force and drag force, which can be calculated by the Morrison equation:

In this study, the plug flow model is applied for the internal flow. The model assumes that the internal flow is a slender cylinder with the same velocityat any point in a cross section. The force induced by the internal flow on the riser can be expressed as follows (Païdoussis, 2004):
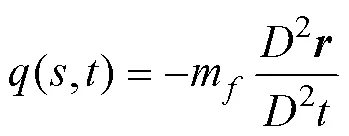
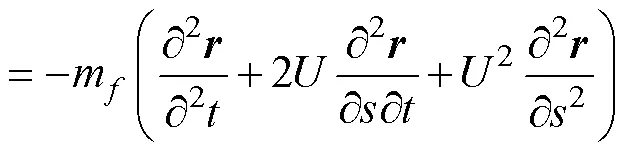
The right-end terms of the equation are as follows: inertial force, Coriolis force, and centripetal force caused by fluid maintaining the same curvature as the riser.
2.5 Finite Element Model (FEM)
The numerical analysis methods of risers mainly include the lumped-mass method (, OrcaFlex), FDM, and FEM. Among them, the FEM is employed in this study given that it is an accessible approach to handle complicated configurations and boundary conditions and has good continuity. Due to the nonlinear governing equations, the equations are expressed in the tensor form for convenience:
The quadratic and cubic Hermit interpolation functions are used for discretization, and then the Galerkin method is used to obtain the differential equations in matrix form for SWRs as follows:
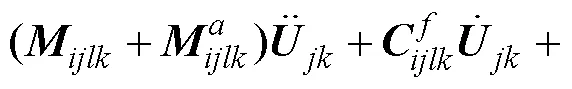
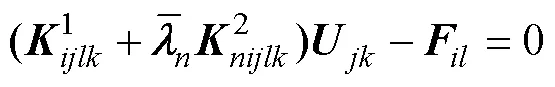

whereA,A,P, andPare interpolation functions.is the pressure difference between the inside and outside of the riser. For 3D problem,,=1, 2, 3represents the three directions of node motion (,,,).,,,=1, 2, 3, 4 are the numbers of the cubic Hermite interpolation functions (A/k/s/t).,=1, 2, 3, corresponding to the number of the quadratic Hermite interpolation functions (P/n).
2.6 Static and Dynamic Analyses
Neglecting the inertial force, Eqs. (16)–(17) constitute the governing equations for the static analysis of risers.
is composed of gravity, drag force caused by current, and other static loads. These nonlinear algebraic equations are solved through the Newton-Raphson method, which is a classical method for solving nonlinear equations.
On the basis of static analysis, the governing equations of dynamic analysis are obtained by considering various dynamic loads. In a dynamic analysis,is composed of static loads and dynamic loads. Taking the equilibrium shape of the riser as the initial condition, the dynamic response of SWRs is solved using the predictor-corrector Newmark-method.
2.7 Fatigue Damage Analysis
The stress calculation equation of an SWR can be expressed as follows:
whereTis the effective tension,is the cross-sectional area,is the modulus of elasticity,is the outer diameter of an SWR, andis the curvature.
The stress time history of SWRs is processed through the rainflow counting method (Anzai and Endo, 1979) and the Goodman empirical formula to obtain the equivalent zero-mean stress.
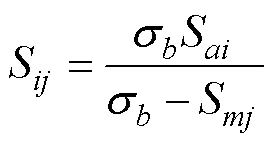
whereSis the equivalent zero-mean stress,Sis the-th stress amplitude,Sis the-th mean stress, andσis the ultimate strength.
According to the-curve, for a constant stress range, the number of failure stress cycles can be expressed as follows:

whereis the stress amplitude, logis the interception of the-curve in double logarithmic coordinates,is the slope of the-curve in double logarithmic coordinates.
Referring to DNV RP C203 (DNV, 2008), thecurve without cathodic protection in seawater environment is selected in this study: log=11.687 and=3.
According to the Palmgren-Miner linear cumulative dam- age theory, the global fatigue damage should meet the following formula:
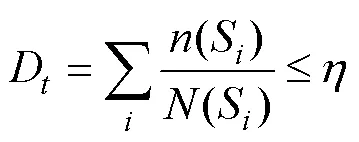
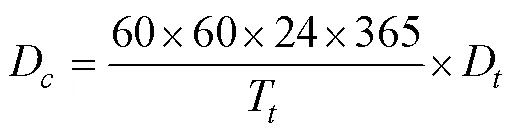
whereDis the cumulative measure of the fatigue damage during the calculation time,Dis the cumulative measure of the fatigue damage during a year,(S) is the stress cycle counts obtained by the rainflow counting method,(S) is the number of fatigue failure cycles determined by the corresponding-curve,Sis the stress amplitude of theriser,=1/is the usage factor,is the design fatigue factor (according to the DNV RP F204 (DNV, 2005),10), andTis the calculation time.
Based on the above theory, a calculation program of SWRs was written on MATLAB, which is referred to as ‘DRSWR’ in this paper.
3 Model Validation
3.1 Verification of an Irregular Wave Simulation
The detailed physical parameters of a SWR are shown in Table 1. In this study, the irregular wave parameters proposed by Li(2010) are selected as follows:H=6.5 m andT=12.82s. The significant wave heightand frequency spectrum of irregular waves simulated by the DRSWR are compared with those simulated by OrcaFlex under the conditions of the same parameters, as shown in Fig.3. Fig.3(a) shows that the irregular waves simulated by the DRSWR are basically consistent with those of Orca- Flex inH, and the standard deviation between theHof OrcaFlex and DRSWR is only approximately 0.08 after the calculation. Fig.3(b) shows the comparison of the JON- SWAP theory spectrum, OrcaFlex simulation spectrum, and DRSWR simulation spectrum. The results of DRSWR and OrcaFlex agree well with each other. Therefore, the ac- curacy of the wave simulation of the DRSWR can be used for dynamic calculations.
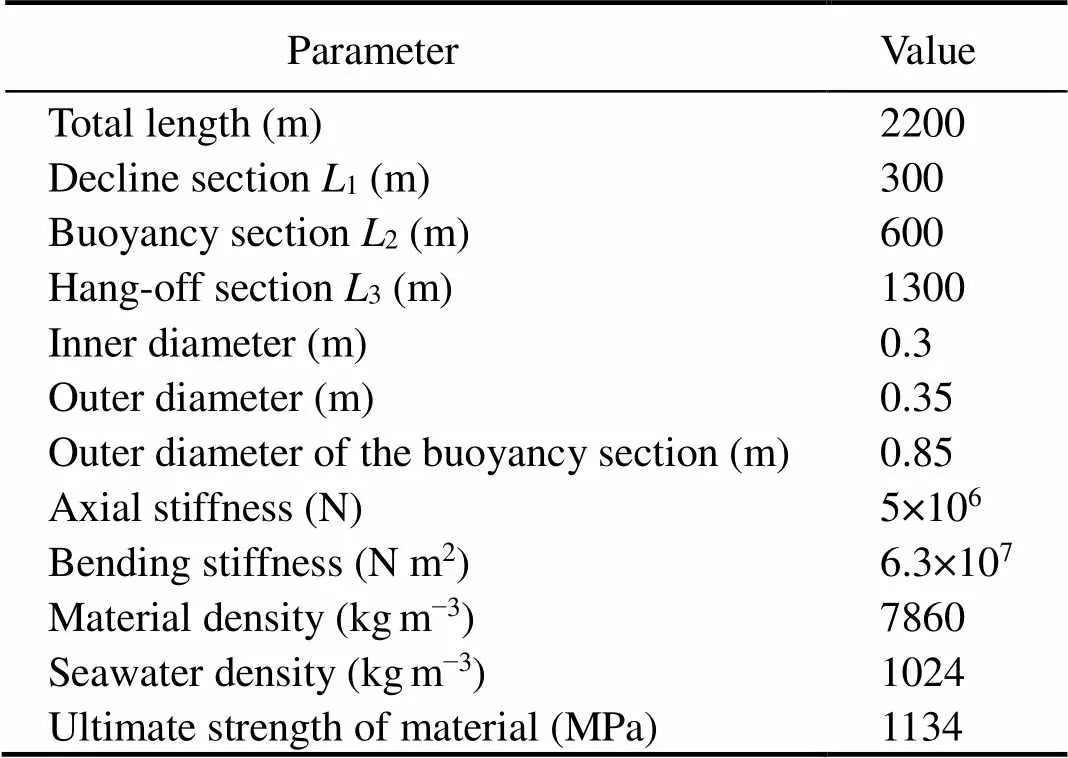
Table 1 Physical parameters of a SWR
3.2 Verification of the Dynamic Analysis Under Irregular Waves
The DRSWR is applied to calculate the stress response of SWRs under an irregular wave. The irregular-wave data are the same as above. The calculation results of the DR- SWR are compared with those of OrcaFlex under the same conditions. As shown in Fig.4, the calculation results of the DRSWR are in good agreement with those of Orca- Flex.
3.3 Verification of the Dynamic Analysis Under TFMs
Because the size of the top floater is negligible as compared with the water depth, the TFM is transformed into the dynamic boundary condition of the top node of the SWR. Based on the cases shown in Table 2, the time history of the SWR top tension is calculated by the DRSWR. The calculation results are compared with those of OrcaFlex. As shown in Fig.5, the calculation results are basically consistent.
Larsen (1992) presented a description and comparison of the flexible pipe static/dynamic analysis programs. The research results indicated that the calculation results of each program are different to some extent. Moreover, the methods of OrcaFlex and DRSWR are different, so there are some differences in the calculation results, but the difference is completely acceptable. Thus, the accuracy of the DRSWR in calculating the nonlinear dynamic response of SWR under irregular waves and TFMs meets the requirements.
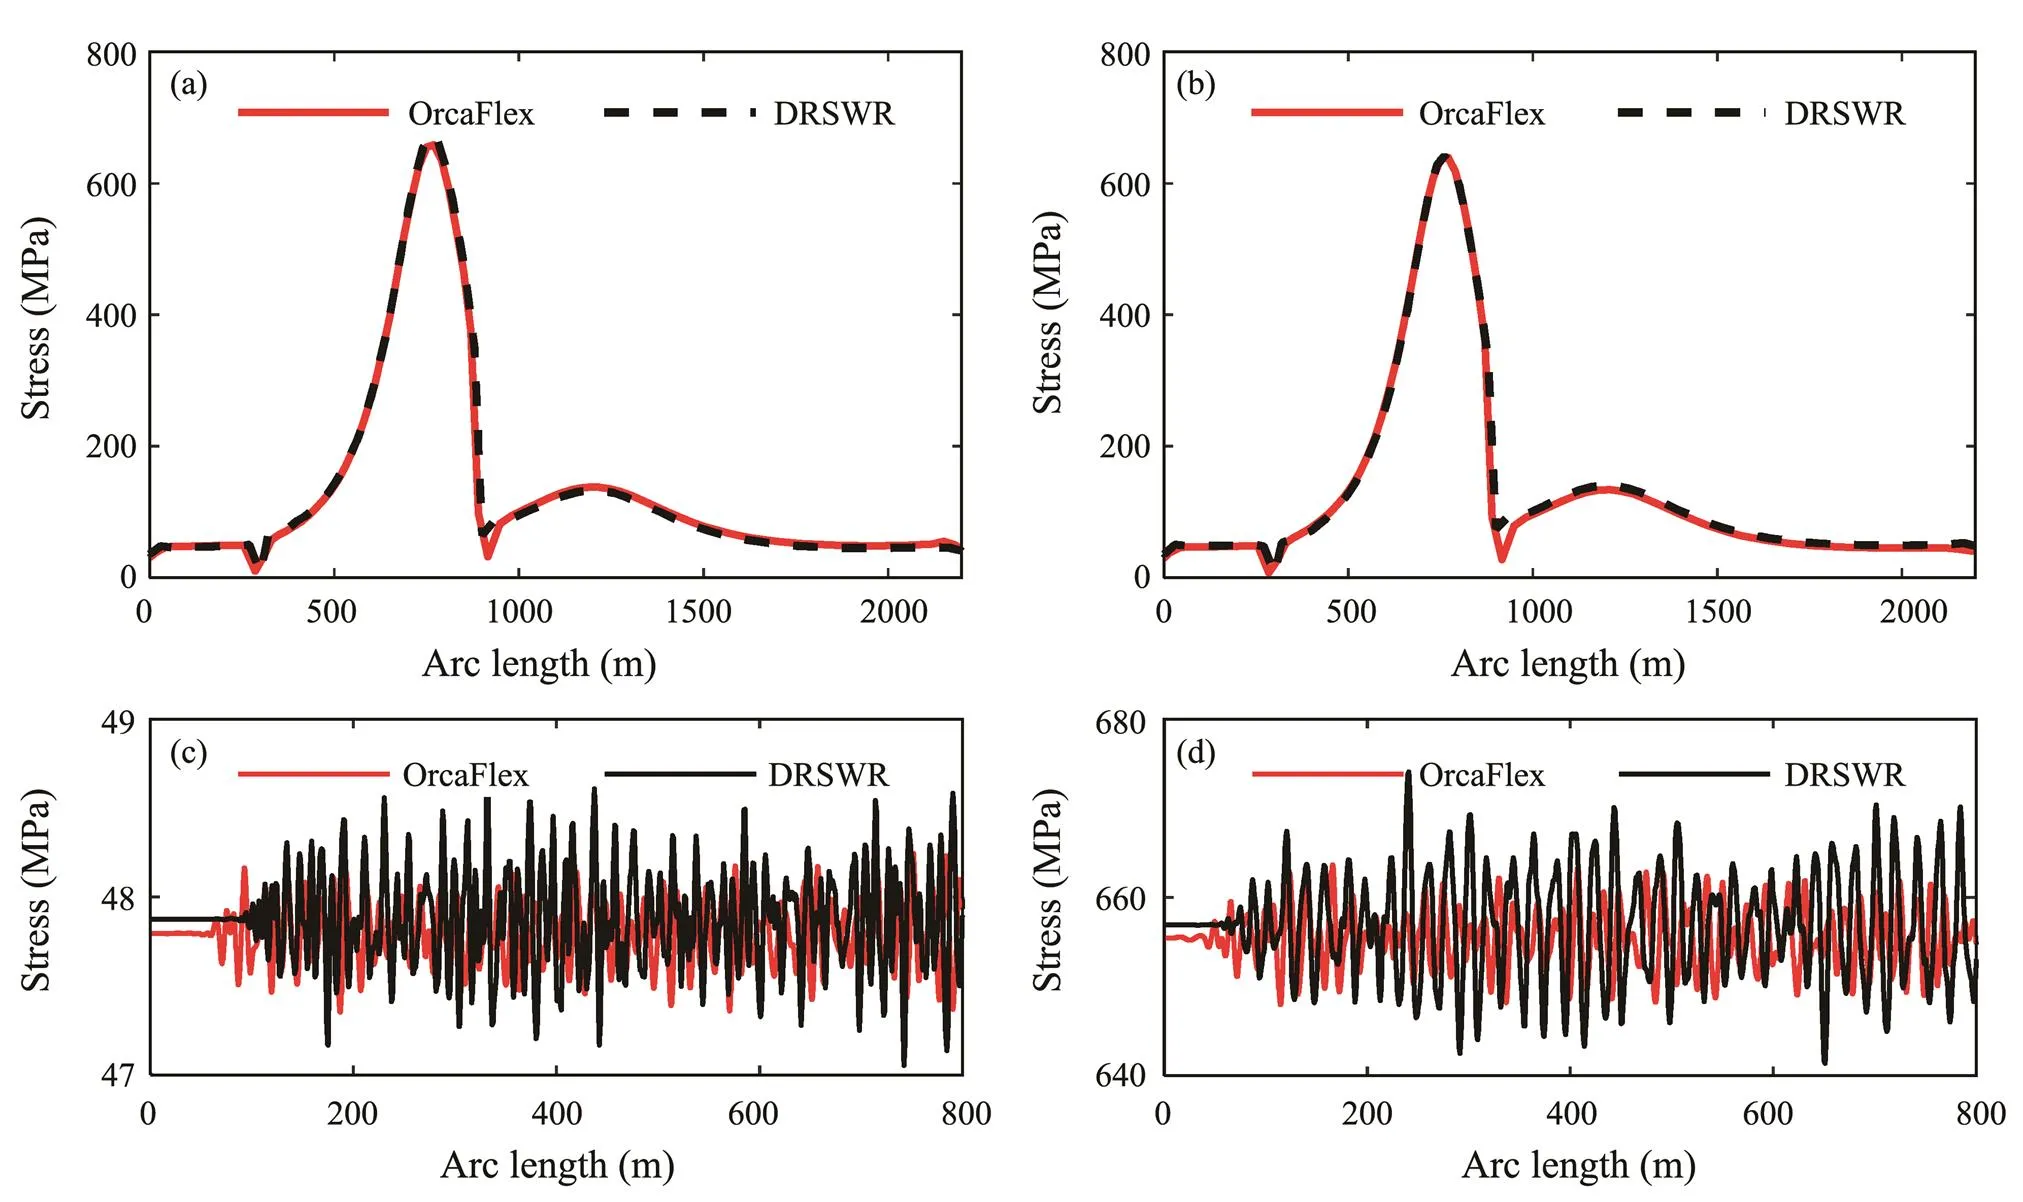
Fig.4 The calculation results of the DRSWR compared with those of OrcaFlex under the same conditions. (a), maximum stress envelope; (b), minimum stress envelope; (c), time history of the stress at 150m; (d), time history of the stress at 760m.
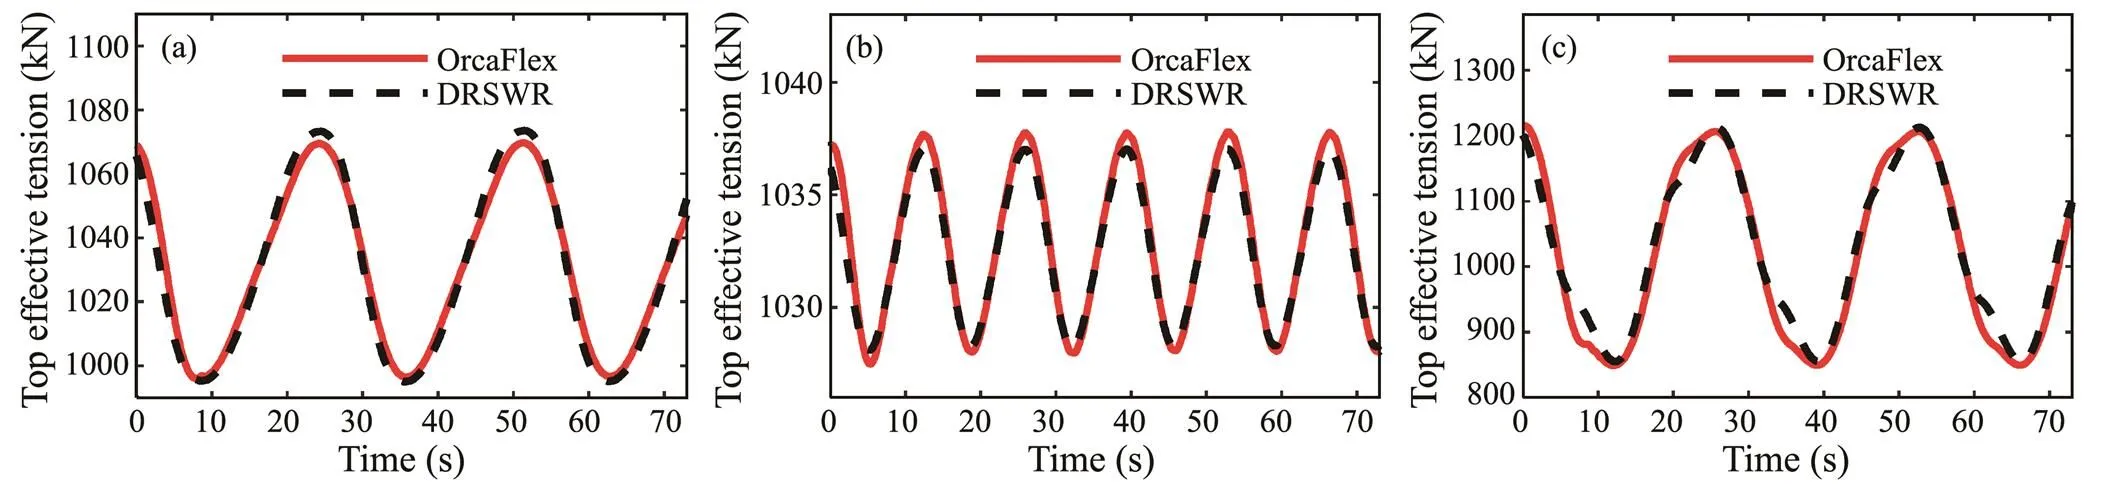
Fig.5 The calculation results compared with those of OrcaFlex. (a), Case 1; (b), Case 2; (c), Case 3.
4 Numerical Results
4.1 Nonlinear Dynamic Response Analysis of SWRs
In this section, the dynamic response of SWR under the combined excitation of irregular waves and TFMs is calculated and analyzed. The SWR parameters are shown in Table 1. The basic parameters of the environmental load condition in the analysis are as follows: significant wave heightH=6.5m, peak periodT=12.82s, top floater mean offset0=5m, single amplitude of the top floater driftS=5m, and period of the top floater driftT=200s (Li, 2010). The time history of the irregular wave elevation and TFMs simulated by the DRSWR are presented in Fig.6, where obvious randomness can be observed.
The long-term stress responses of the SWR at locations 150m (decline section), 760m (buoyancy section), and 1192.5m (hang-off section) from the TDP of SWRs and the corresponding power spectra are shown in Figs.7–8.
As can be seen from the fluctuation of the stress time- history curve in Fig.7, the stress variation ranges of the hang-off section and buoyancy section are relatively large, whereas that of the decline section is relatively small. This is mainly because the incident wave velocity decays exponentially along with the water depth and the most violent irregular wave occurs on the surface of the ocean. Moreover, the TFM is directly applied to the hang-off point. Therefore, the stress drastically changes in the hang-off section. Due to the introduction of buoyancy modules, the buoyancy section is subjected to a high hydrodynamic load, which leads to a large range of stress variation in this section. The stress amplitude of the decline section is not evident because the buoyancy section decouples the dynamic response between the TFM and decline section. In addition, the irregular wave has little effect on the decline section. The above results show that SWRs can reduce the stress variation amplitude of the TDP and improve the fatigue life of the TDP.
Fig.7 also shows that the slow drift motion of the top floater has the most significant influence on the dynamic response of the buoyancy section, followed by the hang-off section. This phenomenon disagrees with what we intuitively predicted: the TFM acts directly on the hang-off section but has the most significant effect on the buoyancy section distal to it. A possible explanation for this is that the arched configuration of the buoyancy section is more susceptible to TFM. Moreover, the TFM has the slightest influence on the decline section, which is also due to the decoupling effect of the buoyancy section.
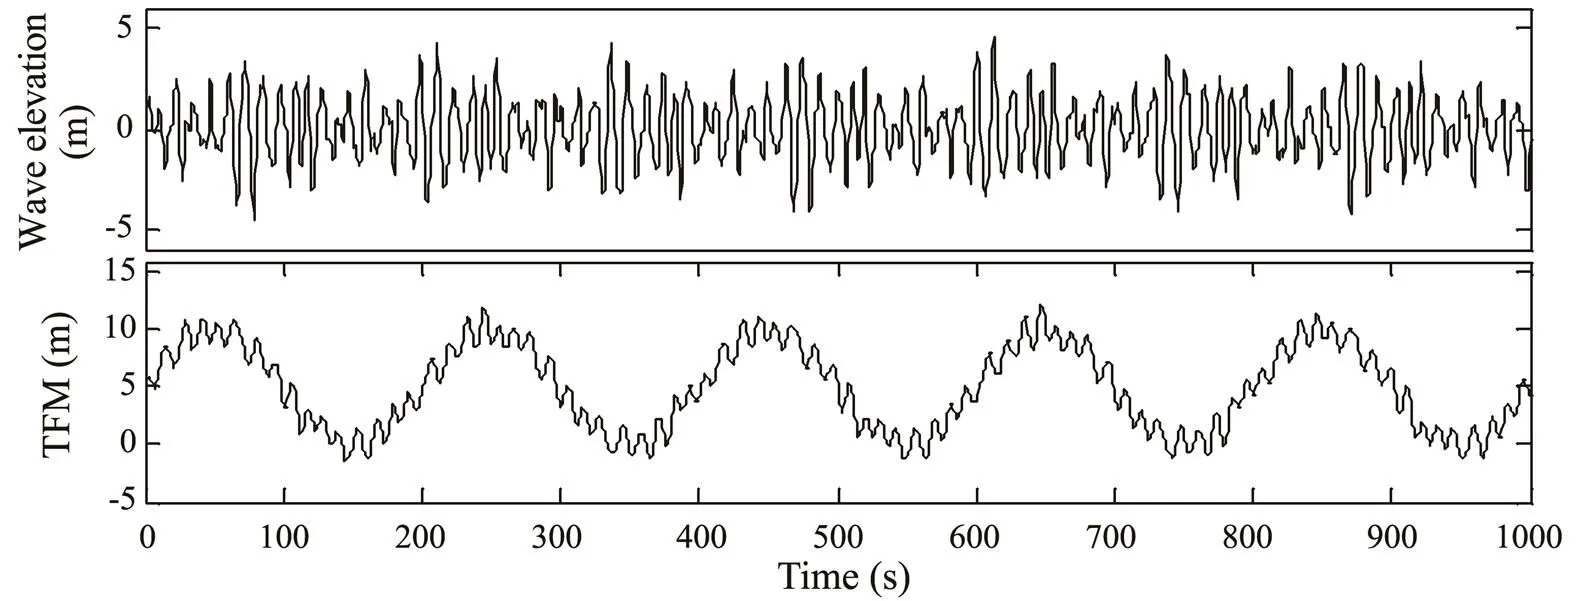
Fig.6 Time history of the wave elevation and TFM.
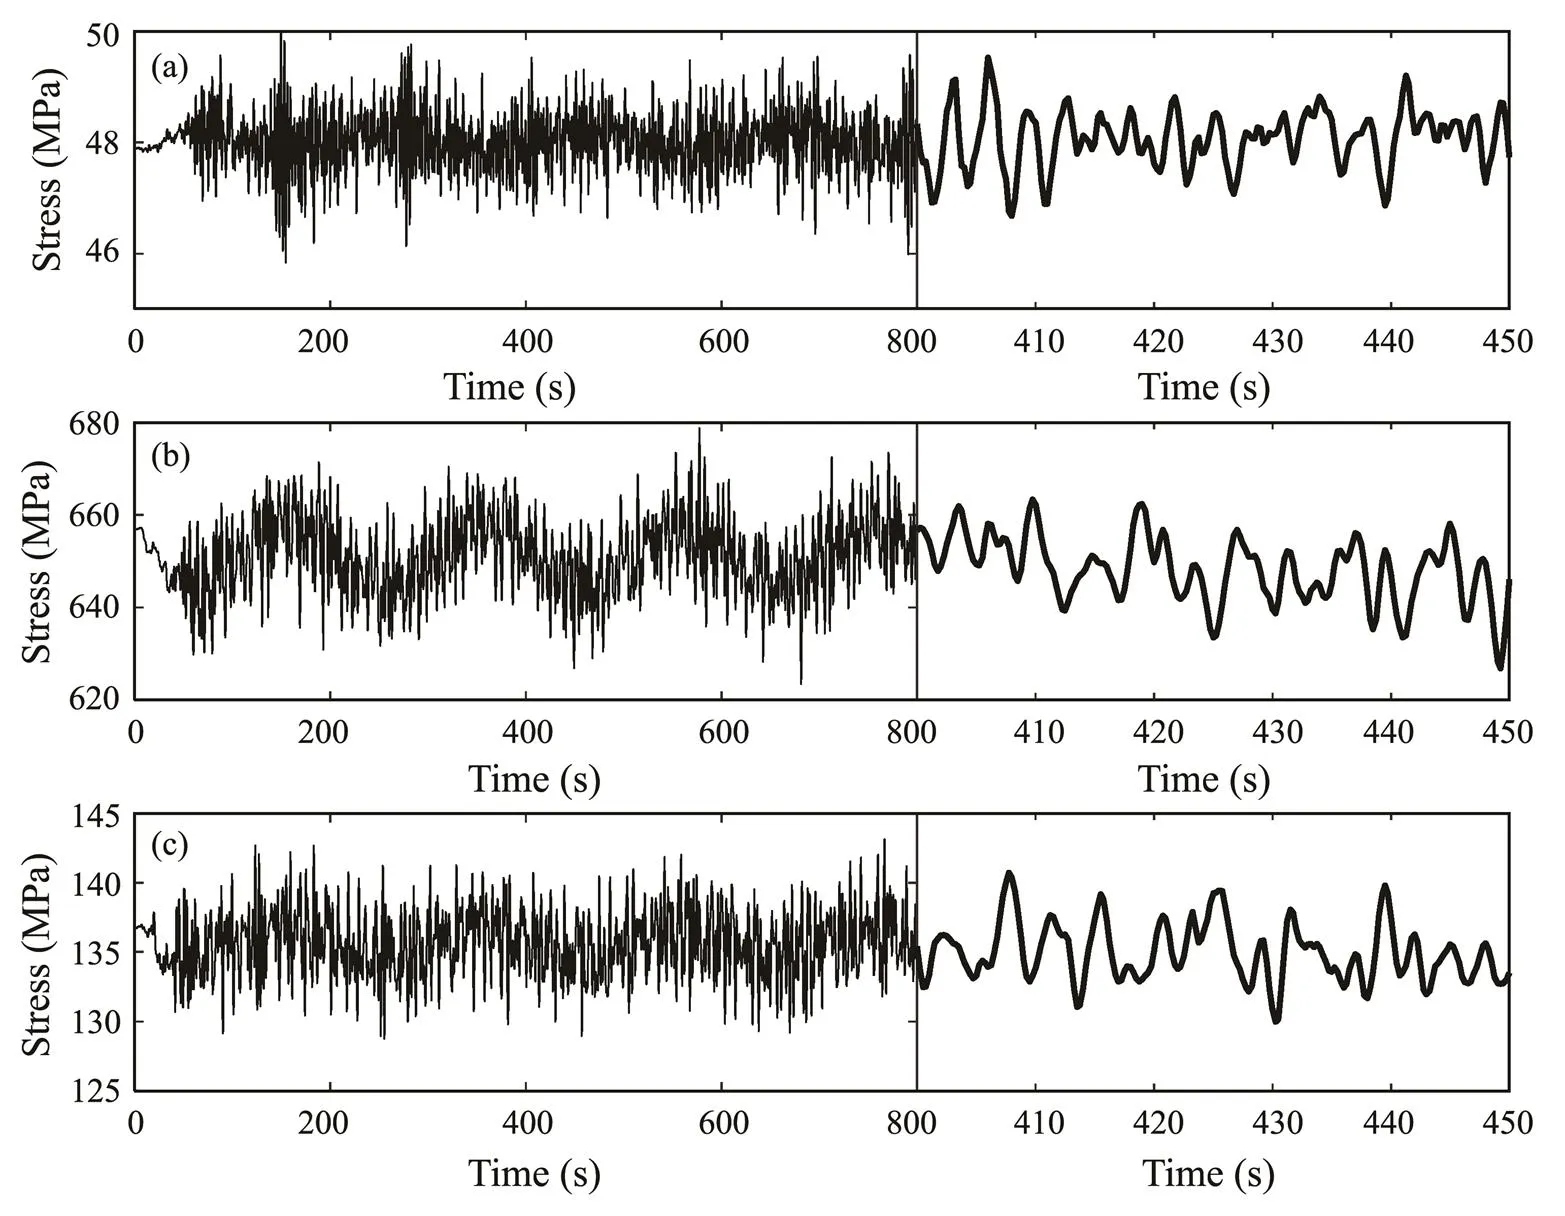
Fig.7 Time history of the SWR stresses at a location of 150m (a), 760m (b) and 1192.5m (c).
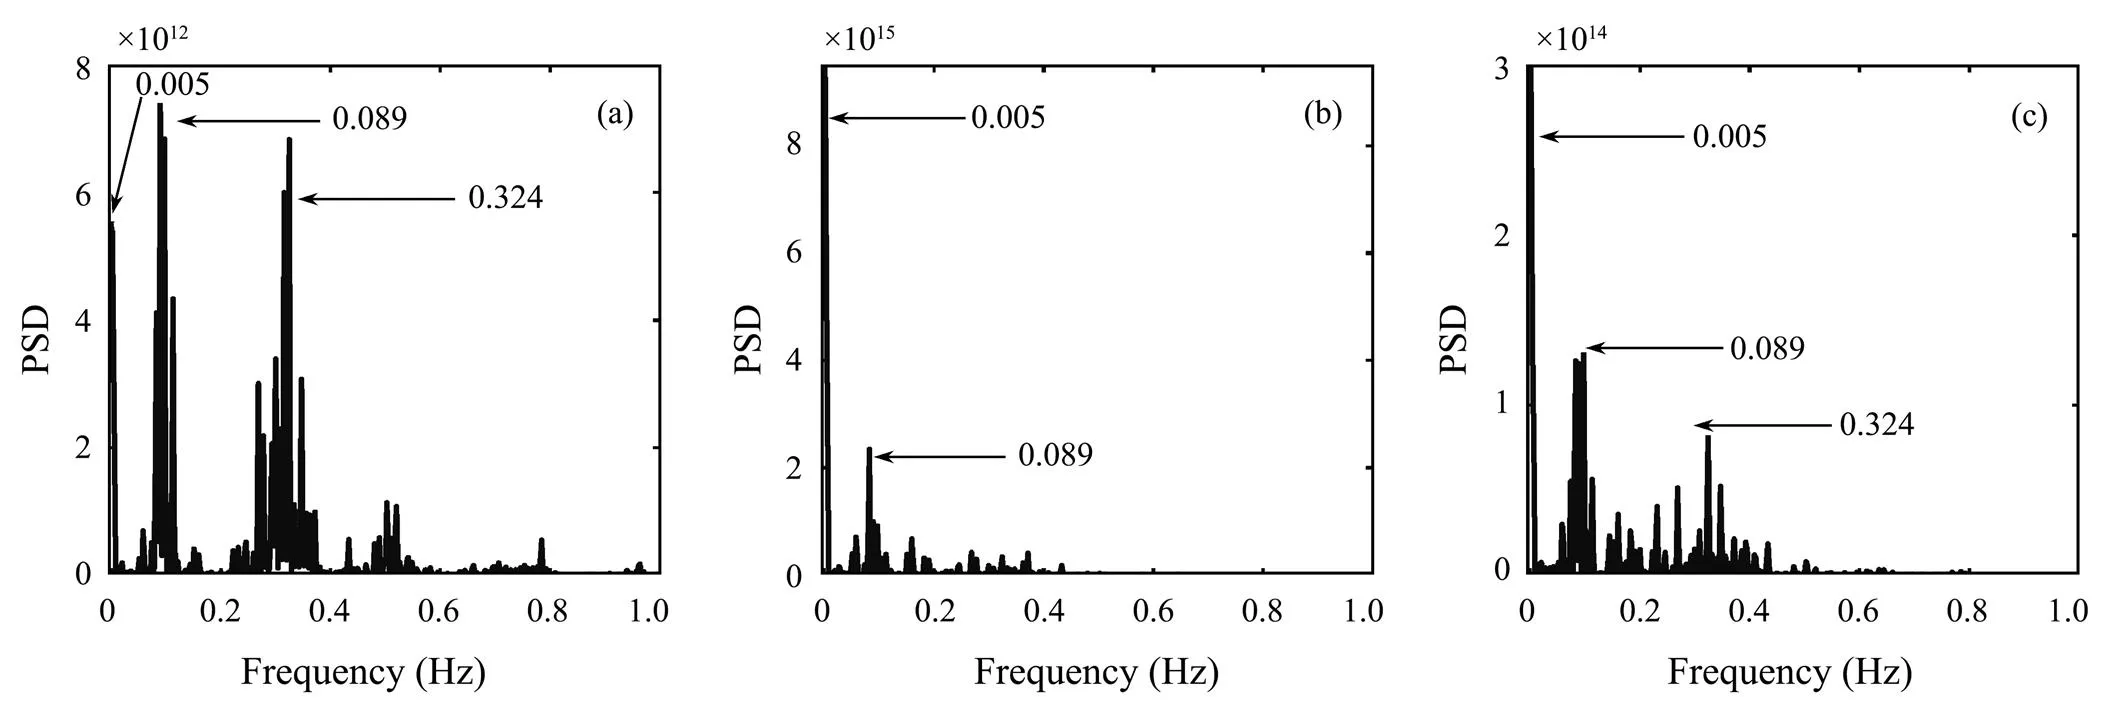
Fig.8 Power spectrum of stress at 150m (a), 760m (b) and 1192.5m (c) of the SWR.
As shown in Fig.8, a multi-frequency response is observed in each section. That is, the slow drift frequency (, 0.005Hz) and multiple frequencies (, 0.089Hz and 0.324Hz) are excited by the irregular waves. As can be seen from the values of the PSD in Fig.8, the decline section mainly vibrates at the wave frequency due to the decoupling effect of the buoyancy section. The vibration frequencies of the hang-off and buoyancy sections are both dominated by the TFM and the wave-induced frequency is less proportional. However, the hang-off section, which is closer to the sea surface, has a higher wave-frequency proportion than the buoyancy section. Based on the above frequency analysis, the influence degree of TFM on each riser section is different. This result is consistent with the analysis indicated in Fig.7. The comparison between the response frequency and SWR natural frequency is further performed. The above response frequencies (, 0.005, 0.089, and 0.324Hz) are close to the 1st (, 0.0082Hz)-, 29th (, 0.0875Hz)-, and 94th (, 0.3224Hz)-order natural frequencies of the SWR, respectively. That is, the SWR is prone to low-order and high-order resonances under the combined excitation of the TFMs and irregular waves, which further leads to an increase in the range and frequency of the stress variation and consequently to greater fatigue damage.
4.2 Fatigue Damage Study on SWRs
The fatigue damage curve of the SWRs under the combined excitation of irregular waves and TFMs is presented in Fig.9. The fatigue damage degree of the SWR is high under the irregular waves and TFMs. Therefore, the fatigue damage analysis has an important reference value to ensure that the SWRs can achieve their expected function.
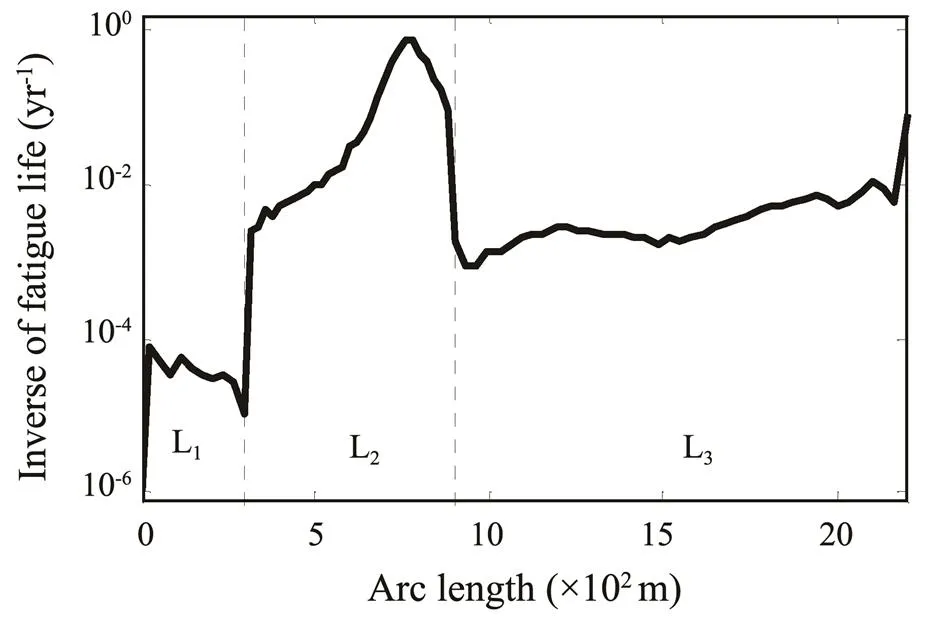
Fig.9 Fatigue damage of the SWR.
The greatest fatigue damage occurs in the buoyancy section. According to the above stress analysis, the stress level and variation amplitude of the buoyancy section are higher than those of the other riser sections. This high level of stress cycle leads to serious fatigue damage. The critical points of the fatigue damage of the SWRs are the arc bend point and hang-off point. The stress level of the hang-off point is relatively high, and it is directly affected by the irregular waves and TFMs, so the fatigue damage of this point is great. The above analysis conclusions are consistent with the fatigue damage analysis results of WRs in Li and Nguyen (2010) and Yang and Li (2011).
Particularly, the WRs can reduce the effective tension of the hang-off point and improve the adaptability to the TFM by forming a buoyancy section, but the fatigue damage of the buoyancy section greatly increases. Therefore, some trade-offs should be considered during the design process of SWRs, and some necessary fatigue reduction measures should be applied to the buoyancy section.
4.2.1 Effect of irregular waves
1) Sensitivity to the significant wave height
In this study, the environmental parameters in Section 4.1 (,H=6.5m,T=12.82s,0=5m,S=5m, andT=200s) are taken as the basic parameters. In a sensitivity analysis for a specific parameter, only the value of that parameter will be changed, and all the other parameters will be identical to the basic parameter.
Fig.10 presents the fatigue damage of the SWR for three values of significant wave heightH=6.5, 16.5, and 26.5m at a peak periodT=12.82s, wave incidence angle=0˚, and current velocity=0ms−1.
Fig.10 shows that the global fatigue damage of the SWR significantly increases with the increase inH. For every 10m increase inH, the fatigue damage increases by approximately one order of magnitude. The location of the minimum fatigue life point is mainly near the arc bend point and gradually moves to the hang-off point with the increase inH.
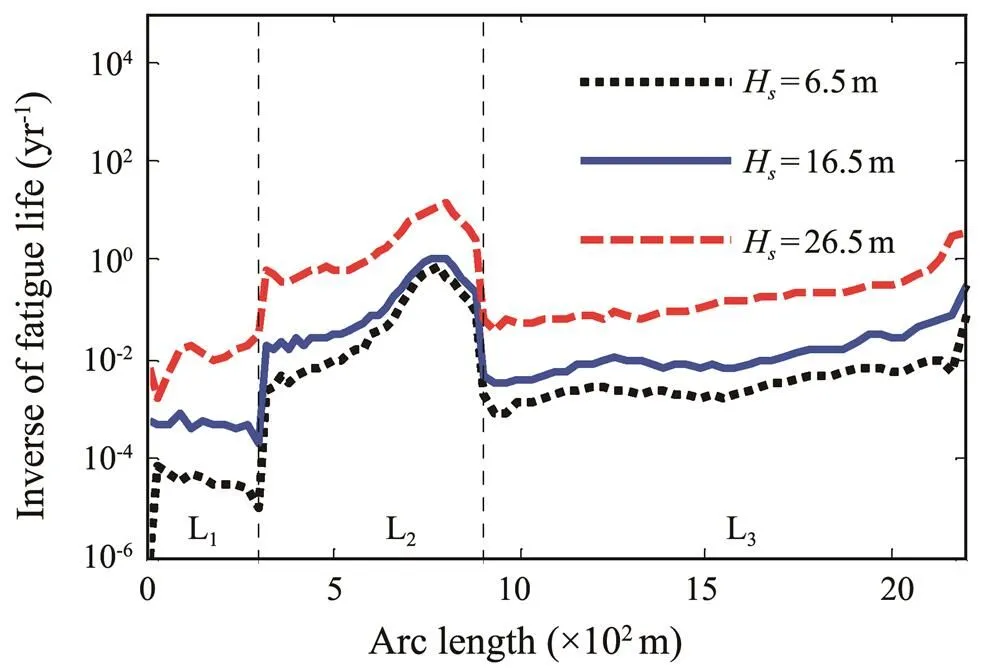
Fig.10 Fatigue damage of the SWR with the variation of Hs.
2) Sensitivity to the peak periodT
H=6.5m and other parameters are kept constant. The fatigue damage of the SWR with peak periodT=2.82, 7.82, and 12.82s are calculated. The calculation results are shown in Fig.11. The results show that the global fatigue damage of the SWR is highly sensitive to the variation ofT, and the fatigue damage level greatly decreases with the increase inT. For every 5s increase inT, the fatigue damage decreases by approximately 1–3 orders of magnitude. In addition, the fatigue life of the SWR is extremely low at a lowT, and the minimum fatigue life location is always at a location of 780m.
Based on the parameter analysis of the irregular waves, the irregular wave has a significant impact on the global fatigue damage of the SWR, and the severe wave environment will cause extremely serious fatigue damage to the SWR. Therefore, it is necessary to take wave attenuation measures for the SWR during the in-service period in actual engineering.
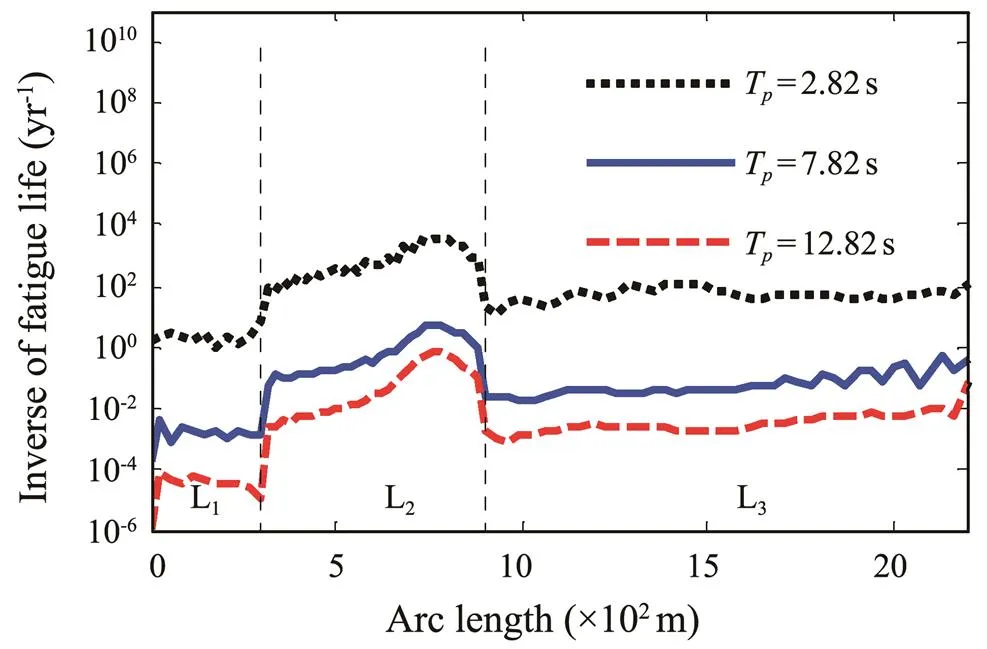
Fig.11 Fatigue damage of the SWR with the variation of Tp.
4.2.2 Effect of the TFM
1) Sensitivity to the top floater mean offset0
Fig.12 presents the fatigue damage of the SWR for three different mean offsets0,, 5, 55, and 105m. The fatigue damage of the SWR increases with the increase in0. For every 50m increase in0, the fatigue damage increases by approximately one order of magnitude. The fatigue damage of the hang-off section is most easily affected by this parameter, especially near the hang-off point. The main reason is that the stress level of the hang-off section mainly depends on the effective tension level. The increase in0leads to a significant increase in the tension of the hang-off section. Accordingly, the stress level of this section rapidly increases and then induces great fatigue damage.
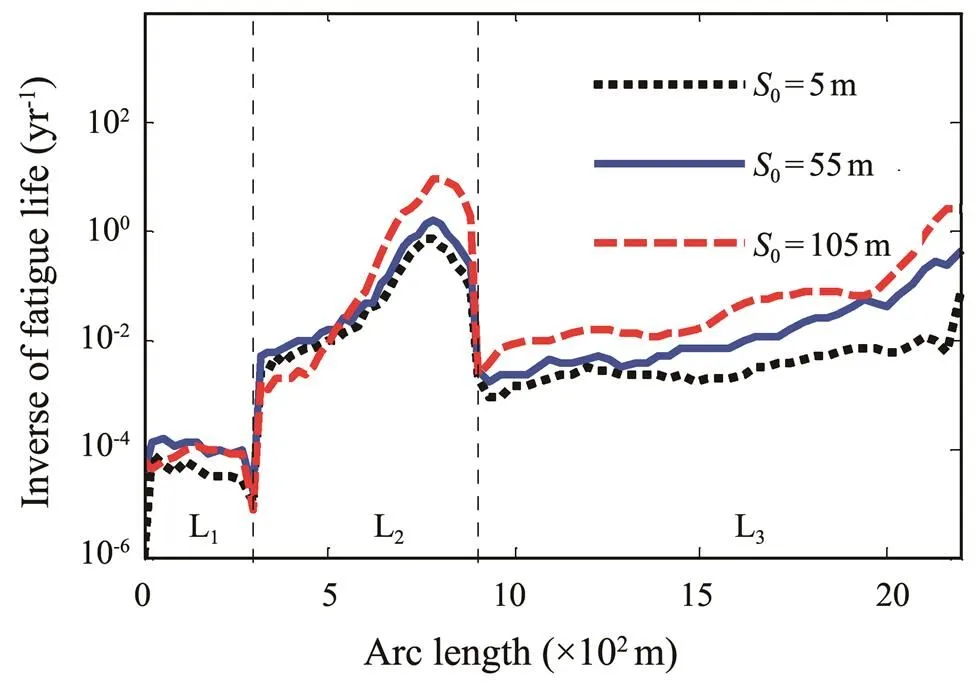
Fig.12 Fatigue damage of the SWR with the variation of S0.
2) Sensitivity to low-frequency TFMs
With other parameters unchanged, the fatigue damage of SWRs under different low-frequency TFMs is obtained. The results are shown in Figs.13–14. The three different low-frequency motion amplitudesS=5, 20, and 35m and periods T=100, 150, and 200s are selected. Essentially, the increase inSand decrease inTwill aggravate the fatigue damage of the SWR. Each 15m increase inSor 50s decrease inTcauses an increase in fatigue damage of approximately one order of magnitude. Moreover, compared with other sections, the hang-off section is more sensitive to low-frequency TFMs. With the increase inSand decrease inT, the minimum fatigue location is transferred from the arc bend point to the hang-off point, which is mainly due to the direct contact between the hang-off point and top floater. Accordingly, a high stress cycle and fatigue damage level are induced by the violent TFM.
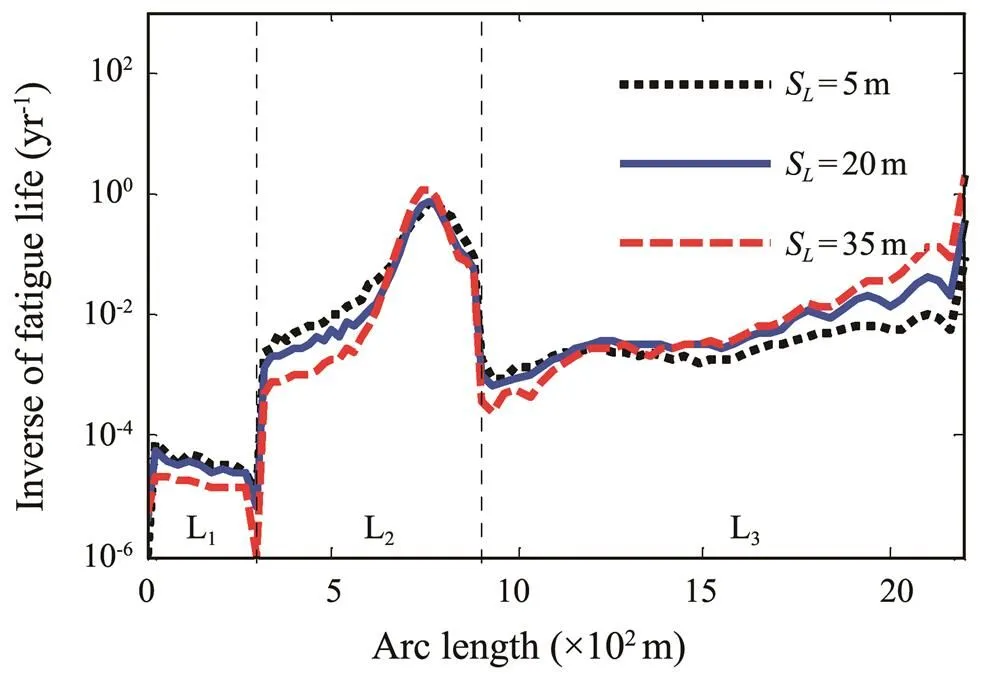
Fig.13 Fatigue damage of the SWR with the variation of SL.
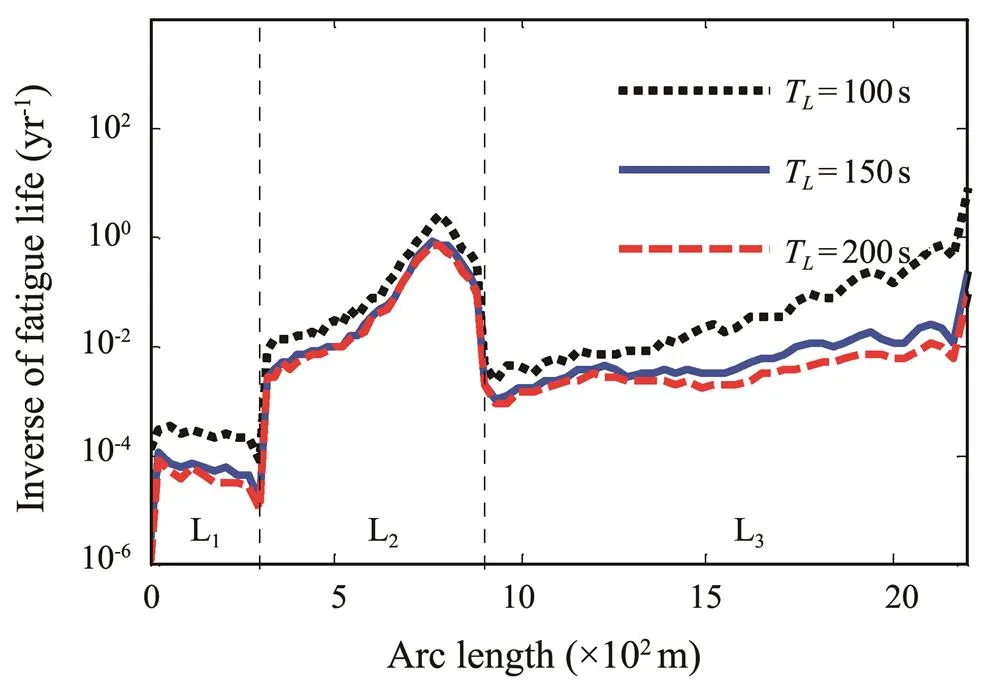
Fig.14 Fatigue damage of the SWR with the variation of TL.
The above parameter analysis results show that TFMs mainly affect the fatigue damage of the hang-off section. Moreover, the sensitivity of the SWRs to the irregular wave variation is much higher than that of the TFMs, which further indicates that the SWRs have excellent adaptability to the TFMs.
4.2.3 Effect of the internal flow
Figs.15–16 present the fatigue damage of SWRs for different internal flow velocities and densities. The three different internal flow densities of 0, 800, and 998kgm−3and internal flow velocities of 0, 15, and 30ms−1at an internal flow density=800kgm−3are selected.
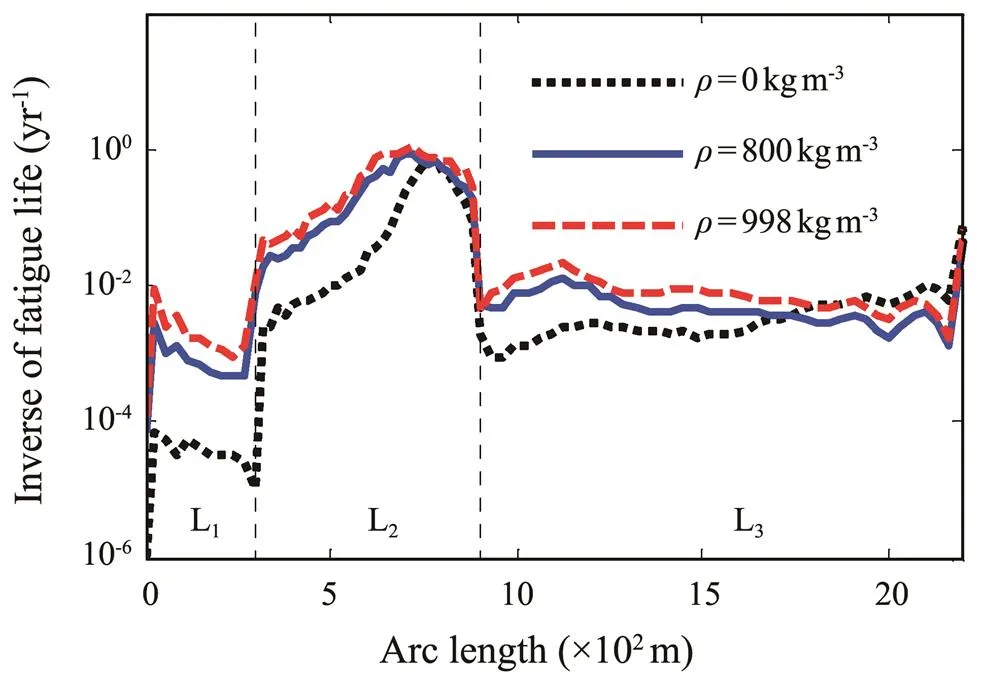
Fig.15 Fatigue damage of the SWR with the variation of the internal flow density.
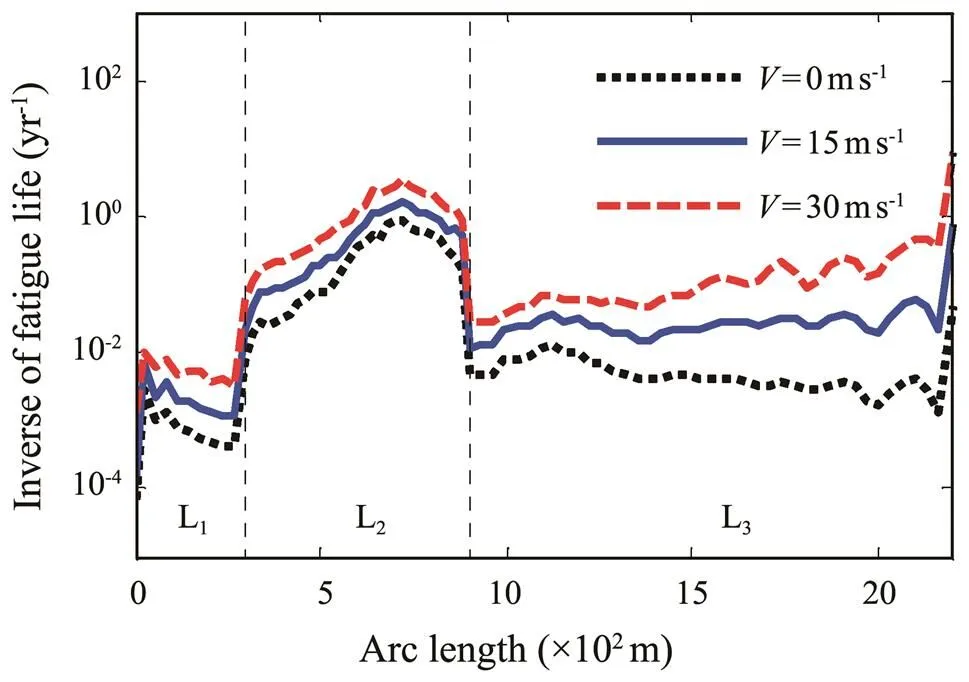
Fig.16 Fatigue damage of the SWR with the variation of the internal flow velocity.
The results show that the fatigue damage of the SWR gradually increases with the increase in the internal flow density and velocity, which is consistent with the analysis conclusions of WR in Yang and Li (2011). For every 15ms−1increase in internal flow velocity, the fatigue damage increases by approximately one order of magnitude. The variation of the internal flow density has a significant influence on the fatigue damage near the TDP, arc bend point,and sag bend point. The main reason is that with the variation of the internal flow density, the global configuration of the SWR significantly changes, which leads to a significant change in the curvature of these points. Meanwhile, the variation of the internal flow velocity only has a significant impact on the hang-off point. In addition, the minimum life point of SWRs is always located in the buoyancy section and moves toward the hang-off point with the increase in internal flow density and velocity.
Based on the above analysis of the internal flow, the internal flow has a great impact on the fatigue damage of SWRs, and the internal flow with high density and velocity will cause serious fatigue damage. However, the influence of the internal flow is seldom considered in the current research on SWRs, and corresponding protection measures should be taken according to the internal transport medium of SWRs during the design stage.
As mentioned earlier, the buoyancy section is the fatigue risk region of the SWR, therefore, it is necessary to perform sensitivity analysis on the primary parameters of this section.
4.2.4 Effect of the buoyancy section
1) Sensitivity to the buoyancy section length
As shown in Fig.17, different SWR buoyancy section lengths are investigated, and the buoyancy section lengths2used in the numerical simulation are 550, 600, and 650m.
The results show that the fatigue damage of the SWR is relatively sensitive to the variation of2. The increase in2leads to the aggravation of the fatigue damage of the SWR. For every 50m increase in2, the fatigue damage increases by approximately one order of magnitude. In addition, with the increase in2, the minimum fatigue life location is always near the arc bend point and moves toward the hang-off point, which is mainly attributed to the change in the global configuration of the SWR due to the increase in2, resulting in the arc bend point moving toward the hang-off point.
2) Sensitivity to the buoyancy factor
is defined as the wet weight per unit length of the hang-off section and decline section, andWis the wet weight per unit length of the buoyancy section and buoyancy factor−W/.
When buoyancy factor=1.5, 2.0, and 2.5, the fatigue damage of the SWR is calculated. The results are shown in Fig.18, where the minimum fatigue life of the SWR decreases with the increase in the buoyancy factor. The fatigue damage of the buoyancy section shows a high sensitivity to the variation of the buoyancy factor. The increase in the buoyancy factor will reduce the fatigue life at the arc bend point, mainly because the larger buoyancy factor will lead to the steeper global configuration of the SWR, which means greater curvature and higher bending stress level at the arc bend point. Moreover, with the increase in the buoyancy factor, the minimum fatigue life location is always at the arc bend point.
Although research (Sun and Qi, 2011; Qiao, 2016a) has demonstrated that the increase in the buoyancy section length and buoyancy factor can reduce the effective tension of the hang-off point. According to the above parameter analysis, they can, however, also lead to an increasein the SWR fatigue damage. Thus, the two parameters should be designed in detail.
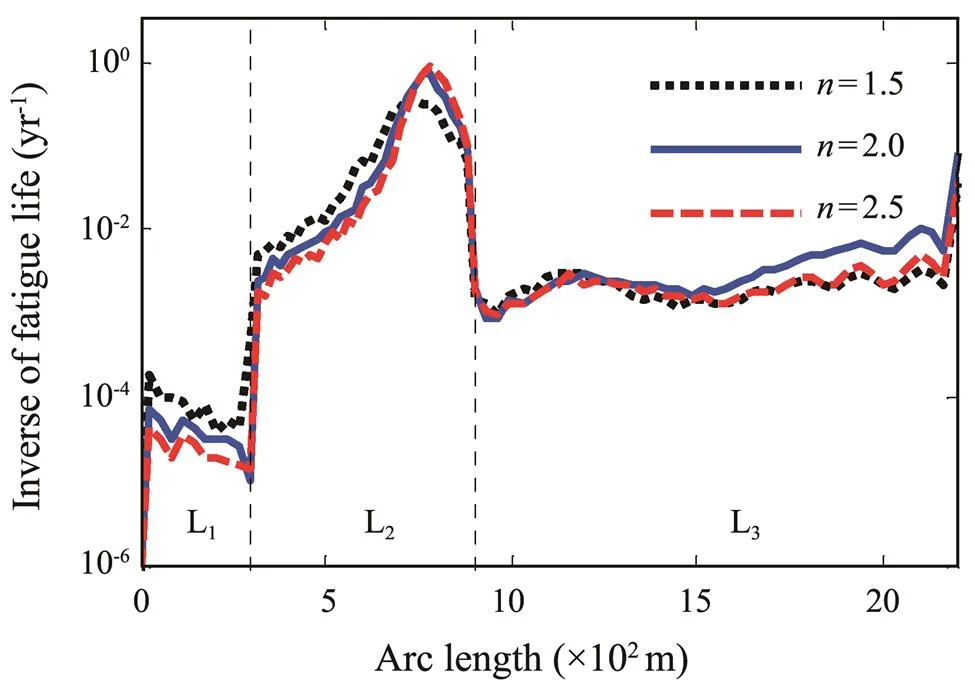
Fig.18 Fatigue damage of the SWR with the variation of n.
5 Conclusions
Based on the slender rod model and FEM, the nonlinear dynamic analysis model of the SWR is established in this study, which can give full consideration to the geometric nonlinearity and internal flow nonlinear coupling of SWRs. The Newmark-method is adopted to solve the dynamic behavior. Moreover, the Palmgren-Miner rule, a specified-curve, and rainflow counting method are applied to estimate the fatigue damage. Based on these, a calculation process, DRSWR, is programmed with MAT- LAB. In this study, the nonlinear dynamic response and fatigue damage of SWR under the combination of irregular waves, TFMs, and internal flows is calculated and analyzed. Moreover, the effect of irregular waves (significant wave height and peak period), TFMs (top floater mean offset and low-frequency TFM), and buoyancy section (buoyancy section length and buoyancy factor) on the fatigue damage of SWRs are investigated, and the following conclusions are obtained.
1) Under the combination of irregular waves and TFMs, the dynamic response of each section of the SWR exhibits multi-frequency characteristics (, slow drift frequency and multiple frequencies excited by irregular waves). The effect of irregular waves on the sections of SWRs gradually decreases along the water depth. As for TFMs, they act directly on the hang-off section but have the most significant effect on the buoyancy section distal to it.
2) The buoyancy section of SWRs has the highest global stress level, stress variation amplitude, and fatigue damage. The peak point of stress is located at the arc bend point and sag bend point, and the critical points of fatigue damage are mainly concentrated in the arc bend point and hang-off point.
3) The global fatigue damage of SWRs presents a high sensitivity to the variation of the irregular wave, and the increase in the significant wave height and decrease in the peak period increase the global fatigue damage of SWRs. For every 10m increase inH, the fatigue damage increases by approximately one order of magnitude. Moreover, for every 5s increase inT, the fatigue damage decreases by approximately 1–3 orders of magnitude. Thus, severe irregular waves tend to cause severe fatigue damage, and it is essential to take wave attenuation measures at the sea surface in practical engineering.
4) The sensitivity of SWRs to TFMs is significantly lower than that of irregular waves. In addition, the influence of the top floater mean offset on the SWR is greater than that of low-frequency TFMs. The maximum fatigue damage of SWRs increases with the increase in the top floater mean offset. The low-frequency TFM with large amplitude and low period can increase the fatigue damage of SWRs and transfer the critical point from the buoyancy section to the hang-off point. Each 50m increase in0, 15m increase inS, or 50s decrease inTcauses an increase in the fatigue damage of approximately one order of magnitude.
5) The internal flow with high density and velocity will produce high-level fatigue damage, and the increase in the internal flow velocity will transfer the minimum fatigue life point from the buoyancy section to the hang-off point. For every 15ms−1increase in the internal flow velocity, the fatigue damage increases by approximately one order of magnitude. Therefore, attention should be paid to the internal flow during the SWR service.
6) The increase in the buoyancy section length and buoyancy factor will lead to an increase in the SWR fatigue damage. For every 50m increase in2, the fatigue damage increases by approximately one order of magnitude. In addition, the increase in the buoyancy section length will move the minimum fatigue life point toward the hang-off point. In practice, the top tension can be significantly reduced by increasing the two parameters, and the serious fatigue damage they produce should be noted.
Acknowledgements
The study is supported by the Natural Science Foundation of Shandong Province (Nos. ZR2019MEE032 and ZR2020ME261), the National Natural Science Foundation of China (Nos. U2006226 and 51979257), and the Shandong Provincial Key Laboratory of Ocean Engineering (No. kloe202002).
Anzai, H., and Endo, T., 1979. On-site indication of fatigue dam- age under complex loading., 1 (1): 49-57.
Bai, X. L., Huang, W. P., Vaz, M. A., Yang, C., and Duan, M., 2015. Riser-soil interaction model effects on the dynamic be- havior of a steel catenary riser., 41: 53-76.
Bai, Y., and Bai, Q., 2014.. Elsevier, Amsterdam, 401-413.
Borgman, L. E., 1969. Ocean wave simulation for engineering design., 95 (4): 557-583.
Cheng, Y., Tang, L., and Fan, T., 2020. Dynamic analysis of deepwater steel lazy wave riser with internal flow and seabed interaction using a nonlinear finite element method., 209: 107498.
DNV, 2007. Environmental conditions and environmental loads.. Det Norske Veritas, 31-37.
DNV, 2005. Riser fatigue.. Det Norske Veritas, 19-25.
DNV, 2008. Fatiguedesign of offshore steel structures.Det Norske Veritas, 12-17.
Elosta, H., Shan, H., and Incecik, A., 2013. Dynamic response of steel catenary riser using a seabed interaction under ran- dom loads., 69: 34-43.
Fu, J. J., and Yang, H. Z., 2010. Fatigue characteristic analysis of deepwater steel catenary risers at the touchdown point., 24 (2): 291-304.
Garrett, D. L., 1982. Dynamic analysis of slender rods., 104 (4): 302-306.
Kim, S., and Kim, M.-H., 2015. Dynamic behaviors of conven- tional SCR and lazy-wave SCR for FPSOs in deepwater., 106: 396-414.
Kim, S., Kim, M.-H., Shim, S., and Im, S., 2015. Structural performance of deepwater lazy-wave steel catenary risers for FPSOs.. Busan, Korea, ISOPE-I-14-224:8.
Kirk, C. L., and Etok, E. U., 1979. Wave induced random oscil- lations of pipelines during laying., 1 (1): 51-60.
Larsen, C. M., 1992. Flexible riser analysis–Comparison of results from computer programs., 5 (2-3): 103-119.
Li, S. C., and Nguyen, C., 2010. Dynamic response of deepwater lazy-wave catenary riser.. Amsterdam, Netherlands.页码?
Li, X. M., Guo, H. Y., and Meng, F. S., 2010. Stress analysis of top tensioned riser under random waves and vessel motions., 9 (3): 251-256.
Liu, Z., and Guo, H. Y., 2018. Sensitivity analysis of steep wave riser with internal flow., 26 (4): 541-551.
Liu, Z., and Guo, H. Y., 2019. Dynamic response study of steel catenary riser based on slender rod model., 33 (1): 57-64.
Païdoussis, M., 2004.. Academic Press, California, 196-276.
Qiao, H. D., Ruan, W. D., Shang, Z. H., and Bai, Y., 2016. Non-linear static analysis of 2D steep wave riser under current load.. Busan, Korea, OMAE2016-54460, V005T04A052, 9pp.
Ruan, W. D., Bai, Y., and Cheng, P., 2014. Static analysis of deepwater lazy-wave umbilical on elastic seabed., 91: 73-83.
Ruan, W. D., Liu, S. H., Li, Y. Y., Bai, Y., and Yuan, S., 2016. Nonlinear dynamic analysis of deepwater steel lazy wave riser subjected to imposed top-end excitations.. Busan, Korea, OMAE2016-54111, V005T04A046, 8pp.
Santillan, S. T., Virgin, L. N., and Plaut, R. H., 2010. Static and dynamic behavior of highly deformed risers and pipelines., 132 (2): 021401.
Sexton, R. M., and Agbezuge, L. K., 1976. Random wave and vessel motion effects on drilling riser dynamics.. Houston, Texas, OTC-2650-MS.
Sun, L. P., and Qi, B., 2011. Global analysis of a flexible riser., 10 (4): 478-484.
Wang, J. L., Duan, M. L., and He, R. Y., 2018. A nonlinear dy- namic model for 2D deepwater steel lazy-wave riser subjected to top-end imposed excitations., 13 (3): 330-342.
Wang, J. L., Duan, M. L., He, T., and Jing, C., 2014. Numerical solutions for nonlinear large deformation behaviour of deep- water steel lazy-wave riser., 9 (6): 655-668.
Wang, L. Z., Yuan, F., Guo, Z., and Li, L. L., 2012. Analytical prediction of pipeline behaviors in J-lay on plastic seabed., 138 (2): 77-85.
Wu, M., and Huang, K., 2007. The comparison of various SCR configurations for bow turret moored FPSO in West Africa.. Lisbon, Portugal, ISOPE-I-07-054.
Yang, H. Z., and Li, H. J., 2011. Sensitivity analysis of fatigue life prediction for deepwater steel lazy wave catenary risers., 54 (7): 1881-1887.
(Oceanic and Coastal Sea Research)
https://doi.org/10.1007/s11802-022-4850-4
ISSN 1672-5182, 2022 21 (3): 669-680
(November 24, 2020;
July 25, 2021;
September 7, 2021)
© Ocean University of China, Science Press and Springer-Verlag GmbH Germany 2022
Corresponding author. E-mail: lxm0318@ouc.edu.cn
(Edited by Xie Jun)
猜你喜欢
数学大王·趣味逻辑(2020年11期)2020-11-19
特种油气藏(2020年6期)2020-01-05
无锡职业技术学院学报(2019年4期)2019-12-27
孩子(2019年11期)2019-11-20
孩子(2019年8期)2019-08-26
孩子(2019年1期)2019-01-23
中央民族大学学报(自然科学版)(2017年4期)2017-06-11
电脑知识与技术·经验技巧(2016年4期)2016-05-30
家庭用药(2016年4期)2016-04-23
棋艺(2014年2期)2014-05-23
 Journal of Ocean University of China2022年3期
- Journal of Ocean University of China的其它文章
- Effect of Intertidal Elevation at Tsuyazaki Cove, Fukuoka,Japan on Survival Rate of Horseshoe Crab Tachypleus tridentatusEggs
- Asian Horseshoe Crab Bycatch in Intertidal Zones of the Northern Beibu Gulf: Suggestions for Conservation Management
- Experimental Investigation on the Interactions Between Dam-Break Flow and a Floating Box
- Variational Solution of Coral Reef Stability Due to Horizontal Wave Loading
- High Microplastic Contamination in Juvenile Tri-Spine Horseshoe Crabs: A Baseline Study of Nursery Habitats in Northern Beibu Gulf, China
- Influence of Autonomous Sailboat Dual-Wing Sail Interaction on Lift Coefficients