
Influence of Autonomous Sailboat Dual-Wing Sail Interaction on Lift Coefficients
2022-06-14 04:09SUNZhaoyangHUFengYUJianchengZHAOWentaoandZHANGAiqun
SUN Zhaoyang, HU Feng, YU Jiancheng, *, ZHAO Wentao, and ZHANG Aiqun
Influence of Autonomous Sailboat Dual-Wing Sail Interaction on Lift Coefficients
SUN Zhaoyang1), 2), 3), HU Feng1), 2), YU Jiancheng1), 2), *, ZHAO Wentao4), and ZHANG Aiqun1)
1) State Key Laboratory of Robotics, Shenyang Institute of Automation, Chinese Academy of Sciences, Shenyang110016, China 2) Institutes for Robotics and Intelligent Manufacturing, Chinese Academy of Sciences, Shenyang110169, China 3) University of Chinese Academy of Sciences, Beijing 100049, China 4) Shenyang Institute of Automation(Guangzhou), Chinese Academy of Sciences, Guangzhou 511458, China
To analyze the influence of the chord length ratio and angle of attack on lift coefficients and explore the interaction mechanism between the two, we established a calculation model of the pressure distribution coefficient on the airfoil surface and lift coefficient of a dual-wing sail on the basis of the vortex panel method. Computational fluid dynamics was used in auxiliary calculation and analysis. Results revealed a reciprocal interference between the front-wing and rear-wing sails. The total lift coefficient of the dual-sail increased with an increase in the front sail chord length. The lift coefficient of the rear sail decreased with an increase in the front sail chord length or angle of attack. The front sail wake affected the pressure distribution on the upper and lower surfaces of the rear sail leading edge.
autonomous sailboat; dual-sail; rigid wing sail; lift coefficients; vortex panel method
1 Introduction
Autonomous sailboats can use wind as the driving force to achieve large-scale and long-term navigation, which offers opportunities for observing environmental elements at the air-sea interface (Cokelet, 2016; Yu, 2018a). The key component of autonomous sailboats is the sail, which directly converts wind energy into a driving force (Ma, 2018; Silva, 2019a). Sails can be classified into traditional soft sails and rigid-wing sails on the basis of their structure and into balanced and unbalanced sails from a functional aspect. Wing sails have a larger lift-drag ratio and lift coefficient than traditional soft sails. Wing sails are a type of balanced sail, and they have been widely used in autonomous sailboats because of their excellent shape stability, simple aerodynamic characteristics, and easy automatic control (Yu, 2018b; Silva, 2019b).
The force situation of the sailboat onthe-plane is shown in Fig.1 (Fossati, 2009). The sail provides propulsion, heeling force (F, can be divided into lateral forceLATand vertical forceVERT), and heeling moment. The heeling moment increases the wetted surface and navigation resistance when a ship is in heel. The heel is counteracted by the righting moment produced by the boat weightapplied to the center of gravity and by the buoyancy forceacting on the center of buoyancy (Buhler, 2018). Although increasing the depth or weight of the keel is useful in providing a large restoring moment, such a method also indirectly increases the navigation resistance.
Another method for reducing the heeling moment is to use two sails instead of one, as illustrated in Fig.2 (Domin- guez-Brito, 2016). A dual-wing sail provides propulsion through the two sails. This propulsion is equivalent to splitting the force on a single sail into two. Thus, the force on each sail and the height of the wind action point on the sail are reduced. The center of effect (CE) shown in Fig.2 represents the center point of the pressure generated by the sail; it is also known as the center point of air pressure. Reducing the height of the wind action point shortens the heeling force arm, thereby effectively reducing the ship heeling (caused by the wind on the sails) and sailing resistance. The autonomous sailboats(Domin- guez, 2016) and(https://openoceanrobotics.com/force12xplorer/) adopt a dual-sail design scheme. Some researchers have also proposed right-left-symmetry wing sails on catamarans (Deng, 2019).
However, mutual interference between two sails occurs in a dual-sail propulsion system. In particular, the rear sail is easily affected by the wake flow of the front sail. As the wing sail adopts an aircraft wing design, ideas for aircraft tandem wings can also be used in the correlation analysis of dual-wing sails. The lift coefficient of the airfoil is an important evaluation index in the performance evaluation of an autonomous sailboat. The main factors affecting the lift coefficient are the stagger, angle of attack, and chord length ratio of the front and rear sails. The methods for calculating the lift coefficient of the airfoil include computational fluid dynamics (CFD) (Zhu, 2016; Atkinson, 2019), experimental tests (Zeng and Zhang, 2018; Souppez, 2019), and numerical calculations. Scharpf and Mueller (1992) analyzed the aerodynamic performance of close-range tandem wings by using a two-dimensional (2D) wind tunnel test with a low Reynolds number. Rokhsaz and Selberg(1986) analyzed the aerodynamic efficiency of a tandem wing by using a numerical method. Abdellatif and Gawad(2000) studied the influence of front wing on rear wing by using vortex panels and experimental methods. In the preliminary design of a wing sail, the lift coefficient of a 2D model is equal to that of a three- dimensional (3D) model. Furthermore, 2D airfoil models exclude the influence of spanwise flow on airfoil systems and are thus suitable for analyzing the influence of stagger and angle of attack variations on front and rear wing airfoil systems (Cai, 2019). In the numerical calculation of the lift coefficient of a 2D airfoil, one of the mature methods used is the panel method (Liu, 2018), which includes the source panel and vortex panel methods (Anderson Jr., 2010). On the basis of the vortex panel method, this article analyzes the influence of front and rear sail chord length ratios and angle of attack on the total lift coefficient, as well as the causes of the corresponding impacts. The article is structured as follows. Section 2 presents the analysis model. On the basis of this model, Section 3 describes the influence of the front sail chord length on the lift coefficient at a certain angle of attack. Section 4 introduces the influence of the angle of attack on the lift coefficient. Finally, Section 5 summarizes the findings.
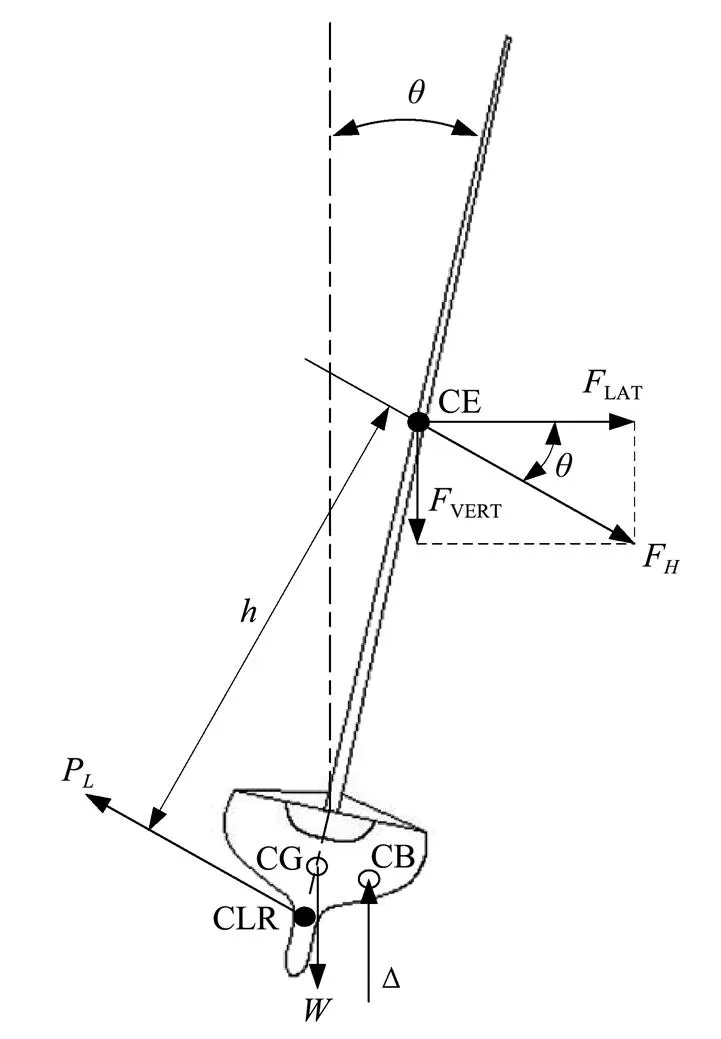
Fig.1 Force situation on the Y-Z plane of a sailboat.
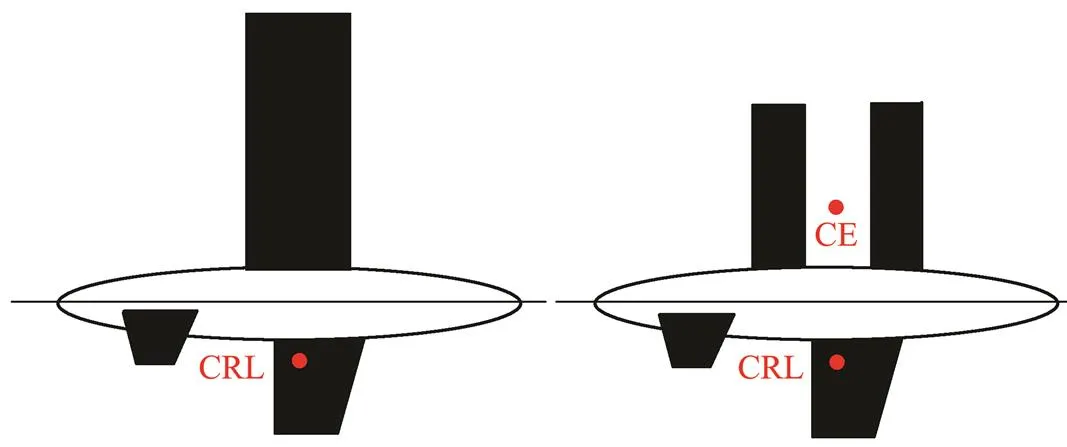
Fig.2 Force schematics on single and dual sails (Domin- guez-Britoet al., 2016). CLR, center of lateral resistance.
2 Analysis Model
The coordinate systemwas created to analyze the force of the dual-wing sail. Fig.3 shows the force anal- ysis of the wing sail mounted on an autonomous sailboat. Assume that the line perpendicular to the deck through point O is the spin axis of the wing sail. Then, the forward position is defined on the-axis, and the locations further forward relative to point O are positive. The-axis points to the starboard. The downward position is defined on the-axis, and the locations below point O are positive. Additionally,is the turning angle between the-axis and the wing sail;is the angle between the wind direction and the sail (angle of attack (AoA)); and the apparent wind speed and apparent wind direction are denoted byand(which equals+), respectively.FandFare the lift and drag force on front sail,FandFare the lift and drag force on rear sail.

Fig.3 Force analysis of dual-wing sail.
Similar to that on the wing, the force on the wing sails can be divided into drag and lift forces. The drag force Fis in the direction of the wind, whereas the lift forceFis perpendicular to the direction of the wind. Take the front-wing sail as an example. The lift and drag forces can be calculated by
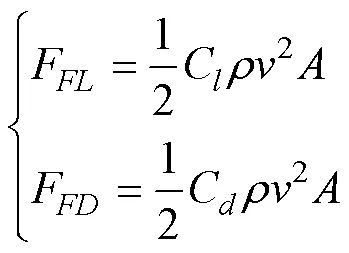
Furthermore, the force on the wing sail can be divided into thrust and lateral forces. ThrustFis an important force for propelling boats along, and the lateral forceFdoes the same along. If no interference exists between the front and rear sails, then the total driving force is twice that of a single wing sail. Thus, owing to the interference, the total driving and lateral forces must be calculated and summed up separately.
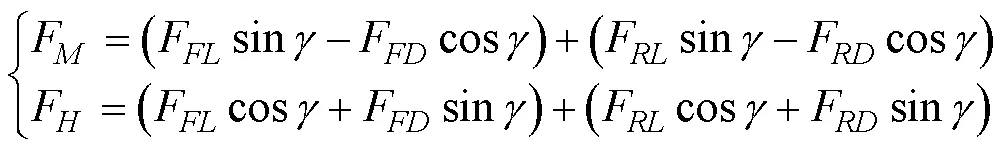
Furthermore, the driving force coefficientand lateral force coefficientcan be obtained as

The dual-sail driving system has different structural forms, for example, the cross sections or heights of sails may be different. To explore the factors influencing the liftcoefficient, we assumed that the front and rear sail heights are equal and that the cross sections of the sails are the same (, the chord length of each wing section is equal). As shown in Fig.3, if the angles of the two sails are the same, then the lift and drag directions on the front and rear sails are parallel. Given the arrangement of the front and rear sails, the yaw center of the ship is between the two sails. If the attack angles of the two sails are different, then the lift and drag directions of the two sails are no longer parallel, and the difference in the force directions of the front and rear sails produces a moment around the yaw center. This moment causes bow sway and affects course stability. Therefore, the sails of the dual-sail driving system are generally installed on the center line of the deck, and the front and rear sails are jointly controlled; that is, the angles of attack of the front and rear sails are the same.
The maximum speed that a sailboat can reach in different courses depends on wind speed and direction, and it can be predicted using a velocity prediction program. The lift and drag of the wing sail affect the sailing performance of an autonomous sailboat. In particular, the lateral force component affects the heeling of the sailboat. When the true wind speed is constant, the speed of the autonomous sailboat is mainly affected by the angle of attack of the wing sail and the course. According to Tretow(2017), the wing sail of an autonomous sailboat usually has a small angle of attack state most of the time. We find that the angle of attack of the wing sail is in a small angle of attack state in most cases when the autonomous sailboat reaches the maximum speed under different courses (Fig.4). In the downwind stage, the wing sail enters the stall state and shows the plank effect. In the present study, we focus on the lift coefficient and temporarily neglect the drag coefficient for two reasons. First, when the wing sail is in a small angle of attack state, it mainly relies on the lift of the airfoil to provide the driving force. Thus, we concentrate on the influence of various factors on the lift coefficient. Second, as previously mentioned, the 2D airfoil model excludes the influence of the spanwise flow on the airfoil system and is thus more suitable for analyzing the influence of the dual airfoil system. Therefore, the drag and lateral forces of the airfoil are not considered in this study. In our future research, we further study the interaction of lift and drag on the basis of 3D flow field.
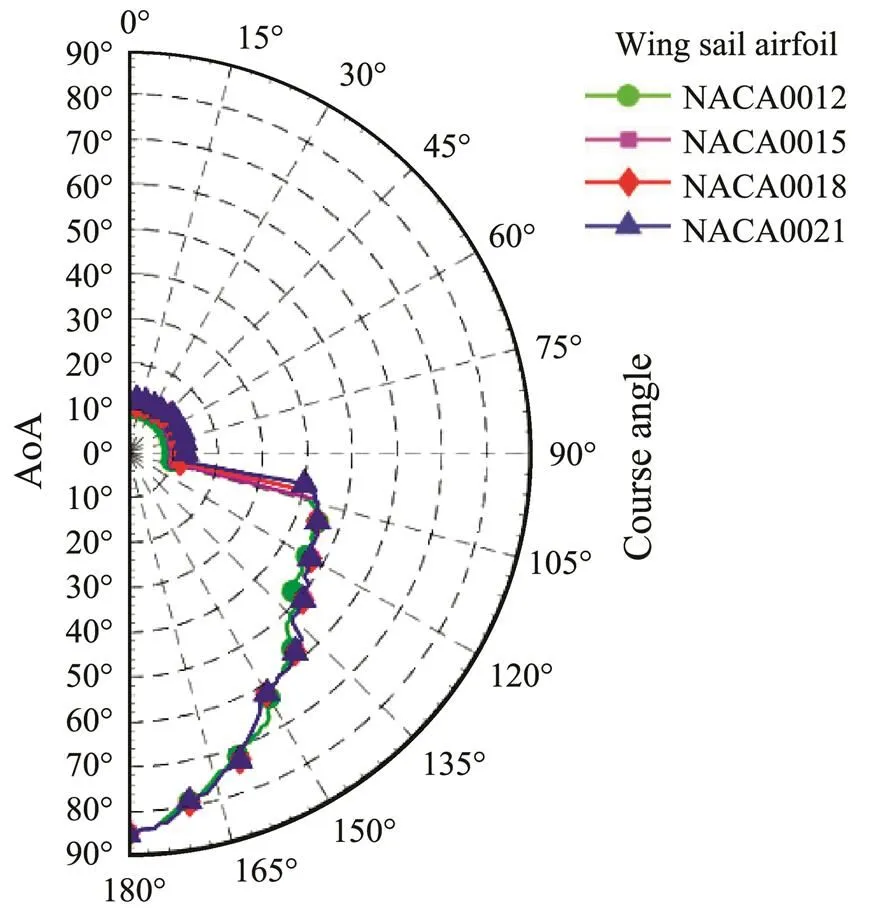
Fig.4 Angle of attack (AoA) of wing sails with different air-foils with maximum velocity obtained in various courses (true wind speed: 4ms−1).
The panel method is a common numerical technique for calculating the lift coefficient of the airfoil at a small angle of attack. Katz and Plotkin (2001) and Kuethe and Chow (1997) proposed methods for calculating the lift coefficient and pressure distribution of a single airfoil. The lift coefficients of the NACA0012 airfoil calculated by the vortex panel method at different angles of attack, wind tunnel tests (Sheldahl and Klimas, 1981), and Gregory’s research data (https://turbmodels.larc.nasa.gov/naca0012_val.html) are shown in Fig.5. The airfoil lift coefficient calculated on the basis of the vortex panel method is close to the actual lift coefficient of the airfoil.

Fig.5 Lift coefficients of NACA0012 airfoil obtained by different methods.
Assume that the airfoils of the front and rear sails are mounted on the same midline of the deck. As reflected in the coordinates, the leading edge of the rear airfoil is located on the sameaxis. The stagger represents the length from the trailing edge of the front sail to the leading edge of the rear sail. The relative positions in this calculation are specified in Fig.6.
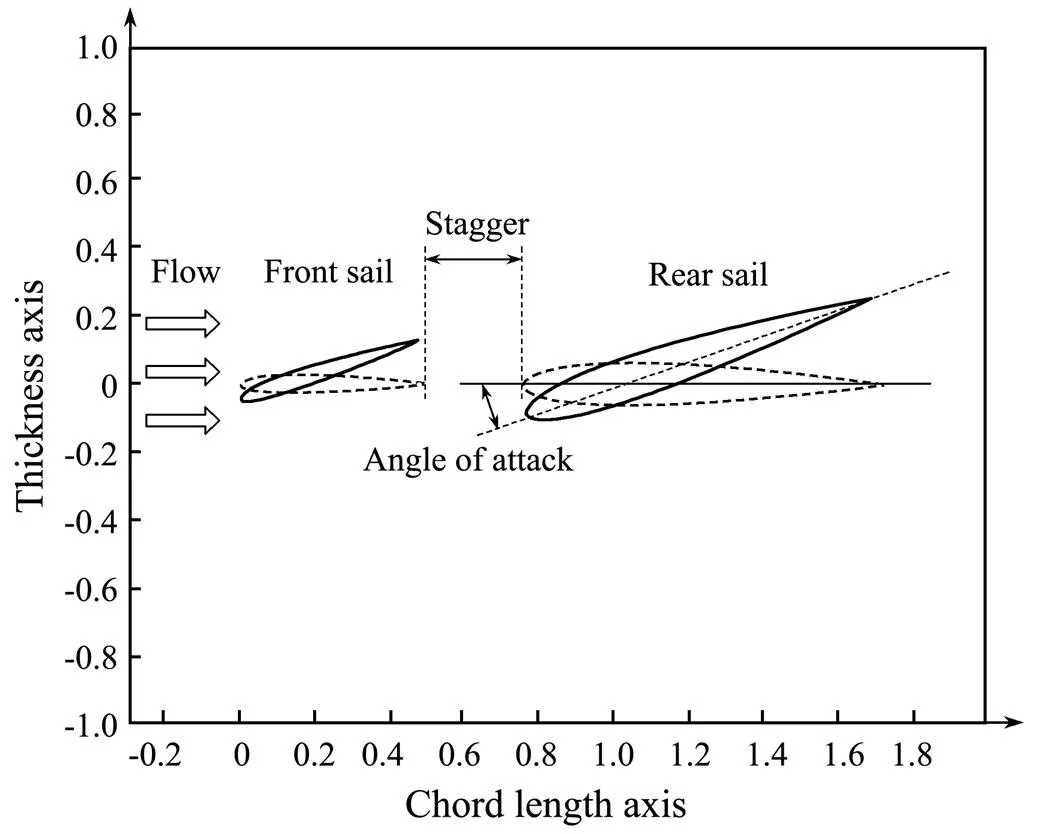
Fig.6 Relative positions of dual sails.
The influence of the relative position on aerodynamic coefficients can be observed by the pressure distribution on the front and rear airfoils (Li, 2006). The vortex panel method is mostly used to calculate the surface pressure distribution and lift coefficients of a single airfoil. In using this method to calculate the lift coefficient of the dual-sail, the panel method must be extended from a single element to multiple elements. Two important formulas are used in the calculation of the vortex panel method: oneis for calculating the strength of the vortices on each panel, and the other is for calculating the tangential velocity on each panel. In these two formulas, the parametersn, jandt, jare affected byand−1 simultaneously.
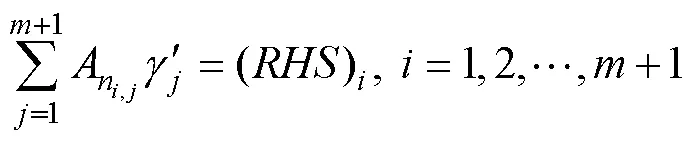
where for<+1:
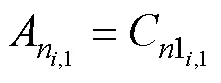
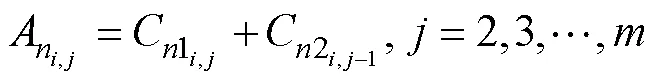
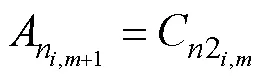
For=+1,
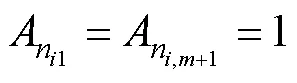
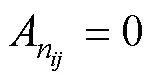
in which


The tangential coefficient matrix is the matrix of (2+1)×(2+2). Similar to that of the vertical coefficient matrix, the firstrows of the tangential coefficient matrix represent the front sail coefficient, and the remainingrows represent the rear sail coefficient. In addition, the influence of the virtual panel should be removed in the calculation of the tangential coefficient. In fact, no vortex exists on the virtual panel, that is, the influence on other panels is zero; thus, the coefficient of the virtual panel can be regarded as zero. The solution to this problem is to insert a row whose coefficients are all zero between the coefficients of the firstrows and the remainingrows; the same approach is used to obtain the tangential coefficient matrix. The remainder of the calculation process refers to the process of calculating the pressure distribution coefficient of a single sail airfoil on the basis of the vortex panel method. Note that the process is not described herein.
3 Analysis of the Influence of the Front Sail Chord Length on the Lift Coefficient
In the navigation course, the front sail receives wind first. As the rear sail is located behind the front sail, the air inflow of the rear sail is affected by the front sail wake flow. The normal performance of the rear sail is also affected. Reducing the size of the front sail, which involves changing the height or chord length, can effectively reduce the influence on the rear sail. As previously mentioned in this study, the heights of the two sails are assumed to be equal.
The four-digit symmetrical airfoils developed by the National Advisory Committee for Aeronautics (NACA) are commonly used on autonomous sailboats (Miller, 2018) because of the flowing key reasons. First, when sailing toward the wind, the course angle and the AoA of the sails should be constantly changed according to the wind direction to obtain the maximum propulsion. Given the need for tacking toward the wind, the shapes of the sails should be symmetrical. Second, in the navigation course, the AoA of the sails needs to be continuously adjusted to obtain a large propulsion; that is, the larger the angle of stall is, the larger the adjustable range of the angles of attack will be. Third, unlike aircraft wings and other high-speed devices, autonomous sailboat wing sails work at a low Reynolds number. NACA four-digit series airfoils are typical low-speed airfoils, and their aerodynamic performance at a low Reynolds number is sufficiently high. Fourth, most of the NACA series airfoils have been tested, and their performances have been fully validated. Therefore, a NACA four-digit series airfoil with a high stall angle has been adopted.
Assuming that the airfoils of the front and rear sails are the same, NACA0008, NACA0010, NACA0012, NACA- 0015, NACA0018, and NACA0021 airfoils are selected herein (http://www.pdas.com/profiles.html). The last two digits in the names represent the relative thickness of the airfoil; the larger the value is, the thicker the airfoil will be. The rear sail chord length is set as 1, and the front sail chord lengths are 0.2, 0.4, 0.6, 0.8, and 1; that is, the front and rear sails are the same when the front sail chord length is 1. The attack angle is set to 6˚. Fig.7 shows the curve between the total lift coefficient of the dual-sail and the front sail chord lengths.
The analysis graphs (Fig.7) show that the total lift coefficient of the dual-sail increases with an increase in airfoil thickness. When the stagger, AoA, and chord length are below certain values, the thicker the airfoil is, the larger the total lift coefficient will. Such relation is associated with the characteristics of the airfoil itself. Moreover, regardless of the type of airfoil adopted, when the stagger between the front and rear sails and the chord length of the rear sails is fixed, the total lift coefficient of the dual-sail increases almost linearly with an increase in the front sail chord length. This effect is mainly due to the lift coefficient at a small AoA that can be obtained by Eq. (14). Hence, the area enclosed by the pressure distribution coefficient of the upper and lower surfaces of the airfoil consists of the lift coefficient. When the airfoil and the AoA are fixed, the pressure coefficients of each panel are constant regardless of the changes in the chord length. However, changes in the chord length increase the-axis in the calculation of the area, and the area enclosed by the pressure distribution curve of the front sail airfoil surface gradually increases.

Fig.7 Relationship between total lift coefficient and front sail chord length (angle of attack=6˚).
whereC-lowerandC-upperare the pressure coefficient on the lower and upper surface of airfoil respectively. According to Lian. (2014), the comparison of the performances of the tandem configuration on the front and rear wings with the performance of a single-wing shows that the differences in force coefficients are due to the tandem wing interaction. The results of the front and rear wing sails are compared with those of a single-wing sail to determine the effects of the front wing sail on the rear wing sail (and). The changes in the lift coefficient of the front and rear sails relative to the front sail chord length are illustrated in Fig.8. As shown in the figure, with an increase in the front sail chord length, the lift coefficient of the front sail in the dual-sail propulsion system is larger than that of the single front sail. This result indicates that the dual-sail propulsion system exerts a positive impact on the front sail lift coefficient. Scharpf and Mueller (1992) found that the front airfoil lift coefficient in the tandem case increases relative to that of a single airfoil. Lian. (2014) analyzed the characterization of tandem and corrugated wings and found that the rear wing exerts a positive effect on the lift coefficient of the front wing. In the dual-sail propulsion system, the lift coefficientof the rear sail is smaller than that of a single rear sail, and it gradually decreases with an increase in the front sail chord length. This condition indicates that the front sail ex- erts an adverse effect on the rear sail. This effect is mainly due to the leading edge of the rear sail moving close to the back of the development area of the front sail wake whenthe front sail chord length increases. When the chordlengths of the front and rear sails are equal, the loss rate of the lift coefficient of the rear sail is the largest at 29.9%.
The surface pressure distribution curves of the front and rear sails in the dual-sail propulsion system are extracted and compared with those of single sail. Take the NACA- 0015 airfoil as an example. The surface pressure distribution of the front and rear sail airfoils when the AoA is 6˚ and the stagger is 0.5 is shown in Fig.9. The area enclosed by the pressure distribution curve of the front sail airfoil gradually increases with an increase in the front sail chord length; thus, the total lift coefficient of the two sails also increases.
In Fig.9, the pressure distribution coefficient on the surface of the rear sail airfoil changes with an increase in the front sail chord length. In the dual-sail propulsion system, the absolute value of the pressure coefficient at a control point on the airfoil surface of the front sail is larger than that at the same point on the airfoil surface of a single sail. The difference mainly occurs on the upper and lower surface positions of the leading edge. In addition,
the absolute value of the pressure coefficient at the same control point near the leading edge of the airfoil surface of the rear sail is smaller than that at the same control point on the surface of the single airfoil. Moreover, the pressure coefficients at the upper and lower surfaces of the trailing edge show a good agreement. With an increase in the front sail chord length, the position of the coincidence point of the pressure distribution coefficient of the rear sail also moves toward the trailing edge. This phenomenon indicates that the front sail affects the pressure distribution coefficient at the leading edge of the rear sail. Relative to the condition under the non-interference state, the pressure distribution coefficient at the leading edge of the rear sail decreases under the influence of the front sail.
As the rear sail is located at the back of the front sail, the inflow of the rear sail is easily affected by the front sail wake. Therefore, an adverse interference of the front sail on the rear sail is expected. However, in the results shown in Fig.9, the rear sail presents beneficial effects on the surface pressure distribution coefficient of the front sail. This result is a new finding. Therefore, the changes in the aerodynamic performance of the front sail should be analyzed. The analysis can be performed using numerical calculations, including a supplementary analysis based on CFD. To simplify the analysis and improve the calculation speed, we establish a 2D model of a dual-wing sail herein. The Reynolds-averaged Navier-Stokes equation and-turbulence models are used. The computational domain is discretized using structured grids. The coupled equations of pressure and velocity are calculated by the SIMPLE method. The second-order upwind scheme is used for the momentum and turbulent kinetic energy. First, a single sail with a NACA0015 airfoil; 0.5 stagger; and 0.2, 0.4, 0.6, and 0.8 chord lengths; is analyzed at an AoA of 6˚. Moreover, the pressure distribution coefficient of the single sail is extracted. Second, four different chord length combinations of the dual-sail are analyzed, and the surface pressure distribution coefficients of the front sails are extracted. The pressure distribution coefficients of the front sail under different interferences are shown in Fig.10.
Fig.8 Lift coefficient change of front and rear sails (angle of attack=6˚).

Fig.9 Pressure distributions around the front and rear airfoils with/without interaction at a certain angle of attack (angle of attack=6˚).
For an intuitive illustration, we extract the pressure and velocity distributions from the CFD analysis results (Fig.11). As shown in Figs.11(a) and 11(b), in the dual-sail propulsion system, the positive pressure area on the upper surface of the front sail increases relative to that of a single airfoil. The negative pressure area on the lower surface in- creases and is mainly concentrated on the leading edge. The changes in the surface pressure distribution coefficient of the airfoil are essentially the changes in the flow velocity on the surface of the airfoil. As shown in Figs.11(c) and 11(d), the increase in flow velocity in the negative pressure area near the wall of the front sail airfoil is than that of a single airfoil.
To analyze the specific reasons for the changes in the air velocity on the surface of the front sail airfoil, we carefully draw the flow streamline of the front sail in the dual-sail system and single sail system at an AoA of 5˚. We also observe the streamline near the leading edge and trailing edge of the airfoil, as shown in Figs.12(a) and 12(b).
Fig.12 shows that the air on the airfoil surface flows from the leading edge to the trailing edge for a single sail. In the dual-wing sail system, the development of the front sail wake is hindered because of the existence of the rear sail and wake downwash occurs at the trailing edge of the front sail. A vortex is generated under the trailing edge of the front wing sail under the action of a wake downwash. The specific direction is indicated by the anticlockwise red arrow in Fig.12(b). A vortex forms on the lower side of the trailing edge of the front sail, thereby creating a vacuum-like low pressure area and resulting in an increase in the total pressure difference between the leading and trailing edges of the front sail. Under the action of the pressure difference and suction caused by the vortex, the velocity of the flow field under the leading edge of the front sail and the surface pressure coefficient under the leading edge of the front sail increase.
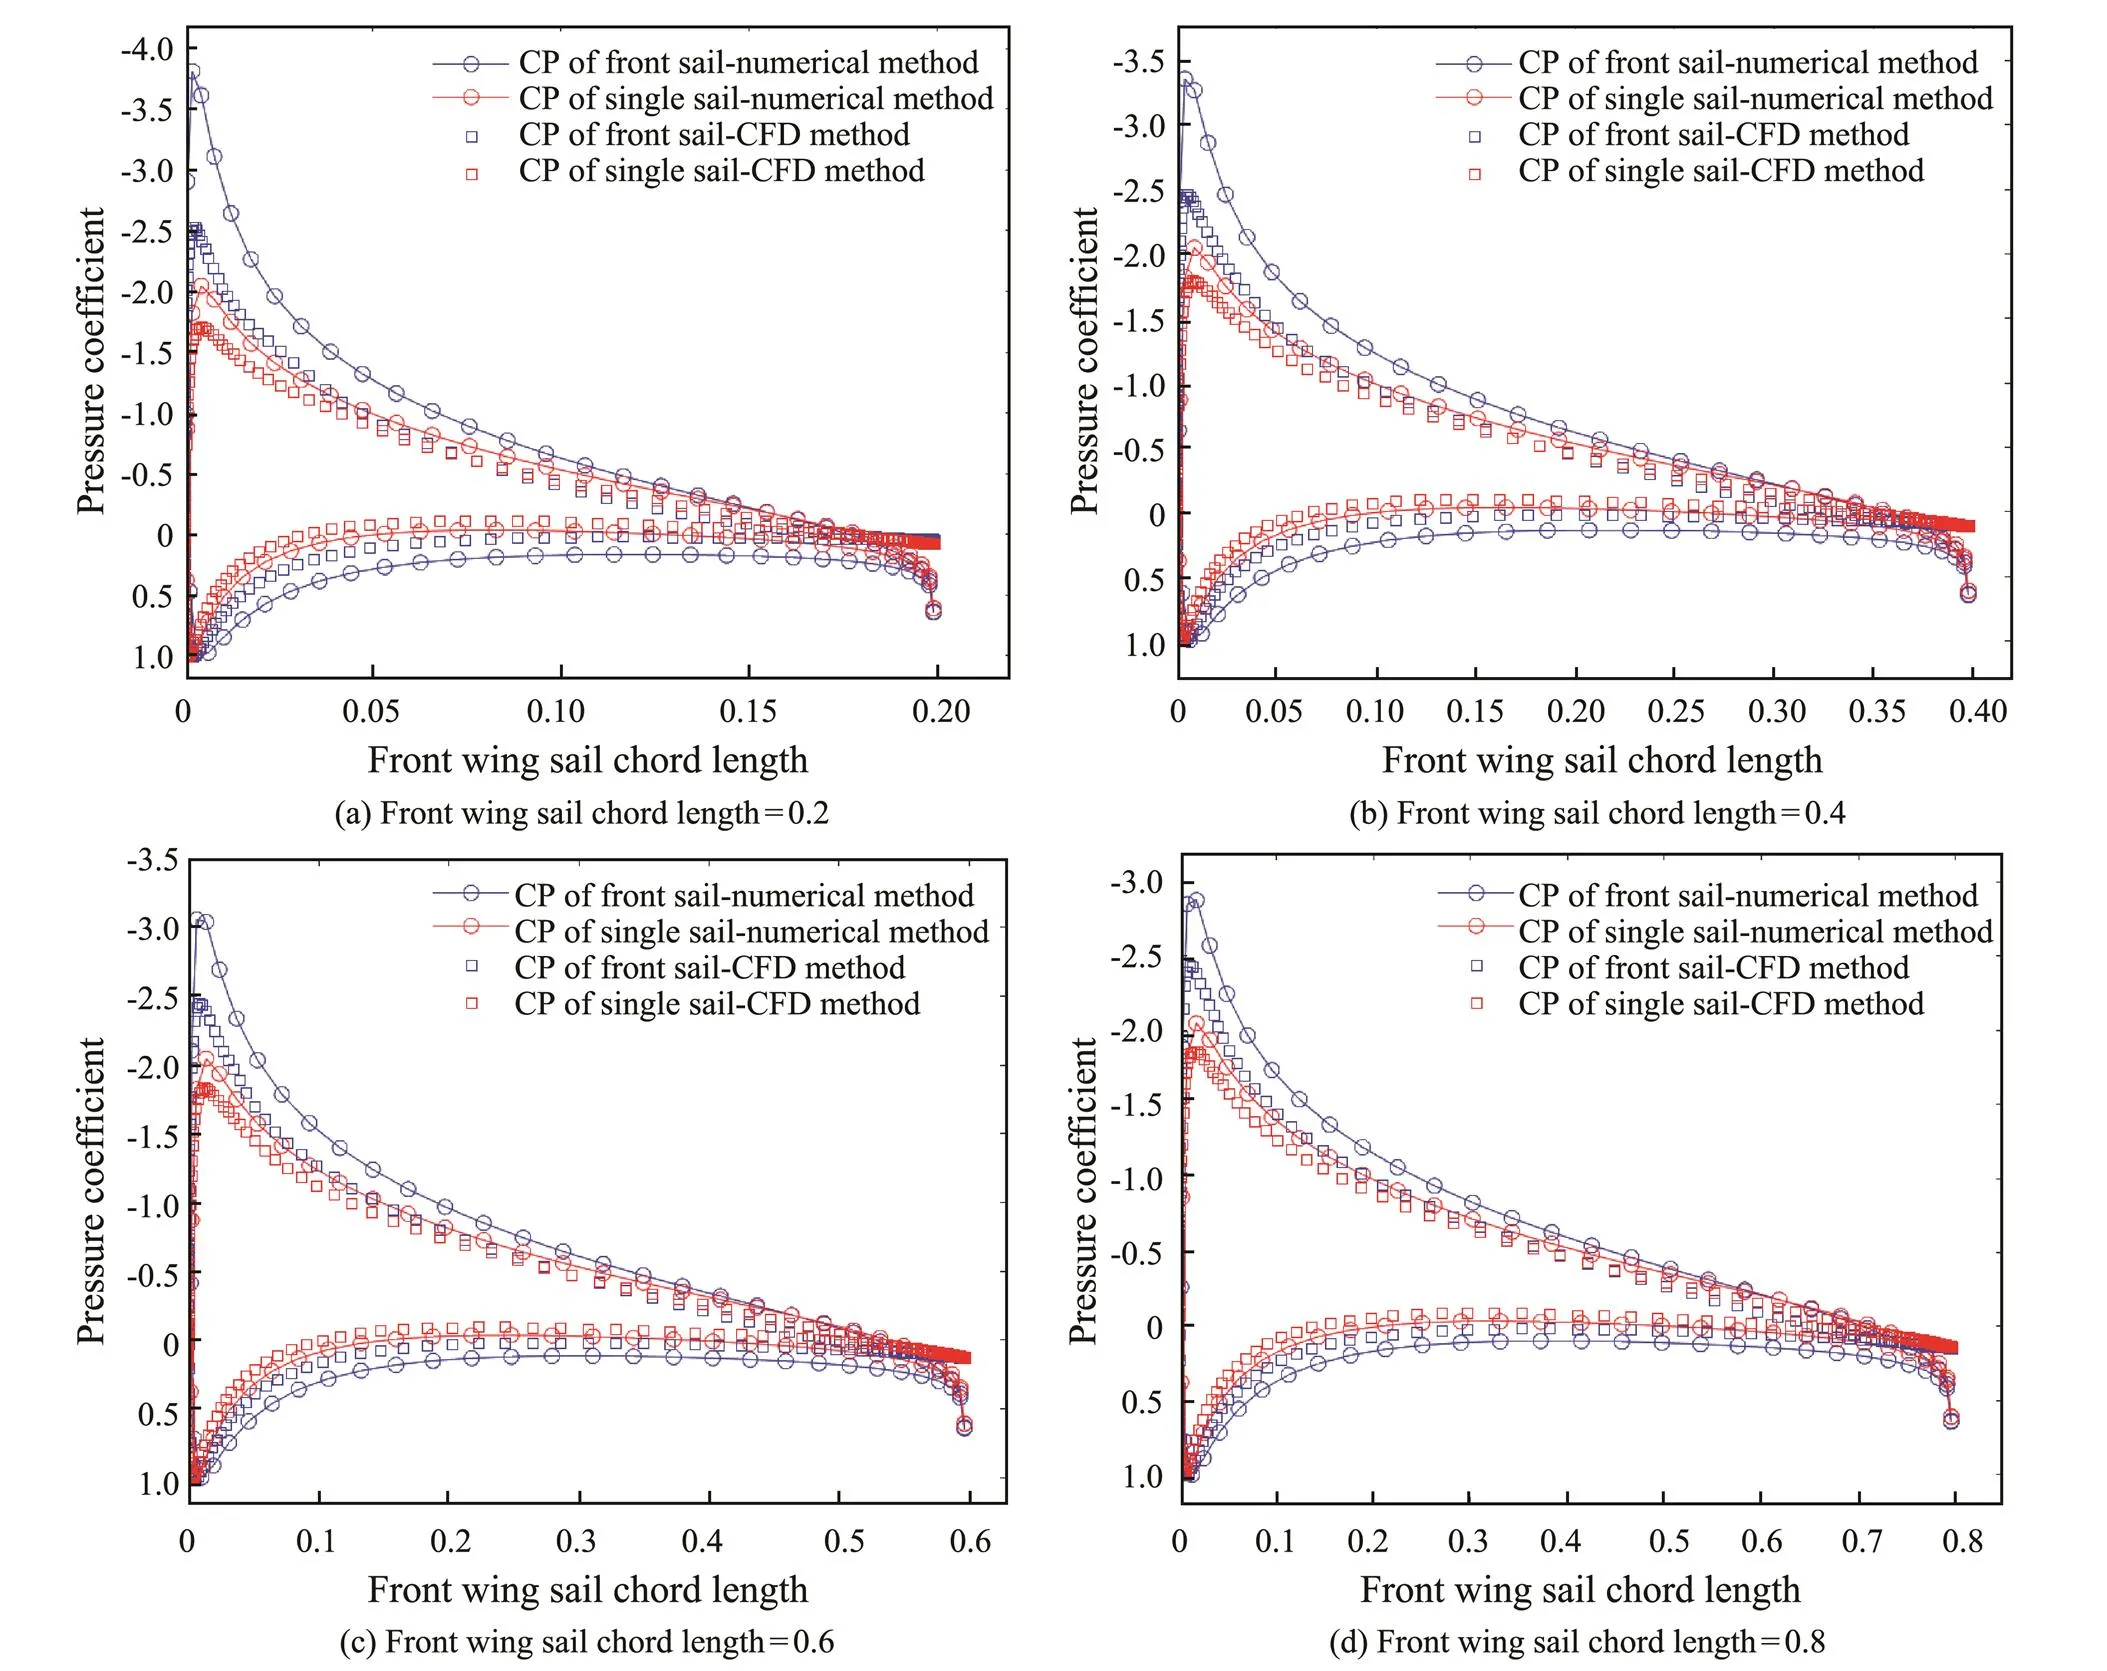
Fig.10 Pressure distributions around the front airfoil with/without interaction.

Fig.11 Pressure and velocity distributions of single and front sails.
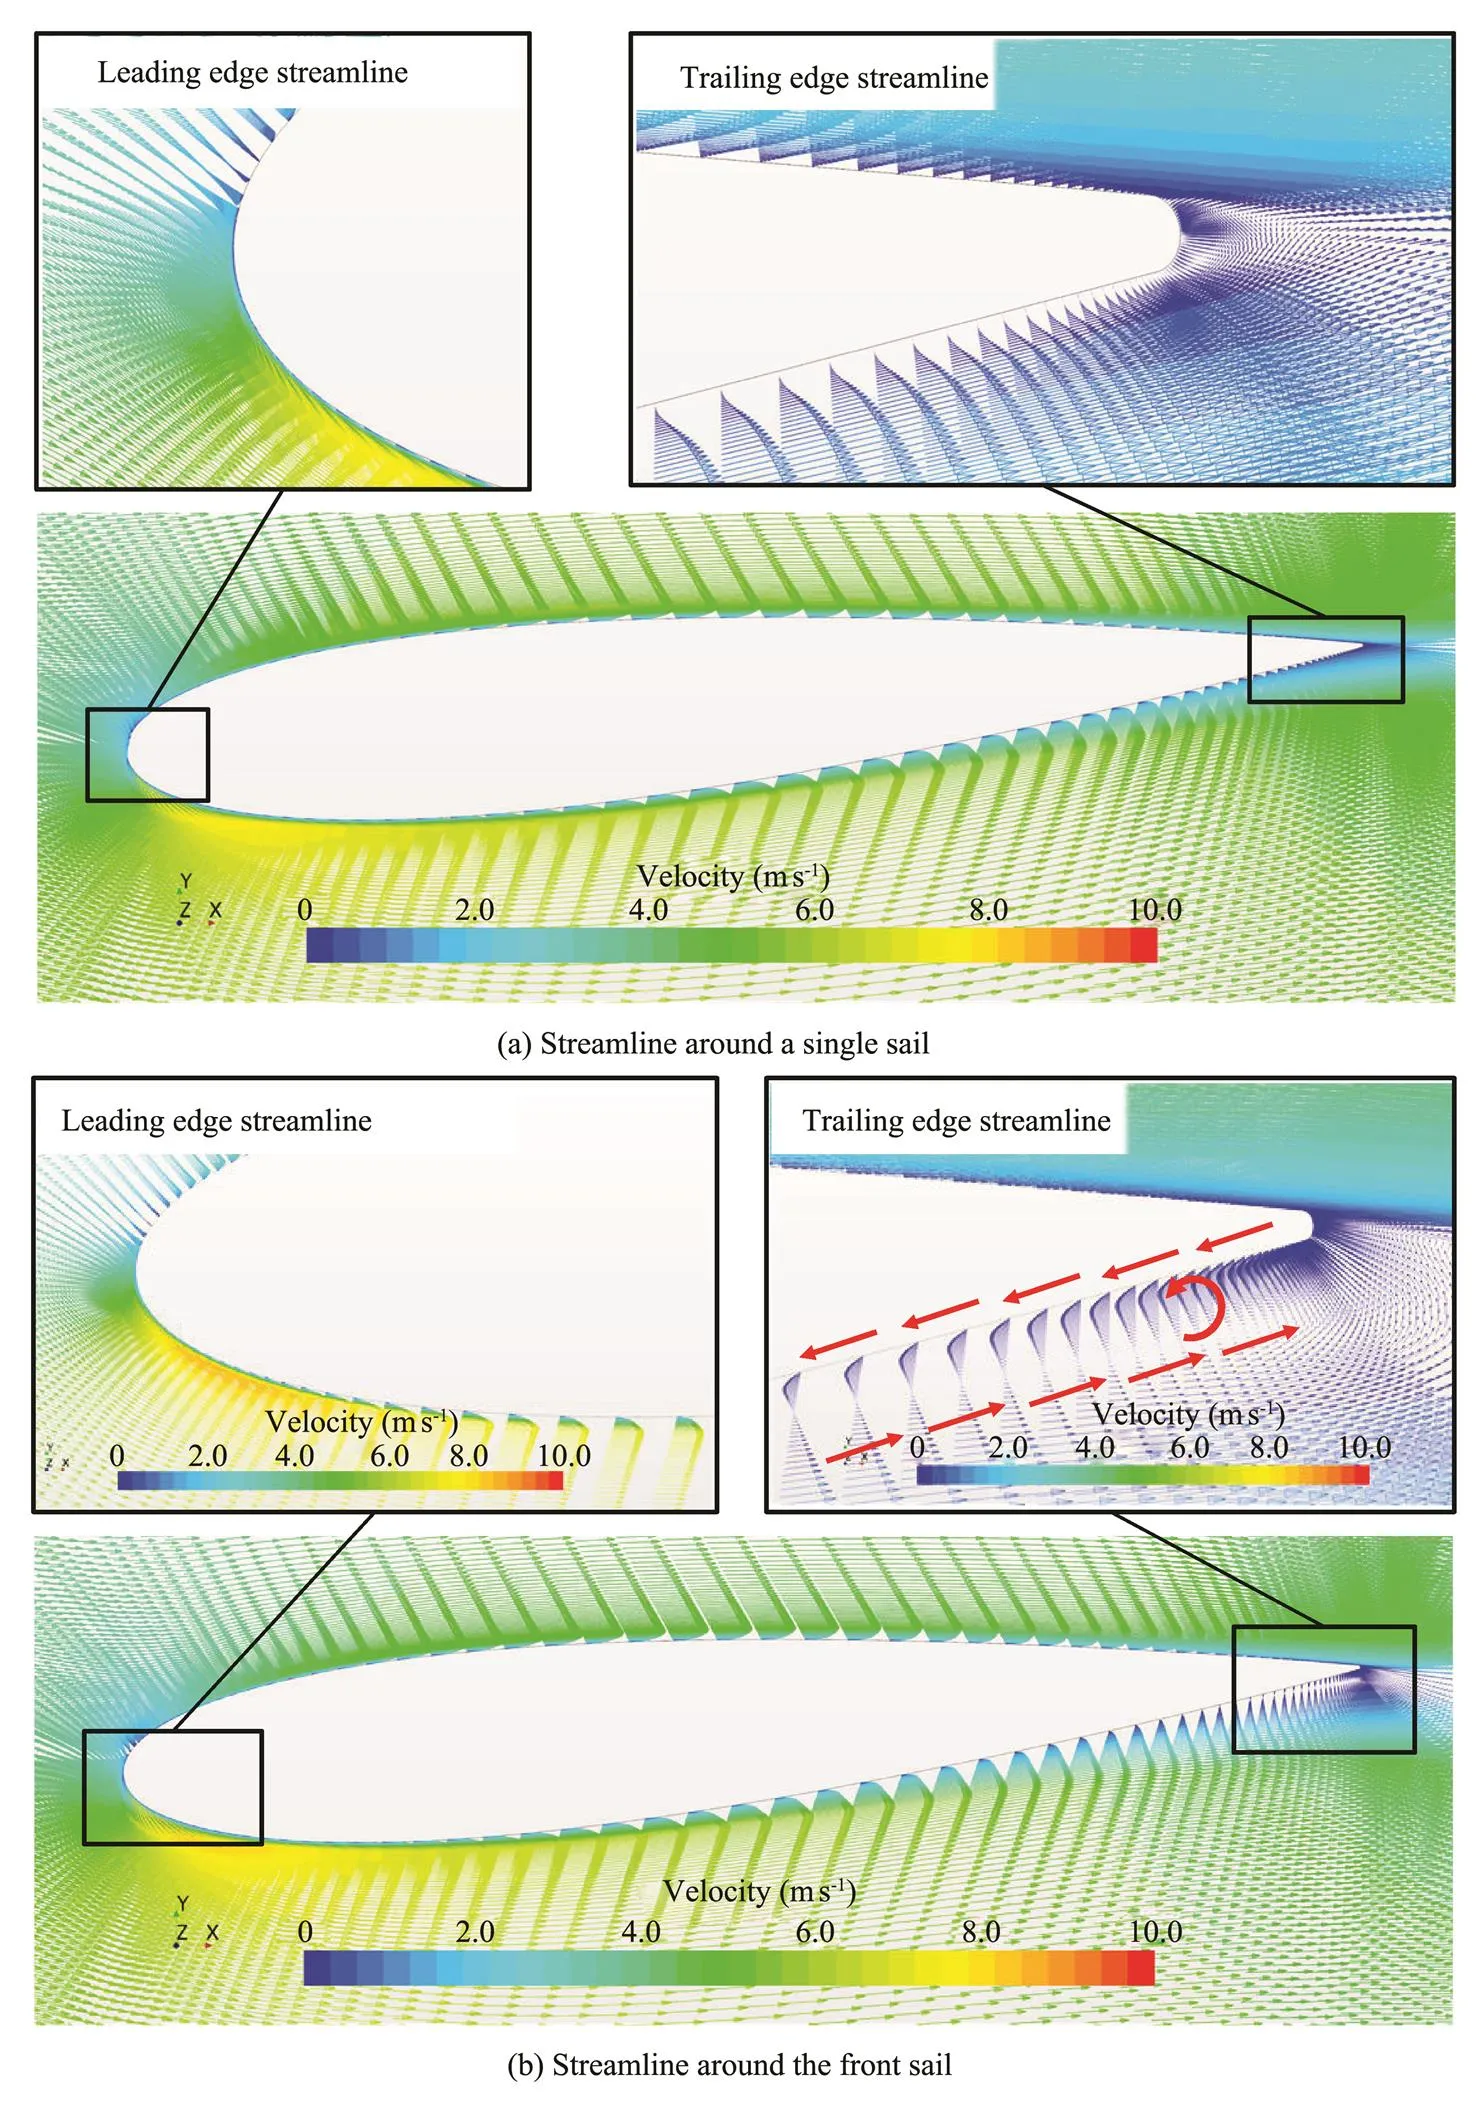
Fig.12 Streamline of front sail and single sail at an angle of attack of 5˚.
For a small stagger between the front and rear sails, the hindering action of the rear sails on the front-wing wake strengthens, and the interference between the front and rear sails increases. This observation explains the influence of the chord length of the front and rear sails on the lift coefficients of these sails. In the case of a particular stagger between the two sails, the increase in the chord length of the front sail is equivalent to an increase in the influence distance from the trailing edge wake to the leading edge of the airfoil. This condition reduces the pressure gradient from the leading edge to the trailing edge. Therefore, the beneficial interference of the rear sail on the front sail decreases with an increase in the chord length of the front sail. This observation is consistent with the results shown in Fig.10.
4 Analysis of the Influence of the AoA on Lift Coefficients
As described in Section 3, the influence of the front sail chord length on the lift coefficient of the dual-sail propulsion system is analyzed. During sailing, the sail angle in real time should be adjusted according to the wind direction. Therefore, we should analyze the influence of the AoA on the lift coefficient. The assumption is that the front sail chord length is 0.5, the rear sail chord length is 1, and the stagger is 0.25. The change in the total lift coefficient relative to the AoA for different airfoils is shown in Fig.13.
Fig.13 shows that the total lift coefficient increases with an increase in the AoA regardless of which airfoil is adopted. For a single sail at a small AoA, the lift coefficient increases with an increase in the attack angle. To further analyze the mutual interference between two sails, we assume that the front and rear sail airfoils are NACA-0015. The change in the lift coefficient with the AoA is shown in Fig.14. Thus, as the AoA increases, the total lift coefficient of the dual-sail propulsion system and the sum of two single airfoils gradually increase, but the former is relatively small. The front and rear wing sails of the tandem wing sail do not generate a lift that is the double of that of a single pair of wing sails. This result is consistent with the results of Li. (2016), who revealed an adverse interference between the dual sail at different angles of attack and a gradual increase in the loss rate of the lift coefficient with the angle of attack–approximately 5.8% and 6.3% for angles of attack of 1˚ and 8˚, respectively.
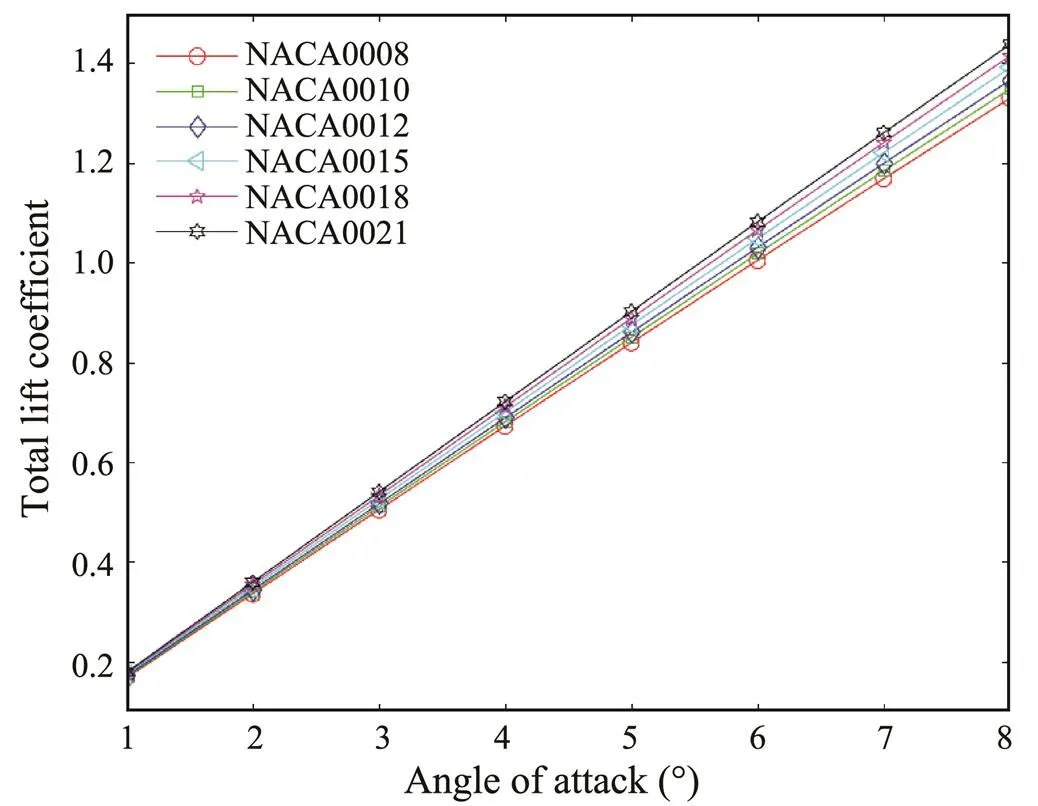
Fig.13 Change of lift coefficient with angle of attack for different airfoils.
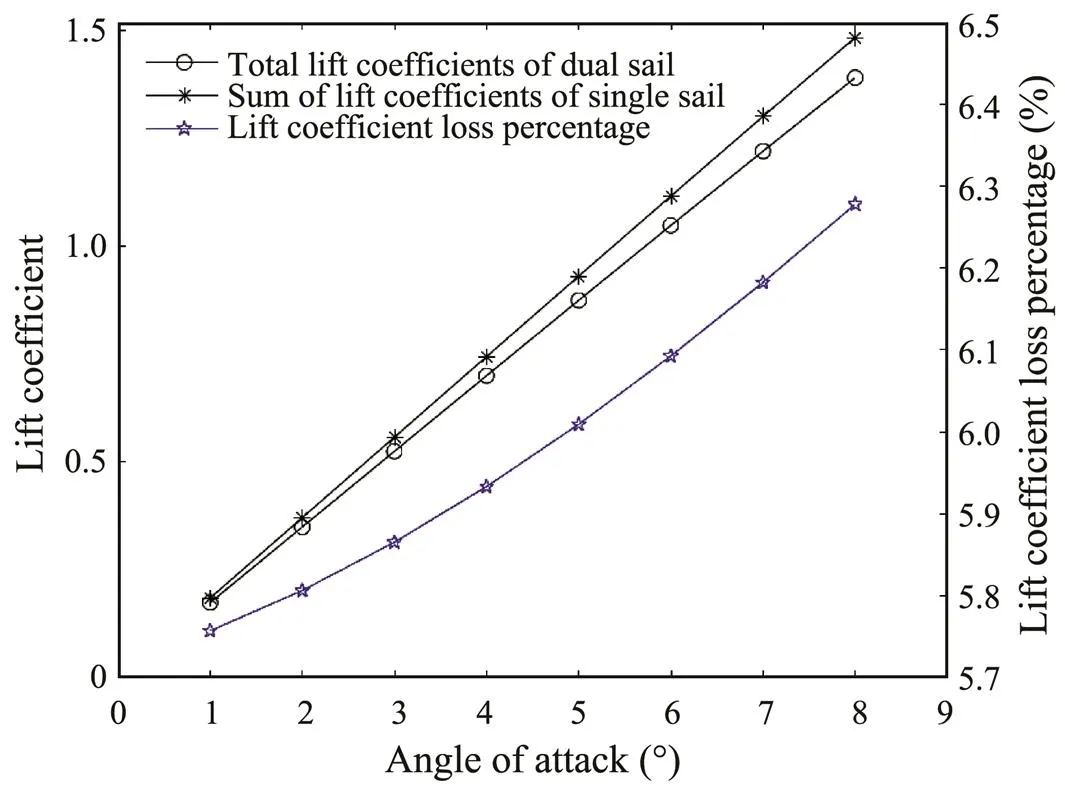
Fig.14 Relationship between total lift coefficients of the dual sail and the sum of lift coefficients of two single sail and the angles of attack.
The lift coefficient loss percentage of the rear sail in the dual-sail propulsion system decreases with an increase in the AoA relative to the lift coefficient of a single rear sail. This result shows that with an increase in the AoA, the influence of the front sail on the lift coefficient of the rear sail decreases.
For further analysis, the pressure coefficient distribution curves of the front and rear sails are extracted. The pressure coefficient distribution curves of single sail are shown collectively in Fig.15. The decrease in the lift coefficient is the direct result of the decrease in airfoil surface pressure difference. On the contrary, the increase in the lift coefficient is the result of the increase in airfoil surface pressure difference.
Fig.15 shows that the absolute value of the pressure coefficient at the same control point on the airfoil surface of the front sail in the dual-sail system is higher than that at the same control point on the airfoil surface of the single sail, under different attack angles. With an increase in the AoA, the surface pressure distribution coefficient on the leading edge of the front sail starts to separate, and the separation point moves to the trailing edge. The pressure distribution coefficient on the lower surface of the front sail is evenly separated from the leading edge to the trailing edge, but the separation degree increases with an increase in the AoA. The coincidence degree of the upper surface pressure distribution coefficient on the trailing edge of the front sail is better than that of the lower surface. This result indicates that the upper surface of the trailing edge of the front sail is less affected than the lower surface.
In the dual-sail system, the absolute value of the pressure coefficient at the same control point near the leading edge of the airfoil surface of the rear sail is smaller than that at the same control point on the surface of the single airfoil. The agreement of the pressure coefficient at the upper and lower surfaces of the trailing edge is also satisfactory. With an increase in the AoA, the pressure distribution coefficient of the upper and lower surfaces of the leading edge of the rear sail starts to separate, and the degree of separation increases with an increase in the AoA. The separation point of the pressure distribution coefficient of the upper and lower surfaces of the rear sail gradually increases with an increase in the AoA, and the movement speed of the upper surface is higher than that of the lower surface. This result indicates that the upper surface of the rear sail is more affected than the lower surface. Compared with that of the front sail, the upper and lower surface pressure distribution coefficients of the rear edge of the rear sail are better than those of the rear edge of the front sail with or without interference. This result shows that the rear sail also exerts an impact on the pressure distribution of the trailing edge of the front sail.
The same CFD analysis method in the third section is used to calculate the influence of the AoA on the lift coefficient of the dual-sail system. The airfoil is NACA0015; the stagger is 0.25; the chord lengths of the front and rear sail are 0.5 and 1.0, respectively; and the angles of attack are 1˚, 3˚, 5˚, and 7˚. The surface pressure distribution coefficients of the front and rear sails in the dual-sail driving system are shown in Figs.16(a) and 16(b), respectively.
Fig.16 shows that the variations in the surface pressure distribution coefficient of the front and rear sail airfoils at different angles of attack are similar to those obtained by the numerical calculation method depicted in Fig.15. The changes in the pressure distribution coefficient caused by the changes in the AoA are mainly associated with the upper and lower surfaces of the leading edge of the front and rear sails. Overall, the changes in the pressure distribution coefficient in the negative pressure area are relatively sensitive to the AoA.

Fig.15 Pressure coefficient distribution of airfoil at different angles of attack.
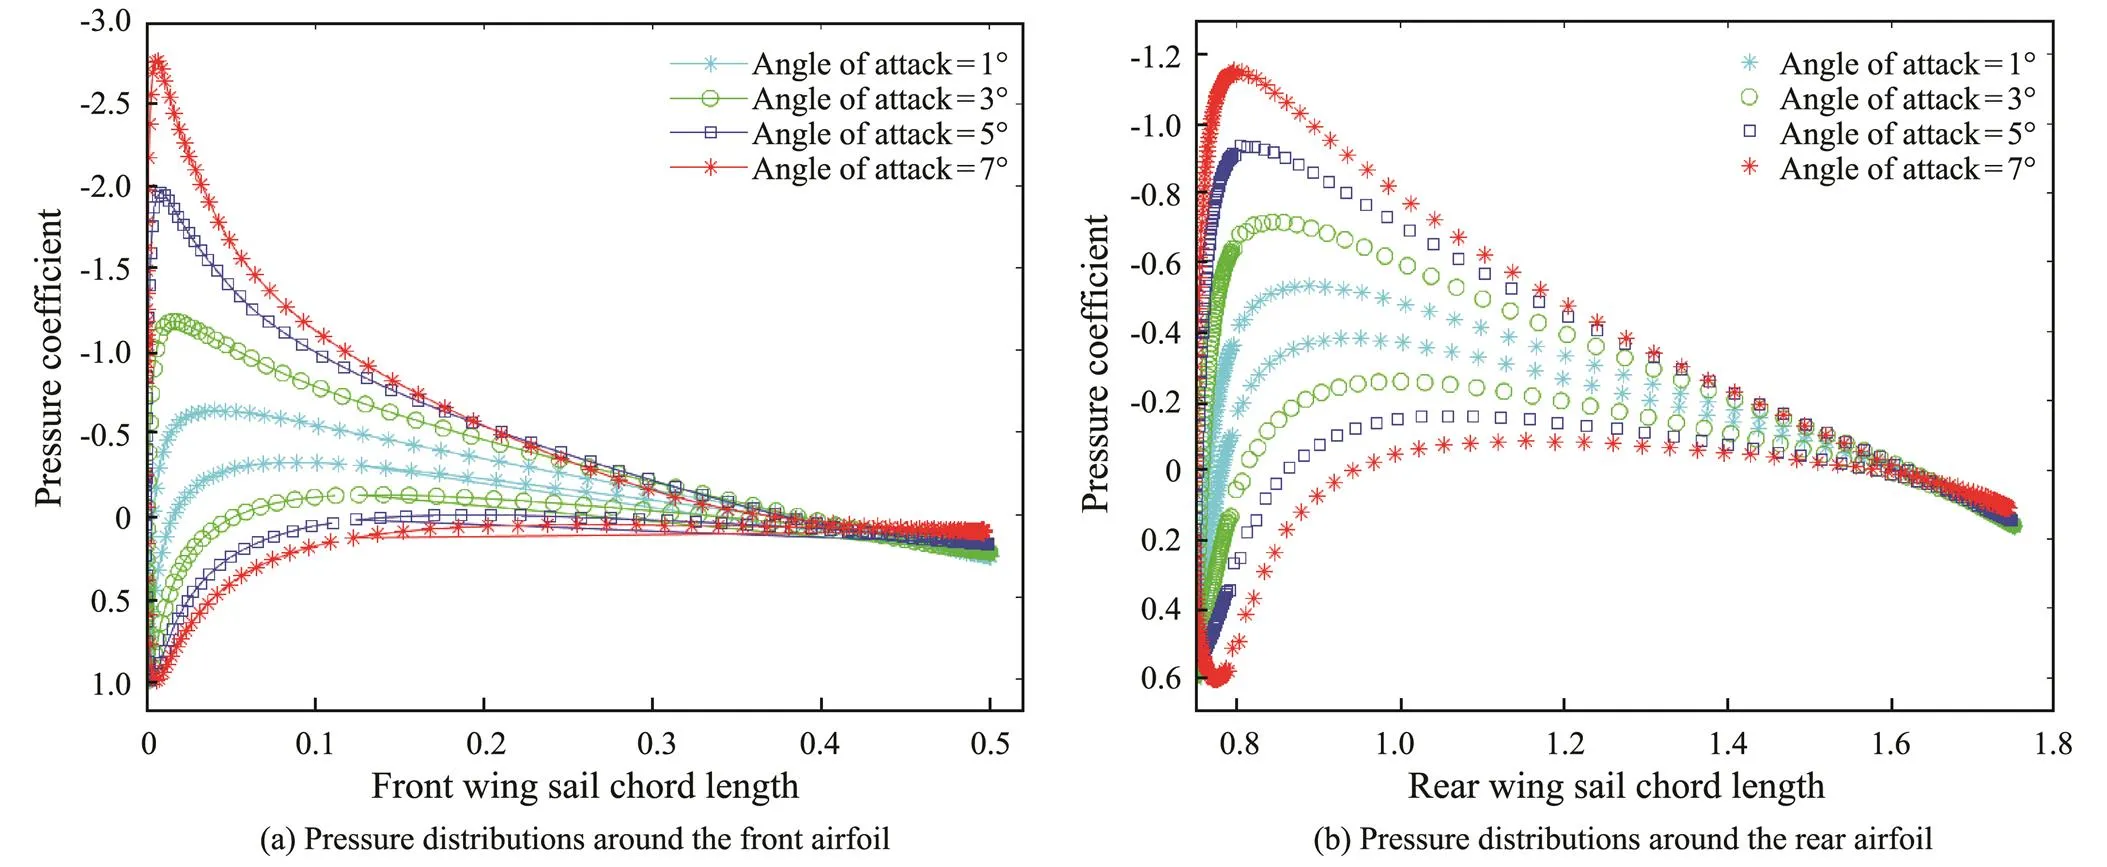
Fig.16 Pressure distribution coefficients of front and rear sails under various angles of attack.
5 Conclusions
This study analyzed the influence of the chord length and AoA (not exceeding the stall angle) of the wing sail on the lift coefficient of the dual-sail propulsion system of an autonomous sailboat from the perspective of the lift coefficient. Moreover, this work preliminarily explored the causes of such influence.
When the airfoil, AoA (not exceeding the stall angle), and stagger were fixed, the total lift coefficient increased with an increase in the front sail chord length. However, it was always lower than the sum of the single front and rear sail lift coefficients, and the loss rate of the lift coefficient increased with an increase in the front sail chord length. The lift coefficient of the rear sail decreased with an increase in the front sail chord length. The lift coefficient loss rate of the rear sail reached a maximum value of 29.9% when the front sail chord length was equal to that of the rear. This result indicated that the front sail mainly provided the propulsion when the autonomous sailboat was propelled by two-wing sails with equal chord lengths and heights.
For angles of attack not exceeding the stall angle and fixed airfoil, stagger, and chord length, the total lift coefficient increased with an increase in the attack angle, but it was always smaller than the sum of the lift coefficients of the single front and rear sails. Moreover, the lift coefficient loss rate increased with an increase in the attack angle. With an increase in the AoA, the lift coefficient loss rate of the rear sail decreased.
With a low AoA, the beneficial interference of the rear sail on the front sail was caused by the change in the air velocity on the surface of the airfoil. The change in the air velocity was a result of the generation of the wake vortex at the trailing edge of the front sail.
The results of this study can serve as a reference for the design of autonomous sailboats. In the follow-up research, we will consider 3D airfoils.
Acknowledgements
The authors thank all other members of the Seagull Au- tonomous Sailboat project for their help. The study is supported by the Foundation of State Key Laboratory of Robotics (No. 2020-Z14), the Jiang Xin-song Innovation Foundation (No. Y8F7010701), the National Natural Science Foundation of China (No. 41906173), and the China Postdoctoral Science Foundation (No. 2019M662874).
Abdellatif, O. E., and Gawad, A. F. A., 2000. An experimental investigation of closely interfering airfoils at a low Reynolds number.. Saint-Dizier, 10-13.
Anderson Jr., J. D., 2010.. Tata McGraw-Hill Education, New York, 361-366.
Atkinson, G. M., 2019. Analysis of lift, drag and CX polar graph for a 3D segment rigid sail using CFD analysis., 18 (1): 36-45.
Buhler, M., Heinz, C., and Kohaut, S., 2018. Dynamic simulation model for an autonomous sailboat.. Southampton, 1-9.
Cai, Y., Liu, G., Zhu, X., Tu, Q., and Hong, G., 2019. Aerodynamic interference significance analysis of two-dimensional front wing and rear wing airfoils with stagger and gap variations., 32 (6): 04019098.
Cokelet, E. D., Meinig, C., Lawrence-Slavas, N., Stabeno, P. J., Mordy, C. W.,Tabisola, H. M.,, 2016. The use of saildrones to examine spring conditions in the Bering Sea.’Washington, 1-7.
Deng, Y., Zhang, X., Zhang, G., and Huang, C., 2019. Parallel guidance and event-triggered robust fuzzy control for path following of autonomous wing-sailed catamaran., 190: 106442.
Dominguez-Brito, A. C., Valle-Fernández, B., Cabrera-Gámez, J., Ramos-de-Miguel, A., and García, J. C., 2016. A-TIRMA G2: An oceanic autonomous sailboat.. Springer International Publishing, Aland, 1-8.
Fossati, F., 2009.. Adlard Coles Nautical, London, 4-6.
Katz, J., and Plotkin, A., 2001.. Cambridge University Press, Cambridge, 284-288.
Kuethe, A. M., and Chow, C. Y., 1997.. John Wiley & Sons Inc., New Jersey, 156-160.
Li, G. J., Li, F., and Shi, W., 2006. Numerical simulations of tandem-airfoil., 01: 19-24 (in Chinese with English abstract).
Li, Y. Z., Sun, C. J., and Lu, Y. G., 2016. Studying the impact of aerodynamic characteristics due to the relative position of the wing for the tandem wing., 36 (6): 32-36 (in Chinese with English abstract).
Lian, Y., Broering, T., Hord, K., and Prater, R., 2014. The characterization of tandem and corrugated wings., 65: 41-69.
Liu, H., 2018. Linear strength vortex panel method for NACA 4412 Airfoil.IOP Publishing, Dubai, 326 (1): 012016.
Ma, Y., Bi, H., Gan, R., Li, X., and Yan, X., 2018. New insights into airfoil sail selection for sail-assisted vessel with computational fluid dynamics simulation., 10 (4): 1-12.
Miller, P., Judge, C., Sewell, D., and Willamson, S., 2018. An alternative wing sail concept for small autonomous sailing craft.. Springer, Cham, 3-17.
Rokhsaz, K., and Selberg, B. P., 1986. Dual-wing systems with decalage angle optimization., 23 (5): 444-448.
Scharpf, D. F., and Mueller, T. J., 1992. Experimental study of a low Reynolds number tandem airfoil configuration., 29 (2): 231-236.
Sheldahl, R. E., and Klimas, P. C., 1981. Aerodynamic characteristics of seven symmetrical airfoil sections through 180-degree angle of attack for use in aerodynamic analysis of vertical axis wind turbines. Sandia National Laboratories, SAND- 80-2114, 9-12.
Silva, M. F., Friebe, A., Malheiro, B., Guedes, P., Ferreira, P., and Waller, M., 2019a. Rigid wing sailboats: A state of the art survey., 187: 106-150.
Silva, M. F., Malheiro, B., Guedes, P., and Ferreira, P., 2019b. Airfoil selection and wingsail design for an autonomous sailboat.. Springer, Cham, 305-316.
Souppez, J. B. R., Arredondo-Galeana, A., and Viola, I. M., 2019.Recent advances in numerical and experimental downwind sail aerodynamics., 4 (1): 45-65.
Sun, Z. Y., Yu, J. C., Zhang, A. Q., and Jin, Q. L., 2019. Analysis of influencing factors on lift coefficients of autonomous sailboat double sail propulsion system based on vortex panel method., 33 (6): 1-7.
Tretow, C., 2017. Design of a free-rotating wing sail for an autonomous sailboat. Master thesis. KTH Royal Institute of Technology.
Yu, J. C., Sun, Z. Y., and Zhang, A. Q., 2018a. Research status and prospect of autonomous sailboats., 54 (24): 98-110 (in Chinese with English abstract).
Yu, J. C., Sun, Z. Y., and Zhang, A. Q., 2018b. The present status of environmental energy harvesting and utilization technology of marine robots., 40 (1): 89-101 (in Chinese with English abstract).
Zeng, X., and Zhang, H., 2018. Experimental study of the aerodynamics of sail in natural wind., 25 (s2): 17-22.
Zhu, J. Y., Jiang, L., and Zhao, H., 2016. Effect of wind fluctuating on self-starting aerodynamics characteristics of VAWT., 23 (8): 2075-2082.
(Oceanic and Coastal Sea Research)
https://doi.org/10.1007/s11802-022-4752-5
ISSN 1672-5182, 2022 21 (3): 656-668
(September 4, 2020;
March 17, 2021;
April 9, 2021)
© Ocean University of China, Science Press and Springer-Verlag GmbH Germany 2022
Corresponding author. Tel: 0086-24-23970953 E-mail: yjc@sia.cn
(Edited by Xie Jun)
 Journal of Ocean University of China2022年3期
- Journal of Ocean University of China的其它文章
- Effect of Intertidal Elevation at Tsuyazaki Cove, Fukuoka,Japan on Survival Rate of Horseshoe Crab Tachypleus tridentatusEggs
- Asian Horseshoe Crab Bycatch in Intertidal Zones of the Northern Beibu Gulf: Suggestions for Conservation Management
- Experimental Investigation on the Interactions Between Dam-Break Flow and a Floating Box
- Variational Solution of Coral Reef Stability Due to Horizontal Wave Loading
- High Microplastic Contamination in Juvenile Tri-Spine Horseshoe Crabs: A Baseline Study of Nursery Habitats in Northern Beibu Gulf, China
- Nonlinear Dynamic Analysis and Fatigue Study of Steep Wave Risers Under Irregular Loads