
Abundance, Diversity and Functional Potentials of Planktonic Bacteria and Microeukaryotes in the Coral-Reef System of Xisha Islands, China
2022-06-14 05:25ZHANGXiaoliWANGLeiPENGSaijunWUZHONGQiyueZHANGLeiDONGZhijunSUNTingtingLIUPingZHANGQianqianandZHAOJianmin
ZHANG Xiaoli, WANG Lei, PENG Saijun, 2), WUZHONG Qiyue, 3), ZHANG Lei, DONG Zhijun, *, SUN Tingting, 2), LIU Ping, ZHANG Qianqian, and ZHAO Jianmin, *
Abundance, Diversity and Functional Potentials of Planktonic Bacteria and Microeukaryotes in the Coral-Reef System of Xisha Islands, China
ZHANG Xiaoli1), WANG Lei1), PENG Saijun1), 2), WUZHONG Qiyue1), 3), ZHANG Lei4), DONG Zhijun1), *, SUN Tingting1), 2), LIU Ping1), ZHANG Qianqian1), and ZHAO Jianmin1), *
1) Yantai Institute of Coastal Zone Research, Chinese Academy of Sciences, Yantai 264003, China 2) University of Chinese Academy of Sciences, Beijing 100049, China 3) State Key Laboratory of Marine Resource Utilization in South China Sea, College of Marine Science, Hainan University, Haikou 570228, China 4) College of Life Science, Yantai University, Yantai 264005, China
Corals influence microorganisms within the surrounding seawater, yet the diversities and functions of seawater bacteria and microeukaryotes in coral-reef systems have not been well addressed. We collected 40 seawater samples in outer coral reef flats and semi-closed inner lagoons from the surface, middle and bottom layers in the pristine coral-reef system of Xisha Islands, South China Sea. We detected the abundance, composition and distribution of bacteria and microeukaryotes using flow cytometry, qPCR and high throughput sequencing techniques, and profiled the potential ecological roles based on the information of 16S and 18S rDNA sequencing. In terms of flow cytometry,dominated the autotrophs with cell abundance ranging from 5.8×10²to 5.44×10³cellsmL−1seawater. Based on qPCR, the 16S rDNA copies were much higher in coral reef flats than in lagoons (= 0.003). The bacterial communities held significantly lower diversity in bottom waters compared with surface and middle waters (< 0.05), which were dominated by SAR11, Flavobacteriales, and. Alveolata represented most of the microeukaryotic communities with Dinophyceae and Syndiniales well represented in all samples. Neither bacterial nor microeukaryotic community exhibited distinct layer or niche pattern, however, Haptophyta and Picozoa decreased with depth and SAR 86, MAST-3 and Picozoa were enriched in lagoons (<0.05). To adapt the nutrient-poor and organic matter-rich environment, bacterial nitrogen fixation and assimilatory/dissimilatory nitrate reduction were active in the system, and mixotrophy was the most important trophic strategy among microeukaryotes. The study highlighted the ecological adaptability of seawater microbes to the unique coral-reef environments.
community composition; function; adaptability; planktonic bacteria and microeukaryotes; coral reef systems
1 Introduction
Coral reef ecosystems are distributed in shallow oli- gotrophic waters in the tropical oceans. The replenish- ment and recycling of nutrients in the ecosystems are primarily driven by microbes (Ziegler., 2016; Ainsworth, 2017; Kelly., 2019), and intimate interactions have been found between corals and seawater microorganisms (Nelson., 2011; Rädecker., 2015). Corals secrete substantial dissolved organic matter (DOM), as well as particulate mucopolysaccharide ma- terial (mucus), that can dominate the suspended matters in reefs (Nakajima., 2017). Besides, corals release in- organic substrates into surroundings as a result of metabolic activities, manipulating the chemistry of the surrounding seawater (Rädecker., 2015). All of these exudates were known to affect microbial communities and processes (Haas., 2013; Nelson., 2013). Additionally, some corals directly graze on bacterioplank- ton from the water columnsuspension feeding (Nel- son., 2011; Jensen., 2012). Corals preferentially support the growth of specific groups such as fast-growing copiotrophic-type cells, which they in turn scavenge on (McNally, 2017). On the other hand, diverse seawater bacteria contribute to corals with potential functions related to nitrogen, carbon and sulfur metabolism, and even disease resistance and abiotic stress tolerance (Gaidos., 2011; Tout., 2014). Current studies have predominantly concerned on coral symbiotic microorganisms (related to the coral colony or inhabiting the coral tissues) (Lesser, 2004; Lema., 2012; Peixoto., 2017), the communities and associated functions of bacteria in the surrounding water have not been well addressed (Polónia, 2016; Weber and Apprill, 2020). These coral reef water bacteria differ from symbiotic bacteria (Polónia, 2016), exchanging their energy and nutrients with coral reefs and responding rapidly to environmental changes (Allers, 2008), and hence can be regarded as important bioindicators of coral reef degradation processes (Glasl, 2019).
Microeukaryotes (protists, fungi and small zooplankton) play vital roles in a variety of aquatic environments. They are responsible for primary production in the ocean (Wu., 2020), and some members of them are pathogens, parasites and bloom-forming organisms (Sherr, 2007). In coral reef habitats, the microeukaryotes have been widely discussed in association with the critical roles and importance of the photoendosymbiotic dino- flagellate (Lesser., 2013), coral disease and mortality (Priess., 2000), and organic matter degradation (Ra- ghukumar and Ravindran, 2012). However, enormous gaps remain exist in our understanding of the community compositions and functional capacities of microeukar- yotes in coral-reef systems. The sequencing of the 18S rRNA gene has demonstrated that microeukaryotes are highly diverse in coral ecosystems (Ainsworth., 2017). However, due to the bias of universal PCR primers, environmental 18S rRNA gene libraries mainly consist of heterotrophic organisms (Romari and Vaulot, 2004). Flow cytometry has been extensively used to characterize auto- trophic planktonic microeukaryotic populations in natural samples (Marie, 2010), and thus it should be a good complement to 18S rDNA sequencing in discriminating and enumerating environmental microeukaryotes.
The Xisha Islands are located in the northwest part of the South China Sea, surrounded by the Chinese mainland, Nansha Islands, Zhongsha Islands, and Vietnam, which are primarily derived from coral reefs and consist of more than 40 small islands and reefs. The coral-reef system represents the most pristine coral reefs in China (Xu., 2011; Wang., 2018). Unlike those located in close proximity to the mainland, the coral-reef system in Xisha Islands has experienced little anthropogenic impacts because of a great distance (310km) from the mainland and limited accessibility, and thus have considerable and specific biodiversity and ecological values (Xu., 2011; Wu., 2019). Yet now, the diversities and functional potentials of planktonic bacteria and microeukaryotes in the pristine coral-reef system of Xisha Islands are still poorly understood.
In view of the unique environmental conditions (nutrient- poor and organic matter-rich) in the coral-reef ecosystem, we hypothesized that the coral-reef seawater biotope could harbor specific bacterial and mircoeukaryotic populations, which might present a layer or niche patternresponding to the effects of coral reefs. To test the hypothesis, we detected the abundance, composition and distribution of both bacteria and microeukaryotes in surrounding seawaters of the coral-reef system in Xisha Islands of China using the flow cytometry, qPCR and Illumina high throughput sequencing techniques. Simultaneously, the potential ecological roles were profiled based on the information of 16S and 18S rDNA sequencing.
2 Materials and Methods
2.1 Sample Collection and Processing
Seawater samples were collected from the North Reef, Xuande Atoll, Yongle Atoll, Yuzhuo Reef and Huaguang Reef (Fig.1) in Xisha Islands from May 14 to 22, 2019 by a small boat, where a healthy reef ecosystem thrives. The water depths of the sampling region vary from 5.5 to 36.8m and pH from 8.00 to 8.06. Average nutrient concentrations are 0.07, 0.68, and 0.97μmolL−1for PO43−, NO3−, and NH4+, respectively, chlorophyllconcentrations average 0.03μgL−1, and dissolved oxygen 6.61mgL−1(Wu., 2017). Some semi-closed lagoons are developed within the atoll reefs or barrier reefs, which have relative shallower water compared with the outer open ocean, infilled of calcareous sand and coral mud, and are pro- tected from waves. Whereas, the outer reef flats were dominated by live coral covers. We collected seawaters from the outer coral reef flats (S1, S3-S7, S9-S11, S14) and the inner lagoons (S2, S8, S12, S13), respectively, at surface (1m below the surface), middle (middle of the water depth) and bottom (1m above coral reef or lagoon seabed) depths using Niskin bottles. Only surface and bottom waters were obtained at the station S1 and S8 due to the depth restriction, and a total of 40 sam- ples were obtained with 3 independent replicates. Each sample was prefiltered through a 20µm pore size mesh to remove larger debris and plankton. Two milliliters of the prefiltered sample were reserved for flow cytometry analysis and fixed with sterilized gluteraldehyde (1.0% final conc., v/v) (Jiao., 2005). The remaining volume was gently filtered through 0.22µm polycarbonate membrane filters (47mm in diameter; Millipore, USA) for microbial community analyses.

Fig.1 Map locations of the sampling sites in the coral-reef system of Xisha Islands.
2.2 Flow Cytometry Analysis
The cell abundances of,, pico- and nano-eukaryotes as well as heterotro- phic bacteria were quantified using a FACSAriaTM flow cytometer (Becton Dickinson, USA) equipped with a 70 μm nozzle and a laser emitting at 488nm. Procedures were as described by Jiao., (2005), briefly, unstained subsamples were used to enumerate the abundances of, pico- and nano-eukaryotes, and;was distinguished according to orange fluorescence (FL2). 90˚ angle side scatter (SSC) in plots, and pico- and nano-eukaryotes as well aswere identified depending on red fluorescence (FL3). SSC; bacteria were stained by SYBR green I (1μgmL−1final concentration) and identified in plots of FL3. green fluorescence (FL1). Samples for enumeration of autotrophic microeukaryotes were run separately from those for bacteria. 1.002μm beads (Polysciences, Europe) were added to each sample for verification of the equipment. The FACSDiva (v.6.1.3) software was used to estimate the abundance of each cell type.
2.3 DNA Extraction and PCR Amplification
Environmental DNA of seawaters was extracted using the FastDNA SPIN for Soil Kit (MP Biomedical, USA), and then quantified using a Nanodrop 2000c spectro- photometer (ThermoFisher, USA). The ratio of absor- bance at 260nm and 280nm (260/280) is used to assess the purity of DNA, with the ratio of all samples ranging from 1.79 to 1.83.
Bacterial DNA amplification was performed with the 515F/907R primers specific for the V4-V5 hypervariable regions of the 16S rRNA gene (Zhou, 2011). PCR amplification conditions were an initial denaturation at 95 ℃ for 3min, followed by 30 cycles of 95℃ for 30s, 55 ℃ for 30s and 72℃ for 40s, with a final extension at 72 ℃ for 10min. For microeukaryotic DNA amplification, the V4 hypervariable region of the eukaryotic 18S rRNA gene was amplified using the primer set 528F and 706R (Liu., 2020). The PCR conditions were 95℃ for 3 min, followed by 30 cycles of 30s at 95℃, 60℃ for 30s, 72℃ for 30s, and a final extension at 72℃ for 10min.
2.4 High-Throughput Sequencing and Functional Profiling
Three replicate PCR products were pooled and purified with a universal DNA purification kit (Tiangen, China), and then sent to Novogene (Beijing, China) for sequen- cing. Sequencing was performed on an Illumina HiSeq- 2500 platform (Illumina, San Diego, CA) by using a paired-end (2×250bp) protocol.
After sequencing, the raw data was filtered according to barcodes using FLASH (Magoč and Salzberg, 2011) before downstream processing. Sequence processing was conducted with QIIME pipeline (QIIME v1.9.1) (Caporaso., 2010). Reads with length <100bp and quality score <20 were removed. Chimeras were checked and filtered by the UCHIME algorithm (Edgar, 2010). The operational taxonomic units (OTUs) were assigned at a similarity threshold of 97% using UCLUST for both 16S rDNA and 18S rDNA sequences, and singleton (consisting of only one read) OTUs were discarded from the downstream analysis. Taxonomic assignment was assigned using SILVA 132 database at 97% identity. Any 16S OTUs affiliated to ‘chloroplast’ and ‘Archaea’ and 18S OTUs affiliated to ‘metazoa’ were discarded from the final OTU tables (Zhu., 2018). Alpha diversity was analyzed according to the rarefied OTU tables to the fewest number of sequences per sample, and beta diversity was calculated on the normalized OTU tables using thepackage (Robinson., 2009), without rarefying the sequence data.
PICRUSt analysis was conducted to predict the func- tional potential of bacterial communities by the retrieved 16S rRNA data (Langille., 2013). A nearest se- quenced taxon index (NSTI) was used to evaluate the prediction accuracy. Kyoto Encyclopaedia of Genes and Genomes (KEGG) pathways related to enzyme production potentials involved in carbon, nitrogen and sulfur metabolism as well as carbon fixation were classified by hand. The functional structure of microeukaryotes (autotrophs/phototrophs, heterotrophs and mixotrophs) was assessed using a nutrient strategy-based approach as described by Schneider. (2020) and Wang. (2020).
The raw reads in this study have been deposited into the NCBI SRA database with the project accession num- ber PRJNA729119 for bacterial 16S rDNA sequences and PRJNA729187 for microeukaryotic 18S rDNA sequen- ces.
2.5 Co-Occurrence Network Construction
The co-occurrence network was conducted based on the spearman’s rank correlation matrix obtained in WGCNApackage (Langfelder and Horvath, 2008). We selected only those OTUs with average relative abundances more than 0.5% across all samples for network analysis to improve statistical confidence and reduced network complexity. A robust correlation was considered if the spearman’s correlation was statistically significant (<0.001) and the coefficient (||) was ≥0.60. Network visualization and topology resulted from network analysis were performed with the Gephi interactive platform 0.9.2 (https://github.com/gephi/gephi) using undirected network and the Fruchterman-Reingold layout (Bastian., 2009).
2.6 Real-Time PCR Analysis
Real-time quantitative PCR (qPCR) was performed to quantify the copy numbers of 16S rRNA and 18S rRNA genes of the whole bacterial and microeukaryotic com- munities based on SYBR Green I method. All samples were run in triplicate on an ABI 7500 Fast real-time PCR system (Applied Biosystems, USA). Primers used for 16S rRNA gene amplification were 341F and 517R (Muyzer., 1993) and for 18S rRNA gene were the same as amplification for sequencing analysis. The 20μL reaction mixture contained 1μL of each primer, 1μL of template DNA, and FastStart Universal SYBR Green Master mix (Roche, USA). For all amplification reactions, melting curve started at 60℃ with an incremental increase of 0.5℃ up to 95℃. Standard curves were generated with serial dilutions of linearized plasmids (pTZ57R/T, Ther- mo) containing cloned target genes. The qPCR assay efficiencies ranged from 91% to 110%, and the correlation coefficients (2) were all >0.98.
2.7 Statistical Analysis
Mapping of the distributions of bacterial and micro- eukaryotic cell abundances and 16S/18S rDNA copies were conducted using Ocean Data View (Schlitzer, 2002). Beta diversity was calculated to evaluate differences in the whole bacterial and microeukaryotic communities by a non-metric multidimensional scaling (nMDS) based on weighted Bray-Curtis dissimilarities, and the analysis of similarity (ANOSIM) was performed to test for the significance of differences among different water layers (surface, middle and bottom) and ecological niches (coral reefs and lagoons) in PRIMER v.6 (Primer-E, UK). Using the software SPSS 19.0, student’s-test or one-way ANOVA with LSD post-hoc test was performed to assess the differences in cell and gene abundances, diversity indices, major bacterial and microeukaryotic taxa, as well as, potential functions among water layers and ecological niches. All data were tested for normal distribution and log-transformed as necessary to meet the assumption of statistical analyses.
3 Results
3.1 Cell Abundances of Planktonic Bacteria and Microeukaryotes
was ubiquitous and dominated the planktonic autotrophs throughout the coral-reef system of Xisha Islands, with abundance in the range of 5.8×10²to 5.44×10³cellsmL−1seawater (Fig.2, Table 1). The aver- age cell abundance ofin the bottom layer (1.65×10³cellsmL−1) seemed to be higher than those in the middle (1.29×10³cellsmL−1) and surface (1.07×10³cellsmL−1). The lowest abundance ofoccurred in the surface and middle layers of North Reef and the northwest of Xuande Atoll (< 8.5 ×10²cellsmL−1). Picoeukaryotes andwere the second abundant autotrophs, with abundance at the level of 102cellsmL−1. There was little difference in cell abundances of these two populations among three water layers. The hotspot of Picoeukaryotes appeared in Yuzhuo Reef, while the lowest abundance occurred in the northwest of Xuande Atoll. Nanoeukaryotes presented a minor proportion in autotrophs of the system, ranging from 6 to 49cellsmL−1. The heterotrophic bacteria po- pulations ranged from 3.52×10⁴to4.20×105cellsmL−1. All populations detected by the flow cytometry presented slightly higher cell abundance in the outer reef flats than in the inner lagoons (>0.05, Table 1).

Fig.2 Distributions of the cell abundance (cellsmL−1) of pico- and nano-eukaryotes, Synechococcus, and Prochlorococcus, as well as heterotrophic bacteria in the coral-reef system of Xisha Islands.

Table 1 Comparisons of cell abundances of planktonic bacteria and microeukaryotes as well as copy numbers and α-diversity indices of bacterial 16S rRNA and microeukaryotic 18S rRNA gene among water layers (ANOVA test) and ecological niches (t-test) (mean±SE, n>10)
Notes: Significant differences are highlighted in bold (≤0.05); superscripts with different letter indicate significant differences among water layers by LSD tests.
3.2 Copies of Bacterial 16S rRNA and Micro- eukaryotic 18S rRNA Gene
The total bacterial 16S rRNA gene was generally more abundant than microeukaryotic 18S rRNA gene: the for- mer had 2.27×10⁴to 4.20×10⁵copies in a milliliter of seawater across all samples investigated, which was about 10 times higher than the later (3.87×10²to 3.11×10⁴copiesmL−1) (Fig.3). Bacterial 16S rRNA gene copies distributed evenly among the three layers, while microeukaryotic 18S rRNA gene was more abundant in the middle and bottom layers, although not significantly (ANOVA,>0.05, Fig.3 and Table 1). For the niche distribution, the depth-weighted average copies of 16S rRNA gene were much higher in the coral reef flats than in lagoons ((1.60±0.22). (0.39±0.08)×105copiesmL−1,-test,=0.003, Table 1).
3.3 Microbial Diversity and Community Composition
Illumina sequencing yielded 3549442 raw reads of bacterial 16S rDNA from all 40 samples. After quality control and removing non-objected sequences, 2500076 16S rDNA clean reads remained. Following rarefying OTU tables to the smallest number of sequences per sample (45648 reads), a total of 14897 bacterial OTUs were obtained at 97% sequence identity. In total 2589807 18S rDNA filtered reads were obtained from 40 samples, with 52568 to 69454 reads per sample. By rarefying to a depth of 46966 reads per sample, we detected 12234 OTUs at 97% sequence similarity threshold.
Bacterial OTUs varied from 456 to 1428 and tended to decrease from the surface to the bottom layer, while eukaryotic OTUs fluctuated from 1634 to 2323 (Table 1). Statistically, there was significantly higher bacterial Shannon and Simpson indices in the surface layer than in the middle and bottom layers (ANOVA,<0.05, Table 1), but no difference was observed between reefs and lagoons (-test,>0.05). For microeukaryotes, there was no significant difference in all α-diversity indices among layers and niches (>0.05, Table 1).
Taxonomic assignment indicated that Proteobacteria and Cyanobacteria were the two most abundant bacterial phyla, accounting for 48.79% and 28.52% of the total bacterial sequence abundance, respectively. Most Proteobacteria were affiliated to Alphaproteobacteria (average relative abundance: 38.28%, mainly including SAR11, Rhodobacterales and Puniceispirillales), and Gammaproteobacteria (10.26%, mostly Alteromonadales and SAR 86). Deltaproteobacteria (0.24%) was relatively uncommon. Synechococcales (19.91%) was the most dominant order of Cyanobacteria. Other major bacterial phyla included Bacteroidetes (15.03%), Actinobacteria (5.63%), and Marinimicrobia (1.48%). The remaining taxa/lineages were relatively minor or rear components of the communities with mean relative abundance <1% in all samples (Fig.4a).

Fig.3 Distributions of bacterial 16S rRNA and microeukaryotic 18S rRNA gene copy numbers (copiesmL−1) in the coral- reef system of Xisha Islands.

Fig.4 Relative abundance of the dominant taxa of bacterial community at the order level (a) and microeukaryotic community at the class level (b).
The reads affiliated to the SAR group represented more than 70% of the total 18S rDNA reads, in which Alveolata accounted for 61.33%, Stramenopiles made up 10.80%, while Rhizaria only 1.72%, followed by Archaeplastida (8.09%, represented mainly by Chloroplastida). The other supergroups,.., Prymnesiophyceae, Cryptomonadales, Picozoa, Telonema, Centrohelida, and Opisthokonta (mostly fungi) collectively contributed only ca. 3.92% of total reads (Fig.4b).
3.4 Distribution Patterns of Bacterial and Microeukaryotic Communities
The nMDS results (Fig.5)showed that neither bacterial nor microeukaryotic community exhibited distinct layer or niche pattern. The ANOSIM analyses further supported the non-significance of both bacterial and microeukar- yotic communities among layers and niches (>0.05). To explore whether some individual taxa were different among layers or ecological niches, their relative abun- dances were compared (Tables 2 and 3). Bacterial major taxa varied greatly among samples. Generally, the relative abundance of Rhodobacterales and Flavobacteriales presented a decrease trend from surface to bottom, whileandshowed increased frequency with depth, though no statistical difference was supported (Table 2, ANOVA,>0.05). SAR 86 clade was significantly enriched in the middle water (LSD,<0.05), and Vibrionaceae held modestly higher abundance in surface layers than in the middle and bottom (=0.095). Additionally, SAR 86 clade prevailed in the lagoons (Table 2,-test,=0.04).
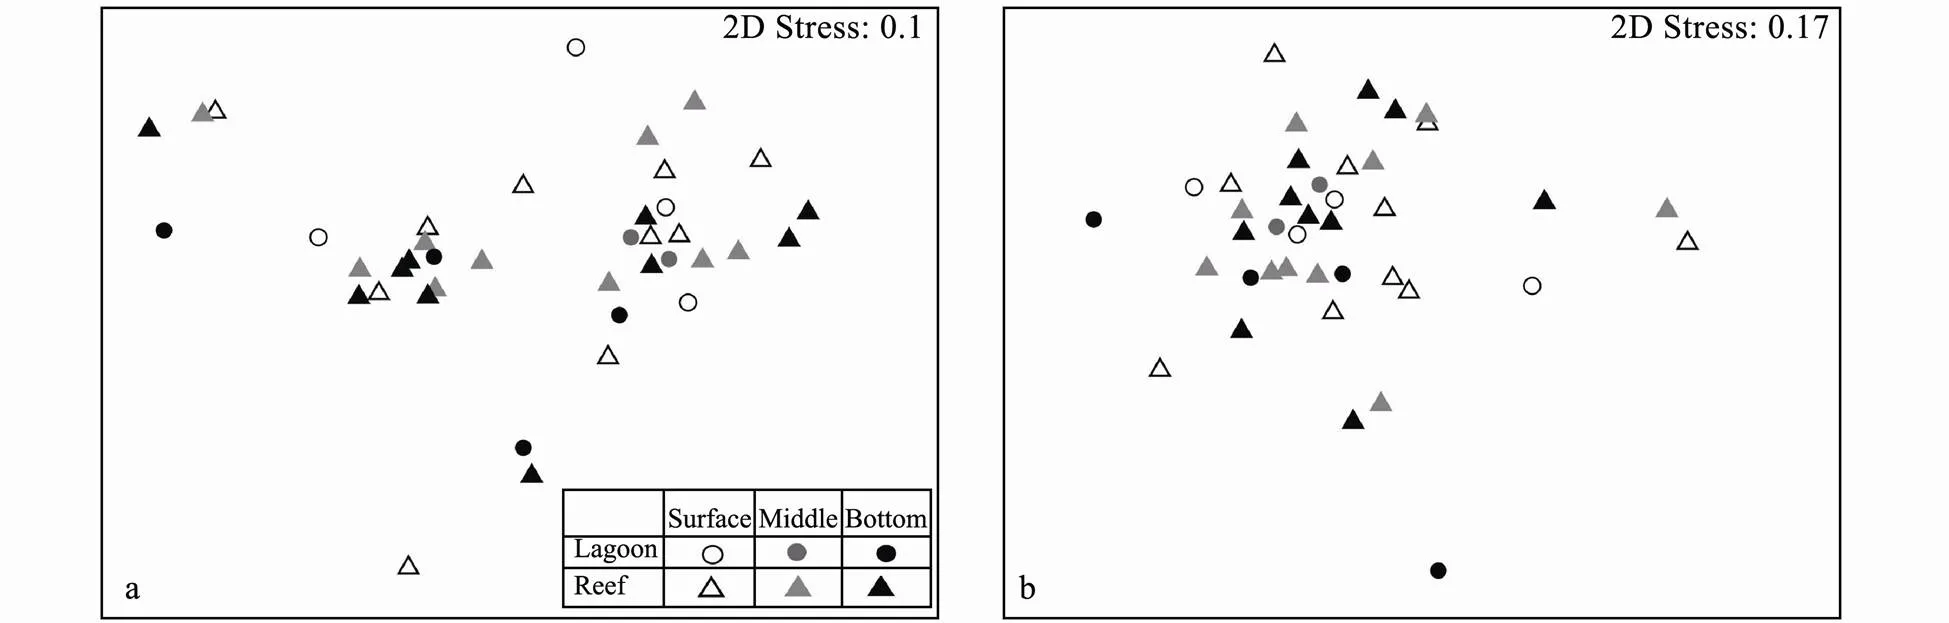
Fig.5 Plots of nMDS analyses based on Bray-Curtis distance matrices, showing patterns of β-diversity for bacterial (a) and microeukaryotic (b) communities.

Table 2 Comparison of relative abundances (mean ±SE in percentage, %) of major bacterial taxa among water layers (ANOVA test) and ecological niches (t-test) in the coral-reef system of Xisha Islands
Notes: Taxa ranked at class and significant differences (≤0.05) are highlighted in bold; superscripts with different letter indicate significant differences (<0.05) among water layers by LSD tests.

Table 3 Comparison of relative abundances (mean ± SE in percentage, %) of major microeukayotic taxa among water layers and ecological niches in the coral-reef system of Xisha Islands
Notes: Taxa ranked at superphyla and phyla and significant differences (≤0.05) are annotated in bold; superscripts with different letter indicate significant differences (<0.05) among water layers by LSD tests.
As for microeukaryotes (Table 3), Alveolata peaked in the middle layer with the family Dinophyceae and Syn- diniales well represented in all samples. MAST-3 affi- liated to Stramenopiles was significantly enriched in lagoons (-test,=0.024). The relative abundance of Haptophyta in the surface and middle layers was significantly higher than that in the bottom (LSD,<0.05). However, the relative abundance of Picozoa decrease with depth (<0.05). In addition, Picozoa and Incertae Sedis showed higher relative abundance in lagoons compared with corals (-test,<0.05). Other groups had no statistical difference among layers and niches (>0.05).
3.5 Potential Function Profiles of Bacterial and Microeukaryotic Communities
Based on PICRUSt analysis, the NSTI scores of each sample varied from 0.06 to 0.18 (mean 0.11), suggesting that the predictions were accurate and reliable (Langille., 2013). There were more than 10% of the whole reads clustered into carbon metabolism according to KEGG orthology database, in which amino sugar and nu- cleotide sugar metabolism, pyruvate metabolism, propanoate metabolism and glycolysis/gluconeogenesis were the major metabolic pathways, accounting for approximately 43% of carbon metabolism. Statistically, all carbon metabolic pathways showed insignificant difference among water layers and ecological niches (>0.05) (Fig.6a). In terms of carbon fixation, the reductive citrate cycle, dicarboxylate-hydroxybutyrate cycle, reductive acetyl-CoA pathway, phosphate acetyltransferase-acetate kinase pathway, reductive pentose phosphate cycle (Calvin cycle), CAM (Crassulacean acid metabolism), and C4- dicarboxylic acid cycle gluconeogenesis were detected, in which carbon fixation by chemoautotrophic prokaryotes rather than photosynthesis organisms dominated (Fig.6a).
In sulfur metabolism, high assimilatory sulfate reduc- tion activity (referring to the relative abundance of,,andgenes) was detected, besides, genes related to dissimilatory sulfate reduction process (gene, encoding adenylylsulfate reductase) were also observed. Similarly, there was no significantly difference in sulfur metabolic potential among layers and niches (>0.05) (Fig.6b). Among 16 nitrogen metabolism functional genes predicted (Fig.6c),(encoding ferredoxin-ni- trate reductase),(encoding ferredoxin-nitrite reductase), and(encoding nitrite reductase (NADH) large subunit) genes presented the highest relative abundance, indicating an intensive nitrate reduction potential in the ecosystem. In addition, genes involved in nitrogen fixation (), nitrification () and denitrification (,and) commonly existed in thebacterial community. The relative abundance of(involved in the reduction of nitrate to nitrite in dissimilatory nitrate reduction pathway),(nitrite to ammonia),(nitrite to nitric oxide) and(N2O to N2) genes were significantly higher in surface and middle layers than in the bottom, whilegene (referred to the reduction of nitrate to nitrite in assimilatory nitrate reduction pathway) was enriched in the bottom layer (ANOVA,<0.05) (Fig.6c).
The function profile of microeukaryotes was accessed in terms of their nutrient strategies. The proportions of mixotrophs and heterotrophs varied from 29.44% to 56.92% and 24.46% to 43.65%, respectively, in the mi- croeukaryotic communities. In contrast, the percentage of phototrophs was much lower (7.66% to 24.15%) (Fig.7). Regarding layer and niche comparisons, no significant difference in three nutritional strategies was observed (>0.05) (Fig.7).

Fig.6 The relative abundance of predicted bacterial metabolic pathways and functional genes related to carbon metabolism and carbon fixation (a), as well as sulfur (b), and nitrogen (c) metabolisms in three water layers and two ecological niches samples. The bold values indicate significant differences in grouping samples (ANOVA or t-test, P<0.05).

Fig.7 Comparison of functional composition (relative abundance, %) of microeukaryotic communities among water layers and ecological niches by ANOVA and t-tests. No statistically significant differences (P>0.05) was observed.
3.6 Interactions Among Bacteria and Microeukaryotes
The co-occurrence network consisted of 57 nodes and 93 links, and its average degree and average clustering coefficient were 3.263 and 0.668, respectively. The edges showing more positive (82.8%, co-presence) links than negative (17.2%, mutual exclusion) in the network (Fig.8). Most of the links occurred within bacteria or microeu- karyotes, showing a strong intra-kingdom correlation. Within bacterial communities, members of SAR11 and Flavobacteriaceae showed a high proportion of inter- family positive correlations, while members of Actinomarinaceae and SAR 86 exhibited more positive correlations with other bacterial families. Cyanobiaceae negatively correlated with SAR11, Flavobacteriaceae and Rhodobacteraceae. The microeukaryotic communities in the network was dominated by Dinophyceae and Syn- diniales, and there was high frequency of biological interactions between these two groups (Fig.8).

Fig.8 Network analysis of interactions among seawater bacteria and microeukaryotes in the coral-reef system of Xisha Islands. The size of the node represents the relative abundance of an independent OTU and is labeled at the family level, and the nodes are sorted and colored by kingdom with bacteria in purple and microeukaryotes in blue. The edges show the correlations between two nodes, and the red edges indicate a positive interaction and blue ones denote a negative interaction.
4 Discussion
4.1 Higher Abundances of both Bacteria and Micro- eukaryotes Were Detected in the Outer Coral Reef Flats than in the Inner Lagoons
In this study, we firstly presented bacterial and micro- eukaryotic abundances integrating flow cytometry with qPCR techniques in the coral-reef system of Xisha Islands. According to flow cytometry, the total cell abundance of seawater bacteria (including heterotrophic bacteria as well asand) was approximately at the level of 105cellsmL−1and that of autotrophic microeukaryotes (pico- and nano-eukaryotes) roughly 102cellsmL−1. Based on qPCR, the 16S rRNA gene copies of the total bacteria ranged from 2.27×10⁴to 4.20×10⁵copiesmL−1and18S rRNA gene copies was in the range of 3.87×10²to 3.11×10⁴copiesmL−1. The abundances were 1–2 orders of magnitude less than those from other regions of the South China Sea (Liu., 2007; Hu., 2021), but were within low ranges observed in other coral reef waters, such as the Ram Head coral reef (Weber and Apprill, 2020), the Paopao Bay reef (Nelson., 2011), and Nelly Bay reef (Seymour., 2005). This plankton depletion observed over reef systems relative to offshore waters could be attributed to grazing by corals or their associated benthic organisms (Nelson., 2011; Tout., 2014; McNally., 2017).
was the most abundant autotrophs in terms of the cell number (Fig.2). In line with our results, this small coccoid unicellular cyanobacteria usually do- minated in oligotrophic coral reef waters (Charpy and Blanchot, 1996; Charpy., 2012). Compared to other phytoplankton, its cells have a low P requirement and their small size (high surface to volume ratio) facilitates efficient nutrient acquisition (Biller., 2014).abundance appeared an increase trend from the surface water to the bottom (5.5–36.8m) (Fig.2, Table 1). Similar depth distribution pattern was observed at the Southeast Asia Time-series Station (SEATS) in the Nor- thern South China Sea, where the maximumcell abundance occurred in sub-surface waters around 50m (Liu., 2007). Vaulot. (1995) found that the growth rates ofwere maximal at 30m and decreased toward the surface and the bottom in the equatorial Pacific Ocean. The cell cycle ofis strongly entrained to the diel light-dark cycle and the cell division occurs at night (Vaulot., 1995). Possibly, light intensity directly controlls the cell cycle and cell division takes place at sub-surface depths where less light is available. It’s also possible that the delay of cell division in the surface layer may be a protective mechanism to avoid exposing DNA to high irradiances (Vaulot, 1995).
In the present study, both bacterial and microeukaryotic abundances were generally higher in the outer reef flats compared to the inner lagoons (Table 1). Coral reefs are highly productive environments. Coral-derived dissolved organic matter and nutrients can induce a rapid increase in bacterial abundance (Nakajima., 2015; Silveira., 2017). Previous studies have reported that bacterial doubling times was up to 50 times faster on reef flats than those observed in the open oceans (Silveira, 2017). Increased bacterial growth further caused the productivity of bacterivorous protists (microeukaryotes) (Nakajima., 2017). Inversely, some studies showed lessin reef regions compared to sandy bottom lagoons (Naumann., 2009; Patten.,2011), sincewas grazed upon by nearby reef organ- isms or trapping by coral mucus. In this study, the cell abundances ofwere equivalent between reefs and lagoons (Table 1), possibly suggesting a balance between feeding and predation ofin the coral reef system
4.2 Low Bacterial Diversities and Specific Bacterial and Microeukaryotic Lineages Were Associated with Coral Reefs
SAR11, Synechococcales and Flavobacteriales domi- nated in the bacterial populations of the coral-reef system (Fig.4). Besides, Rhodobacterales, Alteromonadales and Actinomarinales (an order of Actinobacteria) also repre- sented a significant proportion (3%–7%) across all samples. These populations were common in coral reef waters with variable percentages (Gaidos., 2011; McDevitt-Irwin.,2017; McNally, 2017). Through mesocosm experiments, McNally. (2017) found that, SAR11 and Rhodobacteraceae cells are preferentially removed when corals are present, indicating that these groups were selectively grazed by the coral holobionts. While when corals were removed, their exudates promoted the growth of SAR11 and Rhodobacteraceae (McNally., 2017). SAR11 has been reported to have a high growth rate, and dominated the assimilation of dissolved amino acids, glucose and dimethylsulfoniopropionate (DMSP) (Malmstrom., 2005), all of which were important components of the coral mucus (Haydon., 2018). Rhodobacterales are generally referred to as copiotrophs, which represent a significant but variable proportion (5%–50%) of the coral microbiota and grow on coral exudates (Luo., 2021). Kelly. (2014) found that microbiomes of reefs with higher coral cover had higher abundances of Rhodobacterales, whe- reas those of algae-dominated reefs had higher abundances of Alteromonadales and Vibrionales, suggesting Rhodobacterales was mostly associated with healthy coral reefs. However, high relative abundances of Rhodobacteraceae (a family within Rhodobacterales) have been usually found in waters of reefs in poor health or under stresses, such as algal blooms and thermal stress (McDevitt-Irwin., 2017; Glasl., 2019; Pootak- ham., 2019). Flavobacteriales can degrade a variety of organic matter, which was generally associated with marine particles (Osterholz., 2016). It could be an opportunistic pathogen for coral given it’s a large percentage in disease associated with corals (Gignoux-Wolf- sohn and Vollmer, 2015). Studies showed that healthy corals harbor more abundant Actinobacteria than their diseased counterparts (de Castro., 2010). They can secrete a variety of secondary metabolites against other microbes (Mahmoud and Kalendar, 2016).
We observed a declining trend for potential pathogens Flavobacteriale and Vibrionaceae from the surface to the bottom layer (Table 2). Additionally, the Shannon and Simpson indices of bacterial communities significantly decreased with depth (Table 1). In the shallow euphotic waters, the depth-decay of potential pathogens and bacterial diversities should be related to the close proximity to corals. In the bottom water, the coral-associated beneficial microbes can antagonize pathogens (Glasl., 2019). In addition, corals select their associated microbes leading to relative lower diversity around them (McDe- vitt-Irwin, 2017), and the diversity would increase when invasions disrupted the coral associated microbiome and facilitate an invasion of microbes not typically resident in coral-reef systems (Morrow., 2012; Zaneveld., 2016).
Notably, the relative abundance of(about 5%) was much lower than that of(more than 20%)depending on 16S rDNA sequencing (Table 2), which was contrast to the flow cytometry data.One possible reason was that DNA extraction and univer- sal primer bias led to an underestimate ofin this study (Rocap, 2002). For another,has twice as many 16S rDNA copies as(Strehl, 1999; Sudek, 2015), resulting in the overestimation ofbiomass based on sequencing. Therefore, the incorporation of flow cytometry and molecular techniques was necessary in evaluating the abundance of bacterial communities in aquatic systems.
The microeukaryotic communities was absolutely do- minated by Alveolata with Dinophyceae and Syndiniales common in all samples. Similarly, a study in the Taiwanese coral reef system also found high proportion of Dinophyceae and Syndiniales (Cleary, 2019). Inversely, in the mid-region of the South China Sea, Rhizaria represented over half of the microeukaryotic communities, followed by Alveolata and Opisthokonta (Xu, 2017). These results highlighted specific microeukaryotic communities in the coral-reef systems. The genusaccounted for the majority of Dinophyceae (Table 3). Dinophyceae has been verified to use dissolve organic matter to compensate for deficiencies in inorganic nutrients in environments, and their mixotrophic strategies can promote population growth in nutrient-restricted environments (Ribalet., 2015). Moreover, it has been found thatcan penetrate the cell membrane of prey for nutrition in oligotrophic environments (Jeong, 2010). Syndiniales are ubiquitous parasites of protist that infect a wide range of hosts, including dinoflagellates (Guillou., 2008). High frequency of positive Syndiniales-Dinophyceae associations as determined through the co-occurrence network analysis (Fig.8), implying flexible parasite-host infection dynamics in the system. Interestingly, Picozoa was found to be significantly enriched in lagoons (Table 3). Picozoa are heterotrophic and feed on small (<150 nm) particles instead of bacteria by a novel fluid-phase, bulk flow uptake mechanism (Seenivasan., 2013). Coral reef lagoons have generally been regarded as sinks for organic matter exported from productive reef flats, and high concentration of suspended organic particulate was detected in the lagoons (Charpy and Charpy-Roubaud, 1991). These organic particulates could strongly stimulated the growth of Picozoa.
4.3 Adaptation of Bacteria and Microeukaryotes to the Nutrient-Poor and Organic Matter-Rich Environment in Coral-Reef Systems
The ecological adaptability of seawater microbes to the unique coral-reef environment has been scarcely docu- mented. In this study, the PICRUSt analysis, a very pro- mising strategy to metagenomic analysis of functional genes from various environmental microbiota (Langille., 2013; Polónia., 2014; Ye., 2021), was adopted to predict the bacterial function based on 16S rRNA gene sequences. Fueled by the coral-derived orga- nic matter, various heterotrophic bacteria flourish around corals. The genes involved in degradation of various carbon sources were detected,including hemicellulose, cellulose, starch, and lignin. Traditionally, it was thought that phytoplankton, symbiotic zooxanthellae, seagrass, and macro- and micro-algae contribute to production of fixed carbon in the coral reef systems (Alldredge., 2013). However, current evidence reveals that the abundant and diverse prokaryotic communities in the system also play an important role in carbon fixation through multiple processes (Morrow., 2015). In this study, the genes involved in chemoautotrophic bacterial carbon oxidation were much higher than those in photosynthesis (Fig.6a), implying that bacterial carbon oxidation contributed importantly to the primary production of the coral-reef system. Active dissimilatory sulfate reduction (,,andgenes) process were detected, suggesting that the coral ecosphere is pop by anoxic or microaerobic micro-environments where sulfate reduction occurs, consistent with results of other studies that have investigated oxygen dynamics close to corals (Wangpra- seurt., 2012).
In nitrogen cycling, we detected genes involved in nitrogen fixation, nitrification, assimilatory/dissimilatory nitrate reduction, and denitrification. In the oligotrophic water, the growth and density ofwithin the coral host is highly dependent on the fixed nitrogen provided by diazotrophic bacteria. It was reported that up to 11% of nitrogen to coral reef benthic primary producer is provided by diazotrophy (Cardini., 2014). However, excess nitrogen can induce P starvation of zooxanthellae and increase bleaching susceptibility (Wiedenmann, 2013). Nitrification may effectively reduce the amount of nitrogen available forgrowth (Wafar, 1990). In addition, the complete denitrification process, reducing nitrate to N2, may help corals to survive in elevated nutrient conditionsSimultaneously, the nitrate reduction may serve as a way to retain nitrogen within the system. These nitrogen transformation processes together sustained a nitrogen balance in the coral systems.
Albeit our predictions were reliable based on the NSTI scores (Langille., 2013), some limitations in PICR USt analysis should be noted: 1) the reference genome database available for PICRUSt analysis cannot fully cover the microbial functions; 2) it is not accurate enough to differentiate members at the species level with limited functional information restricted by the resolution of the 16S technique; 3) the amplification biases may lead to inaccuracy of the predicting results. Therefore, further validation should be performed in future studies using methods such as metagenomicsc, transcriptomics, proteomics and/or metabolomics to better understand the functions of bacterial community in coral-reef systems.
Interestingly, within microeukaryotic communities, mi- xotrophy was the most important trophic strategy in the coral-reef system. Mixotrophs are often thought to be adapted to oligotrophic environments (Hartmann., 2012; Edwards, 2019). In coral reef systems, the nutrient limitation suppresses pure autotrophs, but mixotrophs can obtain nutrients from their preys. In addition, mixotrophs can ‘farm’ bacteria in the oligotrophic waters, since they release dissolved organic matter through photosynthesis that supports bacterial growth. On the other hand, preys are also limited in the coral system, since many bacterial and small eukaryotic preys are grazed by corals. Mixo- trophs may outcompete heterotrophs because they can retain more nutrients from preys along with the organic carbon obtained through photosynthesis (Leles., 2018).
5 Conclusions
In this study, some primary researches on the abundance, composition, distribution and functional adaption of seawater bacteria and microeukaryotes in the pristine coral-reef system of Xisha Islands were carried out. Based on flow cytometry and qPCR techniques, we found that the abundances of water bacteria and microeukaryotes were generally higher in outer coral reefs compared with inner lagoons. The bacterial community held substantially lower diversity in the bottom waters (close to corals) than in surface and middle waters. Bacteria was dominated by SAR11, Flavobacteriales, and, while Alveolata represented most of the micro- eukaryotic communities. To adapt to the unique coral-reef environment (nutrient-poor and organic matter-rich), some specific ecological adaptive mechanisms could be evolved in seawater bacteria and microeukaryotes, for example, bacterial nitrogen fixation and nitrate reduction were active in the system, and mixotrophy was the most important trophic strategy in the microeukaryotic communities. Further, the composition and potential function of archaea in the coral-reef system will be concerned on, since their crucial roles in nutrient cycling of the system have been documented recently (Polónia., 2015, 2016).
Acknowledgements
This work was supported by the National Key Research and Development Program of China (No. 2018YF C1406501), the Strategic Priority Research Program of the Chinese Academy of Sciences (No. XDA23050303), the National Natural Science Foundation of China (Nos. 41676154, 41976115), and the Key Research Program of Frontier Sciences of CAS (Nos. QYZDB-SSW-DQC013, QYZ DB-SSW-DQC041).
Ainsworth, T. D., Fordyce, A. J., and Camp, E. F., 2017. The other microeukaryotes of the coral reef microbiome., 25 (12): 980-991.
Alldredge, A. L., Carlson, C. A., and Carpenter, R. C., 2013. Sources of organic carbon to coral reef flats., 26 (3): 108-113.
Allers, E., Niesner, C., Wild, C., and Pernthaler, J., 2008. Micro- bes enriched in seawater after addition of coral mucus., 74 (10): 3274-3278.
Bastian, M., Heymann, S., and Jacomy, M., 2009. Gephi: An open source software for exploring and manipulating networks.. San Jose, California, 12pp.
Biller, S., Berube, P., Lindell, D., and Chisholm, S., 2014.: The structure and function of collective diversity., 13: 13-27.
Caporaso, J. G., Kuczynski, J., Stombaugh, J., Bittinger, K., Bushman, F. D., Costello, E. K.,., 2010. QIIME allows analysis of high-throughput community sequencing data., 7 (5): 335-336.
Cardini, U., Bednarz, V. N., Foster, R. A., and Wild, C., 2014. Benthic N2fixation in coral reefs and the potential effects of human-induced environmental change., 4 (9): 1706-1727.
Charpy, L., and Blanchot, J., 1996.contribu- tion to phytoplankton biomass and production of Takapoto atoll ()., 319 (2): 131-137.
Charpy, L., and Charpy-Roubaud, C., 1991. Particulate organic matter fluxes in a Tuamotu atoll lagoon (French Polynesia)., 71: 53-63.
Charpy, L., Casareto, B. E., Langlade, M. J., and Suzuki, Y., 2012. Cyanobacteria in coral reef ecosystems: A review., 2012: 259571.
Cleary, D. F. R., 2019. A comparison of microeukaryote communities inhabiting sponges and seawater in a Taiwanese coral reef system., 69 (8): 861-866.
de Castro, A. P., Araújo, S. D., Araújo Jr., S. D., Reis, A. M. M., Moura, R. L., Francini-Filho, R. B.,., 2010. Bacterial community associated with healthy and diseased reef coralfrom eastern Brazil., 59 (4): 658-667.
Edgar, R. C., 2010. Search and clustering orders of magnitude faster than BLAST., 26 (19): 2460-2461.
Edwards, K. F., 2019. Mixotrophy in nanoflagellates across environmental gradients in the ocean., 116 (13): 6211-6220.
Gaidos, E., Rusch, A., and Ilardo, M., 2011. Ribosomal tag pyrosequencing of DNA and RNA from benthic coral reef microbiota: Community spatial structure, rare members and nitrogen-cycling guilds., 13 (5): 1138-1152.
Gignoux-Wolfsohn, S. A., and Vollmer, S. V., 2015. Identification of candidate coral pathogens on white band disease-in- fected staghorn coral., 10 (8): e0134416.
Glasl, B., Bourne, D. G., Frade, P. R., Thomas, T., Schaffelke, B., and Webster, N. S., 2019. Microbial indicators of environmental perturbations in coral reef ecosystems., 7 (1): 94.
Guillou, L., Viprey, M., Chambouvet, A., Welsh, R. M., Kirkham, A. R., Massana, R.,., 2008. Widespread occurrence and genetic diversity of marine parasitoids belonging to Syndiniales (Alveolata)., 10 (12): 3349-3365.
Haas, A. F., Nelson, C. E., Rohwer, F., Wegley-Kelly, L., Quistad, S. D., Carlson, C. A.,., 2013. Influence of coral and algal exudates on microbially mediated reef metabolism., 1: e108.
Hartmann, M., Grob, C., Tarran, G. A., Martin, A. P., and Burkill, P. H., 2012. Mixotrophic basis of Atlantic oligotrophic ecosystems., 109 (15): 5756-5760.
Haydon, T. D., Seymour, J. R., and Suggett, D. J., 2018. Soft corals are significant DMSP producers in tropical and temperate reefs., 165 (7): 109.
Hu, C. Q., Xu, J., Li, X. F., Shi, Z., and Li, R. H., 2021. Environmental regulations on bacterial abundance in the South China Sea inferred from regression models., 774: 146315.
Jensen, S., Bourne, D. G., Hovland, M., and Murrell, J. C., 2012. High diversity of microplankton surrounds deep-water coral reef in the Norwegian Sea., 82 (1): 75-89.
Jeong, H. J., Yoo, Y. D., Kim, J. S., Seong, K. A., Kang, N. S., and Kim, T. H., 2010. Growth, feeding and ecological roles of the mixotrophic and heterotrophic dinoflagellates in marine planktonic food webs., 45 (2): 65-91.
Jiao, N. Z., Yang, Y. H., Hong, N., Ma, Y., Harada, S., Koshikawa, H.,., 2005. Dynamics of autotrophic picoplankton and heterotrophic bacteria in the East China Sea., 25 (10): 1265-1279.
Kelly, L. W., Nelson, C. E., Haas, A. F., Naliboff, D. S., Calhoun, S., Carlson, C. A.,., 2019. Diel population and functional synchrony of microbial communities on coral reefs., 10: 1691.
Kelly, L. W., Williams, G. J., Barott, K. L., Carlson, C. A., Dins- dale, E. A., Edwards, R. A.,., 2014. Local genomic adaptation of coral reef-associated microbiomes to gradients of natural variability and anthropogenic stressors., 111 (28): 10227-10232.
Langfelder, P., and Horvath, S., 2008. WGCNA: An R package for weighted correlation network analysis., 9: 559.
Langille, M. G., Zaneveld, J., Caporaso, J. G., McDonald, D., Knights, D., Reyes, J. A.,., 2013. Predictive functional profiling of microbial communities using 16S rRNA marker gene sequences., 31 (9): 814-821.
Leles, S., Polimene, L., Bruggeman, J., Blackford, J., Ciavatta, S., Mitra, A.,., 2018. Modelling mixotrophic functional diversity and implications for ecosystem function., 40 (6): 627-642.
Lema, K. A., Willis, B. L., and Bourne, D. G., 2012. Corals form characteristic associations with symbiotic nitrogen-fixing bac- teria., 78 (9): 3136.
Lesser, M. P., Mazel, C. H., Gorbunov, M. Y., and Falkowski, P. G., 2004. Discovery of symbiotic nitrogen-fixing cyanobacteria in corals., 305 (5686): 997.
Lesser, M. P., Stat, M., and Gates, R. D., 2013. The endosymbiotic dinoflagellates (sp.) of corals are parasites and mutualists., 32 (3): 603-611.
Liu, H. B., Chang, J., Tseng, C. M., Wen, L. S., and Liu, K. K., 2007. Seasonal variability of picoplankton in the northern South China Sea at the SEATS station., 54 (14): 1602- 1616.
Liu, K. S., Liu, Y. Q., Hu, A. Y., Wang, F., Chen, Y. Y., Gu, Z. Q.,., 2020. Different community assembly mechanisms underlie similar biogeography of bacteria and microeukaryotes in Tibetan Lakes., 96 (6): fiaa 071.
Luo, D. L., Wang, X. J., Feng, X. Y., Tian, M. D., Wang, S. S., Tang, S. L.,., 2021. Population differentiation of Rhodobacteraceae along with coral compartments., (2): 22-25.
Magoč, T., and Salzberg, S. L., 2011. FLASH: Fast length adjustment of short reads to improve genome assemblies., 27 (21): 2957-2963.
Mahmoud, H. M., and Kalendar, A. A., 2016. Coral-associated actinobacteria: Diversity, abundance, and biotechnological potentials., 7: 396-407.
Malmstrom, R. R., Cottrell, M. T., Elifantz, H., and Kirchman, D. L., 2005. Biomass production and assimilation of dissolved organic matter by SAR11 bacteria in the Northwest Atlantic Ocean., 71 (6): 2979-2986.
Marie, D., Shi, X. L., Rigaut-Jalabert, F., and Vaulot, D., 2010. Use of flow cytometric sorting to better assess the diversity of small photosynthetic eukaryotes in the English Channel., 72 (2): 165-178.
McDevitt-Irwin, J. M., Baum, J. K., Garren, M., and Vega Thurber, R. L., 2017. Responses of coral-associated bacterial communities to local and global stressors., 4: 262.
McNally, S. P., Parsons, R. J., Santoro, A. E., and Apprill, A., 2017. Multifaceted impacts of the stony coralon picoplankton abundance and community composition., 62 (1): 217-234.
Morrow, K. M., Bourne, D. G., Humphrey, C., Botté, E. S., Laffy, P., Zaneveld, J.,., 2015. Natural volcanic CO2seeps reveal future trajectories for host-microbial associations in corals and sponges., 9 (4): 894- 908.
Morrow, K. M., Moss, A. G., Chadwick, N. E., and Liles, M. R., 2012. Bacterial associates of two caribbean coral species reveal species-specific distribution and geographic variability., 78 (18): 6438.
Muyzer, G., de Waal, E. C., and Uitterlinden, A. G., 1993. Profiling of complex microbial populations by denaturing gradient gel electrophoresis analysis of polymerase chain reaction-amplified genes coding for 16S rRNA., 59 (3): 695-700.
Nakajima, R., Tanaka, Y., Guillemette, R., and Kurihara, H., 2017. Effects of coral-derived organic matter on the growth of bacterioplankton and heterotrophic nanoflagellates., 36 (4): 1171-1179.
Nakajima, R., Tanaka, Y., Yoshida, T., Fujisawa, T., Nakayama, A., Fuchinoue, Y.,., 2015. High inorganic phosphate concentration in coral mucus and its utilization by heterotrophic bacteria in a Malaysian coral reef., 36 (3): 835-841.
Naumann, M. S., Richter, C., el-Zibdah, M., and Wild, C., 2009. Coral mucus as an efficient trap for picoplanktonic cyanobacteria: Implications for pelagic-benthic coupling in the reef ecosystem., 385: 65-76.
Nelson, C. E., Alldredge, A. L., McCliment, E. A., Amaral- Zettler, L. A., and Carlson, C. A., 2011. Depleted dissolved organic carbon and distinct bacterial communities in the water column of a rapid-flushing coral reef ecosystem., 5 (8): 1374-1387.
Nelson, C. E., Goldberg, S. J., Kelly, L. W., Haas, A. F., and Smith, J. E., 2013. Coral and macroalgal exudates vary in neutral sugar composition and differentially enrich reef bacterioplankton lineages., 7 (5): 962-979.
Osterholz, H., Singer, G., Wemheuer, B., Daniel, R., Simon, M., Niggemann, J.,., 2016. Deciphering associations between dissolved organic molecules and bacterial communities in a pelagic marine system., 10 (7): 1717-1730.
Patten, N. L., Wyatt, A. S. J., Lowe, R. J., and Waite, A. M., 2011. Uptake of picophytoplankton, bacterioplankton and virioplankton by a fringing coral reef community (Ningaloo Reef, Australia)., 30 (3): 555-561.
Peixoto, R. S., Rosado, P. M., Leite, D. C., Rosado, A. S., and Bourne, D. G., 2017. Beneficial microorganisms for corals (BMC): Proposed mechanisms for coral health and resilience., 8: 341-352.
Polónia, A. R., Cleary, D. F., Duarte, L. N., de Voogd, N. J., and Gomes, N. C. M., 2014. Composition of archaea in seawater, sediment, and sponges in the Kepulauan Seribu reef system, Indonesia., 67: 553-567.
Polónia, A. R., Cleary, D. F., Freitas, R., Coelho, F. J., de Voogd, N. J., and Gomes, N. C. M., 2016. Comparison of archaeal and bacterial communities in two sponge species and seawater from an Indonesian coral reef environment., 29: 69-80.
Polónia, A. R., Cleary, D. F., Freitas, R., de Voogd, N. J., and Gomes, N. C. M., 2015. The putative functional ecology and distribution of archaeal communities in sponges, sediment and seawater in a coral reef environment., 24 (2): 409-423.
Pootakham, W., Mhuantong, W., Yoocha, T., Putchim, L., Jomchai, N., Sonthirod, C.,., 2019. Heat-induced shift in coral microbiome reveals several members of the Rhodobacteraceae family as indicator species for thermal stress in., 8 (12): e935.
Priess, K., Le Campion-Alsumard, T., Golubic, S., Gadel, F., and Thomassin, B., 2000. Fungi in corals: Black bands and density-banding ofandskeleton., 136: 19-27.
Rädecker, N., Pogoreutz, C., Voolstra, C. R., Wiedenmann, J., and Wild, C., 2015. Nitrogen cycling in corals: The key to understanding holobiont functioning?, 23 (8): 490-497.
Raghukumar, C., and Ravindran, J., 2012. Fungi and their role in corals and coral reef ecosystems., 53: 89-113.
Ribalet, F., Swalwell, J., Clayton, S., Jiménez, V., Sudek, S., Lin, Y.,., 2015. Light-driven synchrony ofgrowth and mortality in the subtropical Pacific gyre., 112 (26): 8008-8012.
Robinson, M. D., McCarthy, D. J., and Smyth, G. K., 2009. edgeR: A bioconductor package for differential expression analysis of digital gene expression data., 26 (1): 139-140.
Rocap, G., Distel, D. L., Waterbury, J. B., and Chisholm, S. W., 2002. Resolution ofandecotypes by using 16S-23S ribosomal DNA internal transcribed spacer sequences.,68 (3): 1180-1191.
Romari, K., and Vaulot, D., 2004. Composition and temporal variability of picoeukaryote communities at a coastal site of the English Channel from 18S rDNA sequences., 49 (3): 784-798.
Schlitzer, R., 2002. Interactive analysis and visualization of geoscience data with ocean data view., 28 (10): 1211-1218.
Schneider, L., Anestis, K., Mansour, J., Anschütz, A., Gypens, N., Hansen, P.,., 2020. A dataset on trophic modes of aquatic protists., 8: e56648.
Seenivasan, R., Sausen, N., Medlin, L., and Melkonian, M., 2013.gen. et sp. nov.: The first identified member of the Picozoa phylum nov., a widespread group of picoeukaryotes, formerly known as ‘Picobiliphytes’., 8: e59565.
Seymour, J. R., Patten, N. L., Bourne, D., and Mitchell, J. G., 2005. Spatial dynamics of virus-like particles and heterotrophic bacteria within a shallow coral reef system., 288: 1-8.
Sherr, B., Sherr, E. B., Caron, D. A., Vaulot, D., and Worden, A. Z., 2007.. Oceanography, Washington D. C., 20: 130-134.
Silveira, C. B., Cavalcanti, G. S., Walter, J. M., Silva-Lima, A. W., Dinsdale, E. A., Bourne, D. G.,., 2017. Microbial processes driving coral reef organic carbon flow., 41 (4): 575-595.
Strehl, B., Holtzendorff, J., Partensky, F., and Hess, W. R., 1999. A small and compact genome in the marine cyanobacteriumCCMP 1375: Lack of an intron in the gene for tRNA(Leu)UAA and a single copy of the rRNA operon., 181 (2): 261-266.
Sudek, S., Everroad, R. C., Gehman, A. L. M., Smith, J. M., Poirier, C. L., Chavez, F. P.,., 2015. Cyanobacterial distributions along a physico-chemical gradient in the northeastern Pacific Ocean., 17 (10): 3692-3707.
Tout, J., Jeffries, T. C., Webster, N. S., Stocker, R., Ralph, P. J., and Seymour, J. R., 2014. Variability in microbial community composition and function between different niches within a coral reef., 67 (3): 540-552.
Vaulot, D., Marie, D., Olson, R. J., and Chisholm, S. W., 1995. Growth of, a photosynthetic prokaryote, in the equatorial Pacific Ocean., 268 (5216): 1480- 1482.
Wang, R., Yu, K., Jones, B., Wang, Y. H., Zhao, J. X., Feng, Y. X.,., 2018. Evolution and development of miocene ‘island dolostones’ on Xisha Islands, South China Sea., 406: 142-158.
Wang, Y. P., Li, G. H., Shi, F., Dong, J., Gentekaki, E., Zou, S. B.,., 2020. Taxonomic diversity of pico-/nanoeukaryotes is related to dissolved oxygen and productivity, but functional composition is shaped by limiting nutrients in eutrophic coastal oceans., 11: 601037.
Wangpraseurt, D., Weber, M., Røy, H., Polerecky, L., de Beer, D., and Nugues, M. M., 2012.oxygen dynamics in coral-algal interactions., 7 (2): e31192.
Wafar, M., Wafar, S., and David, J. J., 1990. Nitrification in reef corals., 35 (3): 725-730.
Weber, L., and Apprill, A., 2020. Diel, daily, and spatial variation of coral reef seawater microbial communities., 15 (3): e0229442.
Wiedenmann, J., D’Angelo, C., Smith, E. G., Hunt, A. N., Legiret, F. E., Postle, A. D.,., 2013. Nutrient enrichment can increase the susceptibility of reef corals to bleaching., 3 (2): 160-164.
Wu, F., Xie, X. N., Betzler, C., Zhu, W. L., Zhu, Y. H., Guo, L. Y.,., 2019. The impact of eustatic sea-level fluctuations, temperature variations and nutrient-level changes since the Pliocene on tropical carbonate platform (Xisha Islands, South China Sea).,,, 514: 373-385.
Wu, P. F., Li, D. X., Kong, L. F., Li, Y. Y., Zhang, H., Xie, Z. X.,., 2020. The diversity and biogeography of microeukaryotes in the euphotic zone of the northwestern Pacific Ocean., 698: 134289.
Wu, M. L., Dong, J., and Wang, Y. S., 2017. Identification of seawater quality by multivariate statistical analysis in Xisha Islands, South China Sea. In:. Hlanganani, T., ed., IntechOpen, DOI: 10.5772/66227.
Xu, D., Li, R., Hu, C., Sun, P., Jiao, N., and Warren, A., 2017. Microbial eukaryote diversity and activity in the water column of the South China Sea based on DNA and RNA high throughput sequencing., 8: 1121.
Xu, L. Q., Liu, X. D., Sun, L. G., Yan, H., Liu, Y., Luo, Y. H.,., 2011. Geochemical evidence for the development of coral island ecosystem in the Xisha Archipelago of South China Sea from four ornithogenic sediment profiles., 286 (3): 135-145.
Ye, G. Z., Zhang, X., Yan, C. Z., Lin, Y., and Huang, Q. S., 2021. Polystyrene microplastics induce microbial dysbiosis and dysfunction in surrounding seawater., 156: 106724.
Zaneveld, J. R., Burkepile, D. E., Shantz, A. A., Pritchard, C. E., McMinds, R., Payet, J. P.,., 2016. Overfishing and nutrient pollution interact with temperature to disrupt coral reefs down to microbial scales., 7 (1): 11833.
Ziegler, M., Roik, A., Porter, A., Zubier, K., Mudarris, M. S., Ormond, R.,., 2016. Coral microbial community dynamics in response to anthropogenic impacts near a major city in the central Red Sea., 105 (2): 629-640.
Zhou, J. Z., Wu, L. Y., Deng, Y., Zhi, X. Y., Jiang, Y. H., Tu, Q. C.,., 2011. Reproducibility and quantitation of amplicon sequencing-based detection., 5 (8): 1303- 1313.
Zhu, P., Wang, Y. P., Shi, T. T., Huang, G. Q., and Gong, J., 2018. Genetic diversity of benthic microbial eukaryotes in response to spatial heterogeneity of sediment geochemistry in a mangrove ecosystem., 41 (3): 751-764.
(Oceanic and Coastal Sea Research)
https://doi.org/10.1007/s11802-022-5107-y
ISSN 1672-5182, 2022 21 (3): 748-762
(June 22, 2021;
November 2, 2021;
December 29, 2021)
© Ocean University of China, Science Press and Springer-Verlag GmbH Germany 2022
Corresponding authors. E-mail: zjdong@yic.ac.cn E-mail: jmzhao@yic.ac.cn
(Edited by Ji Dechun)
 Journal of Ocean University of China2022年3期
- Journal of Ocean University of China的其它文章
- Effect of Intertidal Elevation at Tsuyazaki Cove, Fukuoka,Japan on Survival Rate of Horseshoe Crab Tachypleus tridentatusEggs
- Asian Horseshoe Crab Bycatch in Intertidal Zones of the Northern Beibu Gulf: Suggestions for Conservation Management
- Experimental Investigation on the Interactions Between Dam-Break Flow and a Floating Box
- Variational Solution of Coral Reef Stability Due to Horizontal Wave Loading
- High Microplastic Contamination in Juvenile Tri-Spine Horseshoe Crabs: A Baseline Study of Nursery Habitats in Northern Beibu Gulf, China
- Influence of Autonomous Sailboat Dual-Wing Sail Interaction on Lift Coefficients