
Dynamics of the Eukaryotic Microbial Community at the Breeding Sites of the Large Yellow Croaker Pseudosciaena crocea in the Southern East China Sea
2022-06-14 06:21ZHOUShouhengZHENGShizhanLVTianyingYANGWenLUKWAMBEBetinaNICHOLAUSReganLIChenghuaandZHENGZhongming
ZHOU Shouheng, ZHENG Shizhan, LV Tianying, YANG Wen, LUKWAMBE Betina, 2), NICHOLAUS Regan, 3), LI Chenghua, and ZHENG Zhongming, *
Dynamics of the Eukaryotic Microbial Community at the Breeding Sites of the Large Yellow Croakerin the Southern East China Sea
ZHOU Shouheng1), ZHENG Shizhan1), LV Tianying1), YANG Wen1), LUKWAMBE Betina1), 2), NICHOLAUS Regan1), 3), LI Chenghua1), and ZHENG Zhongming1), *
1)School of Marine Sciences, Ningbo University, Ningbo 315211, China 2) Department of Aquculture Technology, School of Aquatic Sciences and Fisheries Technology, University of Dar es Salaam, Dar es Salaam 999132, Tanzania 3) Department of Natural Sciences, Mbeya University of Science and Technology, Mbeya 999068, Tanzania
Clarifying eukaryotic microbial spatial distribution patterns and their determinants is an important idea in ecological research. However, information on the distribution patterns of eukaryotic microbial community structures (EMCSs) within oceans remains unclear.In this study, surface water samples from the southern East China Sea (SECS) were collected to investigate the spatiotemporal variation in EMCSs by using 18S rRNA high-throughput sequencing technology and the impact of this variation onduring the breeding season.The results indicated that the distribution patterns of the eukaryotic microbial community structure were different among the Sansha Bay, Mindong and Wentai reserves and the offshore East China Sea. In addition, there were notable potential effects of EMCSs on fishery activities.The variation partitioning analysis showed the environmental and spatial factors caused 53.4% of the variation in the EMCSs,indicating that spatially structured environmental factors were the key determinants of the EMCSs spatial heterogeneity in the SECS and may have contributed to the general distribution of. In addition, all the environmental factors were the main factors driving the distribution of eukaryotic microbes except for total phosphorus.Furthermore, it was noted some phytoplankton such asandof fungi in Sansha Bay can effectively prevent Cyanobacteria blooms.Chrysophyceae are natural high-quality baits for juvenile fish distributed in Sansha Bay, Mindong and Wentai reserves. This study provides a part of the insight into potential eukaryotic community distributions in large water bodies and how they are affected by environmental factors.
southern East China Sea; 18S rRNA gene sequencing; variation partitioning analysis; eukaryotic microbes
1 Introduction
The East China Sea has a subtropical and temperate climate, which is conducive to the reproduction and growth of plankton. It is a good place for a majority of fish and shrimp to breed and inhabit. It is also the sea area with the highest marine productivity in China. However, in recent decades, fishery resources have gradually become scarce due to the impact of human activities in the East China Sea (Wang., 2012). The wild population of yellow croaker,, is known as the Chinese national fish. However, the main spawning grounds of large yellow croaker, such as the Guanjing Ocean and Daiqu Ocean, have been unable to form fishing seasons due to overfishing in 1980s, leading to a decline in large yellow croaker resources (Zhang., 2017). Although the Chinese government has taken a se-ries of measures to restore fishery resources, the recovery ofis not satisfactory (Liu and Mitcheson, 2008). Evidence suggests that human activities, e.g., discharge of heavy metals, large-scale land reclamation for industrial development and marine cage aquaculture activities have caused the deterioration of coastal water environments, destroyed spawning grounds and habitats, blocked migration channels, and damaged the recovery potential of.populations (Liu and Mitcheson, 2008). According to previous studies, large yellow croakers end their overwintering in March to April every year and move to spa- wning grounds from April to May (Xu and Chen, 2011). They migrate from their overwintering grounds offshore of the Guanjing Ocean, Dongtou, Taishan Island, and other fishing grounds for spawning and feeding (Fig.1). The Sansha Bay (SB) breeding area (Guanjing Ocean) is one of the important spawning grounds of the large yellow croaker in the southern East China Sea (SECS), and the health of its ecosystem is directly related to the spaw- ning situation of the population of. The re- serve areas of Wentai (WT, in Dongtou) and Mindong (MD, near Taishan Island) are also habitats offor spawning and feeding (Zhang and Hong, 2015). Therefore, it is of great interest to investigate the habitat conditions ofin the SECS in the spawning season.
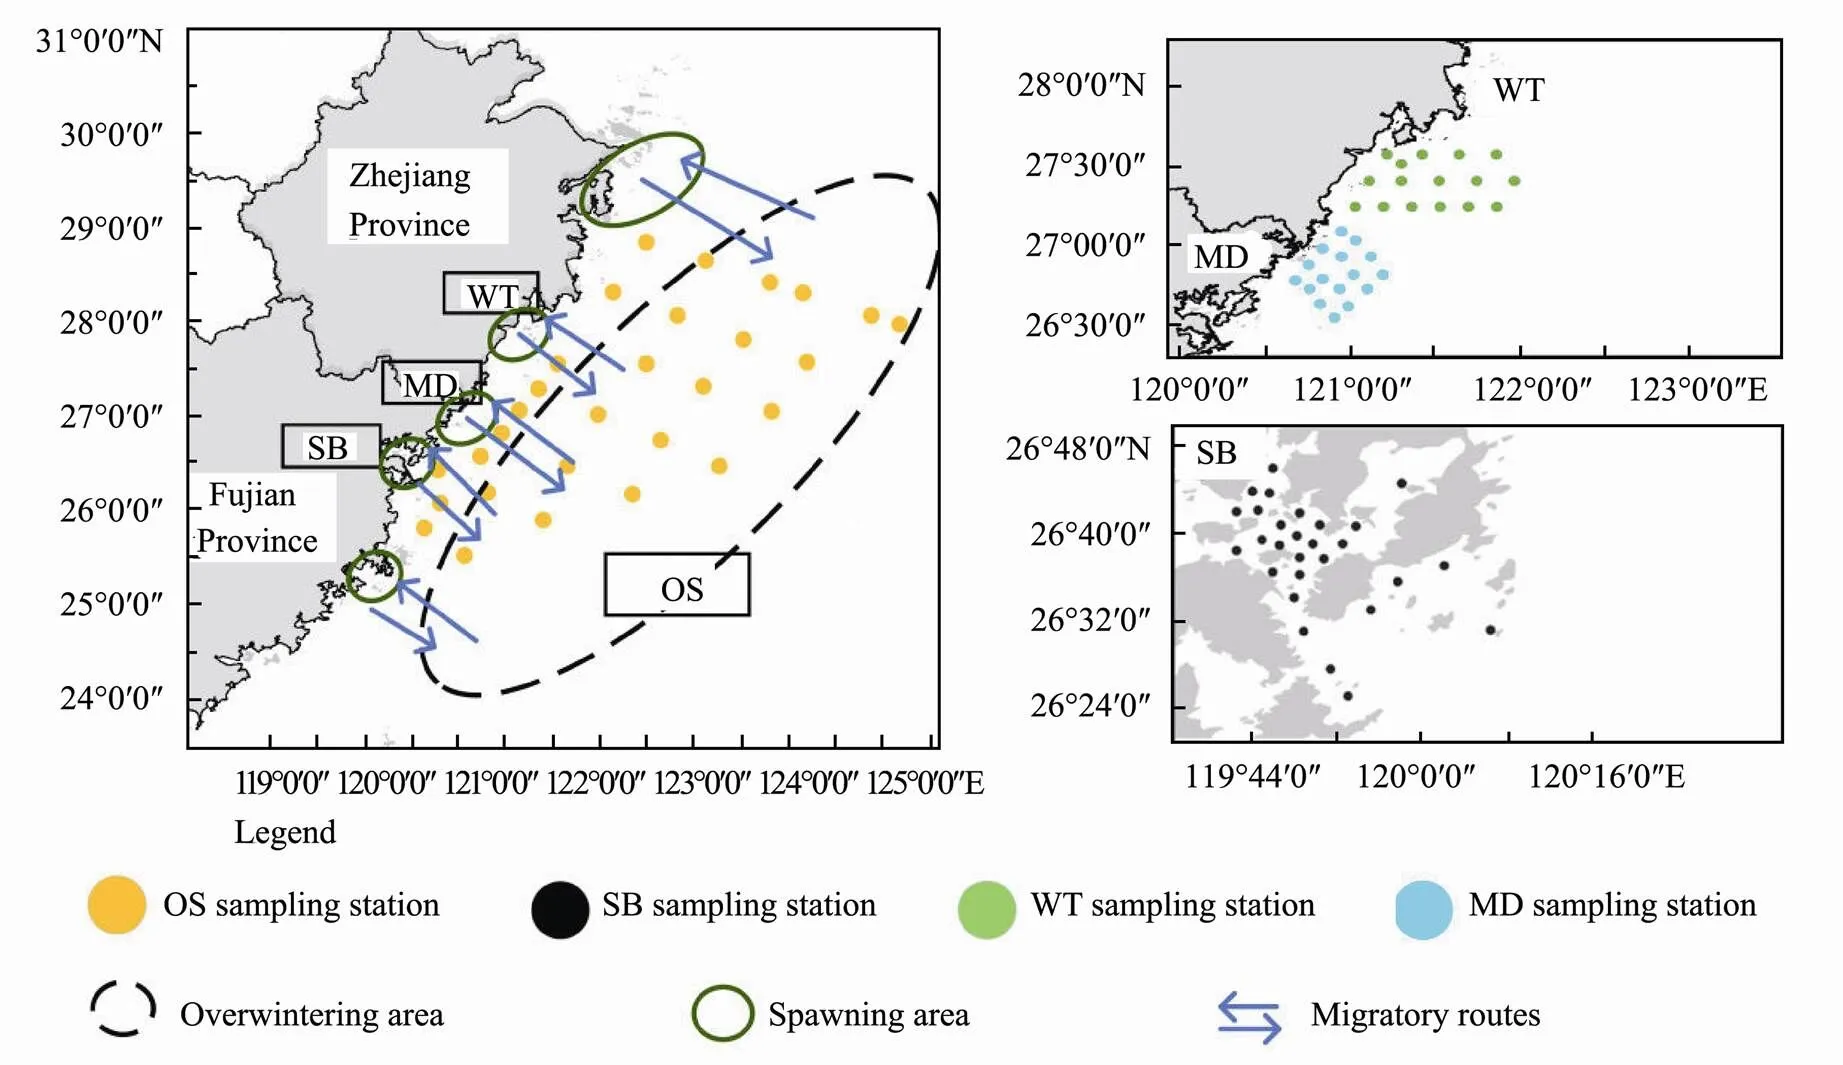
Fig.1 Distribution map of sampling area and migration routeof the P. crocea. SB, Sansha Bay; MD, Mingdong fisheries reserve; WT, Wentai fisheries reserve; OS, offshore southern East China Sea.
Eukaryotic microbes are eukaryotes smaller than 2–3 μm in diameter. They are considered to be the basic components of marine ecosystem, and play a key role in the structure and function of marine ecosystem (Sherr and Sherr, 2000; Cheung., 2010; Chen., 2017). Eukaryotic microbes, such as microalgae, zooplankton and fungi, play important roles in marine ecosystems from primary producers, consumers, decomposers, and phago- trophs to parasites and play an important role in the biogeochemical cycle (Richardson, 2007; Massana, 2015; Oikonomou, 2015; Worden, 2015). Phy- toplankton are responsible for the majority of marine primary productivity (Nagarkar., 2018). Under the effects of a variety of physical, chemical and biological factors, phytoplankton can be affected to varying degrees. As an important part of the marine ecosystem, changes in phytoplankton communities dynamics, such as Cyanobacteria blooms, profoundly affect the stability of marine ecosystems (Huisman., 2005). However, phytoplan- kton are also the most important part of the food web, providing natural prey for some zooplankton and juvenile fish which are beneficial to their growth, thus affecting the zooplankton community structure and the growth of juvenile fish. Zooplankton is also an important part of the marine ecosystem which affects the material circulation and energy flow of the ecosystem and plays an important role in the water nutrition level (Baird., 2003). The growth and community composition of zooplankton are influenced by various physical and chemical factors, such as dissolved oxygen, water temperature, and salinity (Tasevska., 2012). Furthermore, some zooplankton can be used as indicators for the ecological quality of water (Wen., 2011).Thus, studying phytoplankton and zooplankton communities is conducive for a better understanding of the feeding status of fish and provides insights for maintaining the ecological balance of a water body.Fungi have an important biochemical function in marine ecosystems, and they are important degraders of residual organics by using various carbon sources, which are widely distributed in marine surface ecosystems (Wang., 2014a; Yu., 2017).Traditionally, algae, zooplankton and fungi have been studied separately, but 18S sequencing technology can be used to study the entire eukaryotic microbial community, which is convenient for discussing the interaction between these communities and their impacts on the habitat of.
In the present study, eukaryotic microbial communities in the habitat ofduring the migration and breeding period in SECS waters were investigated using the high-throughput sequencing technology and multivariate statistical analysis. The objectives of this study were therefore I) to study the basic distribution pattern of eukaryotic microorganisms in the SECS; II) to explore the impact of spatial and environmental factors on EMCSs; and III) to discuss the potential effects of the eukaryotic microbial community structure on the reproduction of.. This study will provide further insights, especially on the status and distribution patterns of eukaryotic microorganisms and temporal environmental factors throughout the SECS.
2 Materials and Methods
2.1 Study Site
The study site was located in the SECS, north of the Taiwan Strait and south of the Yangtze Estuary (Fig.1), which is the main typical habitat of the large yellow croaker. The study site was divided into four coastal areas: Sansha Bay (SB), Mindong Fisheries Reserve (MD), Wentai Fisheries Reserve (WT) and the offshore of East China Sea (OS). 28 samples were collected in SB from April 8 to 13, 2019; 16 samples were collected in MD from April 15 to 18, 2019; 16 samples were collected in WT from April 22 to 25, 2019; and 29 samples were collected in OS from April 7 to 24, 2019.
2.2 Sample Collection and Preparation
Surface water (0.5m) samples were collected using a five 5-litre water sampler from 4 distinct coastal areas lo- cated in 89 monitoring zones (Fig.1). Approximately 500 mL of seawater was prefiltered with a 100 μm pore-grade nylon filter, and then, the water sample was filtered with a 0.22μm pore membrane (47mm diameter, Millipore, Boston, MA, United States) on the sampling day.Next, the membrane was stored in a −20℃ freezer and transferred to −80℃ upon returning to the laboratory. To prevent contamination, samplers and filtration systems were carefully washed with sterile water before use.
2.3 Environmental Parameter Measurements
Water temperature (WT) and salinity (SAL) were recordedusing a YSI multifunction water quality detector (YSI 6000, USA) at a depth of 0.5m. The total phosphorus (TP), total nitrogen (TN), phosphate (PO43−), nitrate nitrogen (NO3−), nitrous nitrogen (NO2−) and ammonia nitrogen (NH3-N) were measured using national standard methods (AQSIQ, 2007) (Table 1).
Notes: Different superscript letters indicate significant differences in the same raw (<0.05).
2.4 DNA Extraction, PCR Amplification and MiSeq Sequencing
The MinkaGene Water DNA Extraction Kit was used for the extraction of eukaryotic microbial DNA. A NanoDrop One spectrophotometer was used to measure the DNA concentration and purity (Thermo Fisher Scientific, MA, USA).The V4 region of the 18S rRNA gene was amplified using the specific primers 3NDF (5’-GCGGTA ATTCCAGCTCCAA-3’) and V4_euk_R2 (5’-AATCCR AGAATTTCACCTCCAA-3’) (Bråte., 2010). For each sample, the V4 region of the 18S rRNA genes was amplified in a 50µL reaction volume under the following thermocycling: initialization at 95℃ for 3min, followed by 30 cycles of denaturation at 94℃ for 30s, 30s of annealing at 55℃, extension at 72℃ for 1min, and a final extension of 72℃ for 10min. The equimolar PCR product from each sample was pooled to ensure an equal contribution of each community in the final library. Finally, the samples were sequenced using an Illumina HiSeq 2500 platform to generate 250bp paired-end reads (Guangdong Magigene Biotechnology Co., Ltd., Guangzhou, China).
2.5 Sequencing Data Processing
Paired-end sequence reads were merged with USEAR CH (Version 11) according to Edgar (2010). The paired readings were merged into the Fastq mergepairs function and filtered with a ‘maxee’ value of 1.0 (Edgar, 2010). The unique sequence read was obtained using the fastx_ uniques function, and then, noise reduction was performed using the uNoise3 (unoise_alpha=2, minsize= 4, by default) algorithm to correct errors. The remaining sequences were then screened to remove chimaeras and clustered into zero-radius operational taxonomic units (ZOTUs) with 97% similarity or more, after which all quality-filtered reads were mapped to these ZOTUs (Edgar, 2016). The representative sequences for each ZOTU were assigned to taxonomic groups using the RDP classifier within the SILVA database (18s_v138) clustered at 99% similarity. Singletons and unallocated OTUs were discarded. Metazoa, multicellular organisms that may have accounted for a large proportion of the biomass, were also excluded.
2.6 Statistical Analyses
Before analysis, all of the OTU data were transformed by Hellinger transformation, and the environmental data were normalized to satisfy normality and homoscedasticity. The Shannon diversity index (H), evenness (J), richness and Chao1 were calculated by the R ‘package vegan’ v.2.5-6. To obtain biomarker functions of different study sites, we used the random forest (RF) function to establish classification models for four study sites, and 10 cross-validations were performed. The RF classifiers were correlated with their Gini coefficient, which is an indicator of RF that represents the characteristic importance of the species. For beta diversity analysis, principal coordinate analysis (PCoA) and cluster analysis were used to visualize the overall structure of the eukaryotic microbial communities with the ‘hclust’ function in the ‘stats’ package. Permutational multivariate analysis of variance (PERMANOVA) was used to examine differences in the microbial community between different study sites based on Bray-Curtis distance and evaluate the contributions of environmental factors to the Adonis function. One-way ANOVA followed by Duncan’s multiple comparisons was performed to analyse significant differences in the environmental factors and α-diversity between the different sites by using SPSS 17 (SPSS Inc., Chicago, USA).Before one-way ANOVA, the normality and homogeneity of the variance were tested. TheSpearman rank correlation method was used to analyse the relationship between α-diversity and environmental factors. The Mantel test was used to determine the influence of the environmental and spatial variables on the composition of the eukaryotic microbes (Diniz-Filho., 2013). The distance-decay model was used to explore the relationship between eukaryotic microbial community structures (EMCSs) (Bray-Curtis distance) and geographical distance (distance in kilometres among studying sites) by the ‘vegdist’ function in the ‘vegan’ and ‘ggplot2’ packages. To evaluate which environmental factors significantly affected the EMCSs, forward selection was used by the ‘forward.sel’ function in the ‘packfor’ package, and the data were tested by Monte Carlo permutation (999 permutations) (Blanchet., 2008). Then, the vif.cca function in the ‘vegan’ package was used to calculate the multicollinearity between the variables and eliminate the environmental factors with strong multicollinearity (O’brien, 2007). Redundancy analysis (RDA) and the partial Mantel test were used to illustrate the relationship between pure environmental factors and EMCSs (Legendre and Anderson, 1999).The ‘pcnm’ function in the ‘vegan’ package was used for principal coordinate of neighbour matrix (PCNM) analysis, and a set of spatial variables were generated according to the longitude and latitude of the study sites (Daniel and Legendre, 2002). Finally, VPA analysis was performed using the ‘varpart’ function in the ‘vegan’ package to assess the relative importance of the spatial and environmental factors to the EMCSs, which indicated the importance of pure environmental variables, pure spatial variables, shared fraction and unexplained variation (Meot., 1998).
All statistical analyses were performed in the R environment (https://www.r-project.org/) unless otherwise noted.
3 Results
3.1 Relationship Between the α-Diversity of Eukar- yotic Microbes and Environmental Factors
The four major α-diversity indices for SB were higher than those for the other sampling zones. In contrast, the indices for WT were lower than those of other zones. OS had lower Chao1 and richness indices but higher Shannon and Pielou J indices (Fig.2). With the Spearman correlation, a positive correlation between α-diversity and PO43−, temperature and nitrogen compounds was observed (Table 2). These results indicate that environmental factors could be the key factor affecting the α-diversity of eukaryotic microbes across the study sites.

Fig.2 Violin box line diagram of α-diversity indices, including the number of observed species, Shannon diversity index (H′), and Chao1 and Evenness (J) for the four sampling zones.
3.2 Spatial Distribution and Classification of Eukaryotic Microbes
The PCoA diagram showed the differences in the EMCSs between the four study sites; the degree of interpretation of axis 1 was 29.27%, and that of axis 2 was 11.95% (Fig.3). The dynamics of the EMCSs in the study areas were significant (=17.245;2=0.378;=0.001). The corresponding adonis analysis showed that there were significant differences in EMCSs between the two zones (Table 3).
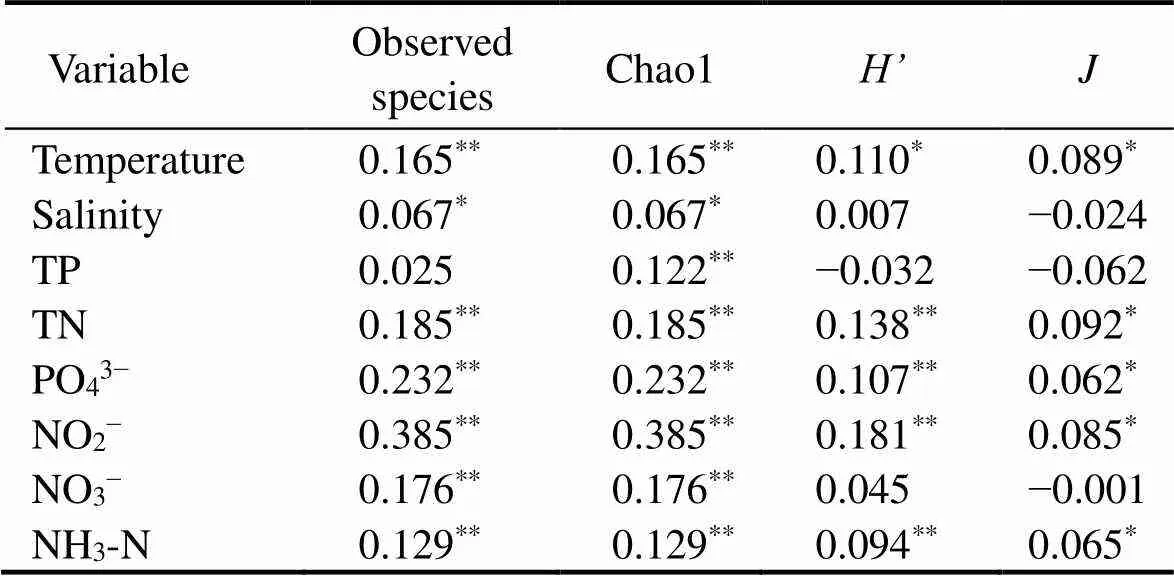
Table 2 Spearman’s rank correlation coefficients (ρ) between α-diversity of eukaryotic microbial community and environmental variables parameters
Notes: Observed species, number of OTUs;, Shannon-Wiener index;, Pielou’s evenness. Data in*indicate significant correlations:*<0.05,**<0.01. TN, total nitrogen; TP, total phosphorus; PO43−, phosphate; NO2−, nitrite nitrogen; NO3−, nitrate nitrogen; NH3-N, ammonia nitrogen.
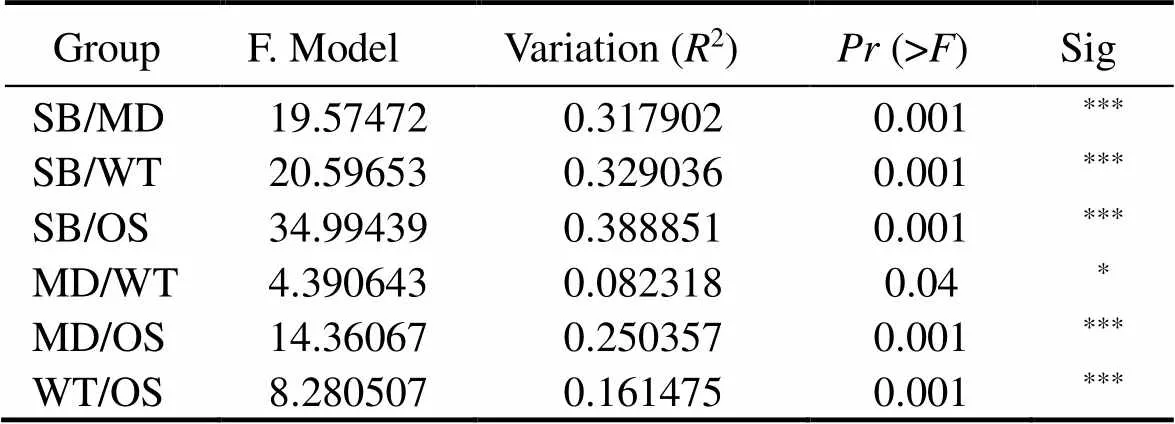
Table 3 Comparison between groups using PERMANOVA
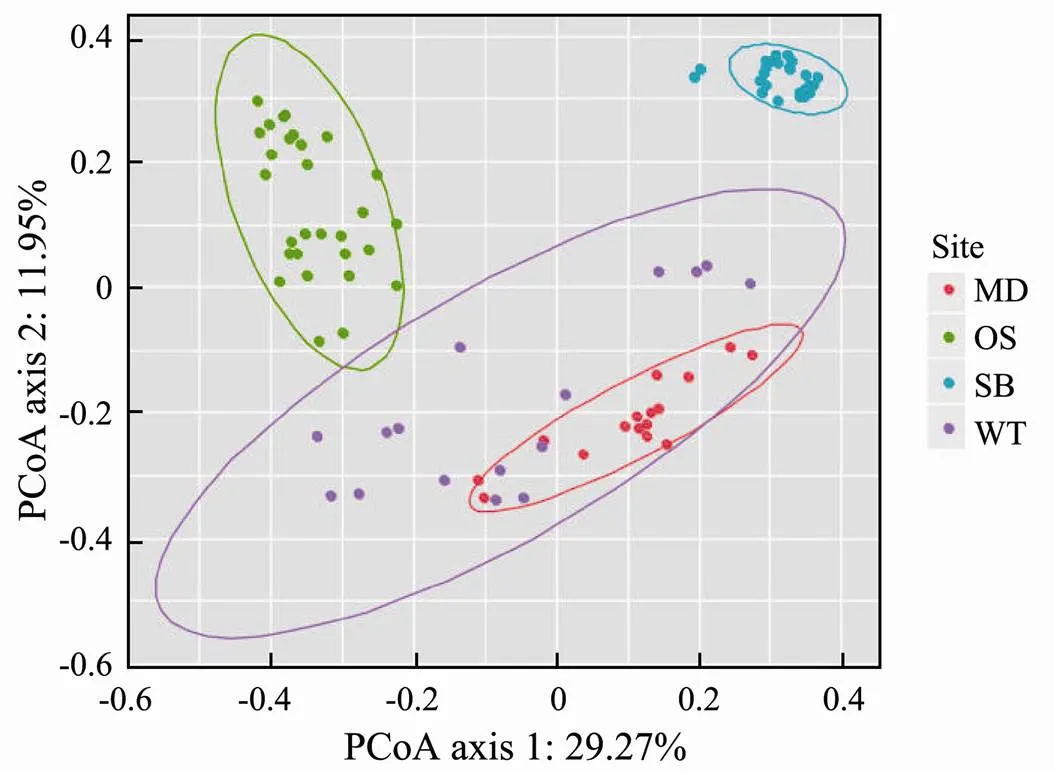
Fig.3 Principal co-ordinates analysis (PCoA) of speci- fic sampling zones. The ellipse represents a 95% confi- dence interval.
At the phylum level, the relative abundances of the eukaryotic microbes at the four study sites showed different distribution patterns (Fig.4).Dinoflagellata, Ochrophyta, Protalveolata, Cryptomonadales and Ciliophora were the main eukaryotic microbial communities at these study sites.Specifically, Dinoflagellata had the largest abundance in the WT (45.7%) and the least abundance in SB (18.6%).In contrast to Dinoflagellata, Protalveolata(both totalling 21.1%) were the most abundant taxa in SB.Basidiomycota and Ascomycota occurred in the largest numbers in the OS compared with in the other sampling zones. In addition, sequences classified into Ochrophyta (14.4%–27.3%), Cryptomonadales (1.6%–12.7%) and Ciliophora (2.6%–8.1%) were also the dominant taxa at the study sites (Fig.4).

Fig.4 Microeukaryotic community composition in the spe- cific sampling zones at the phylum level.
Through the classification of the top Gini coefficient with random forest, 20 eukaryotic microbes with the most valid order recognition were selected from 258 genera, and the result with a minimum error of zero was verified by cross validation. Twenty genera are shown by a heat map based on the average relative abundance (square root transformation) (Fig.5).It can be noted from the heatmap that the eukaryotic microbes can be simply divided into three categories: MD_WT, OS and SB.,,andmay act as biological indicators of OS;,, andmay act as biological indicators of SB; and Marine_Group, andmay act as biological indicators of MD and WT (Fig.5).
3.3 Environmental Determinants of Microeu- karyotic Community Composition
The Spearman method was used to calculate the correlation between the top ten most abundant microeukaryotic phyla and all of the environmental factors in the sample zones. Picozoa and NO2−had the strongest positive corre- lation among all the correlation results of the heat map (=0.77) (Fig.6). Spearman’s correlation analysis showed that for each zone, Ochrophyta and Protalveolata were rare and weakly correlated with the environmental variables (Fig.6), while the other phyla showed strong correlations with the environmental variables. Bicosoecida, Cercozoa, Picozoa, Ciliophora and Cryptomonadales were positively correlated with longitude, while Dinofla- gellata and Basidiomycota were negatively correlated with longitude, suggesting that different eukaryotic microbial groups had different geographic distribution patterns. The correlation between temperature and different groups of eukaryotic microbes was similar to that of salinity.Ascomycota and Basidiomycota preferred high salinity levels and temperatures, while Cercozoa, Picozoa, Ciliophora, and Cryptomonadales favoured low temperatures and salinity levels. The phyla that preferred low temperatures and salinity levels presented high correlations with nutrients, such as nitrate, nitrite, phosphate, total phosphorus and total nitrogen.
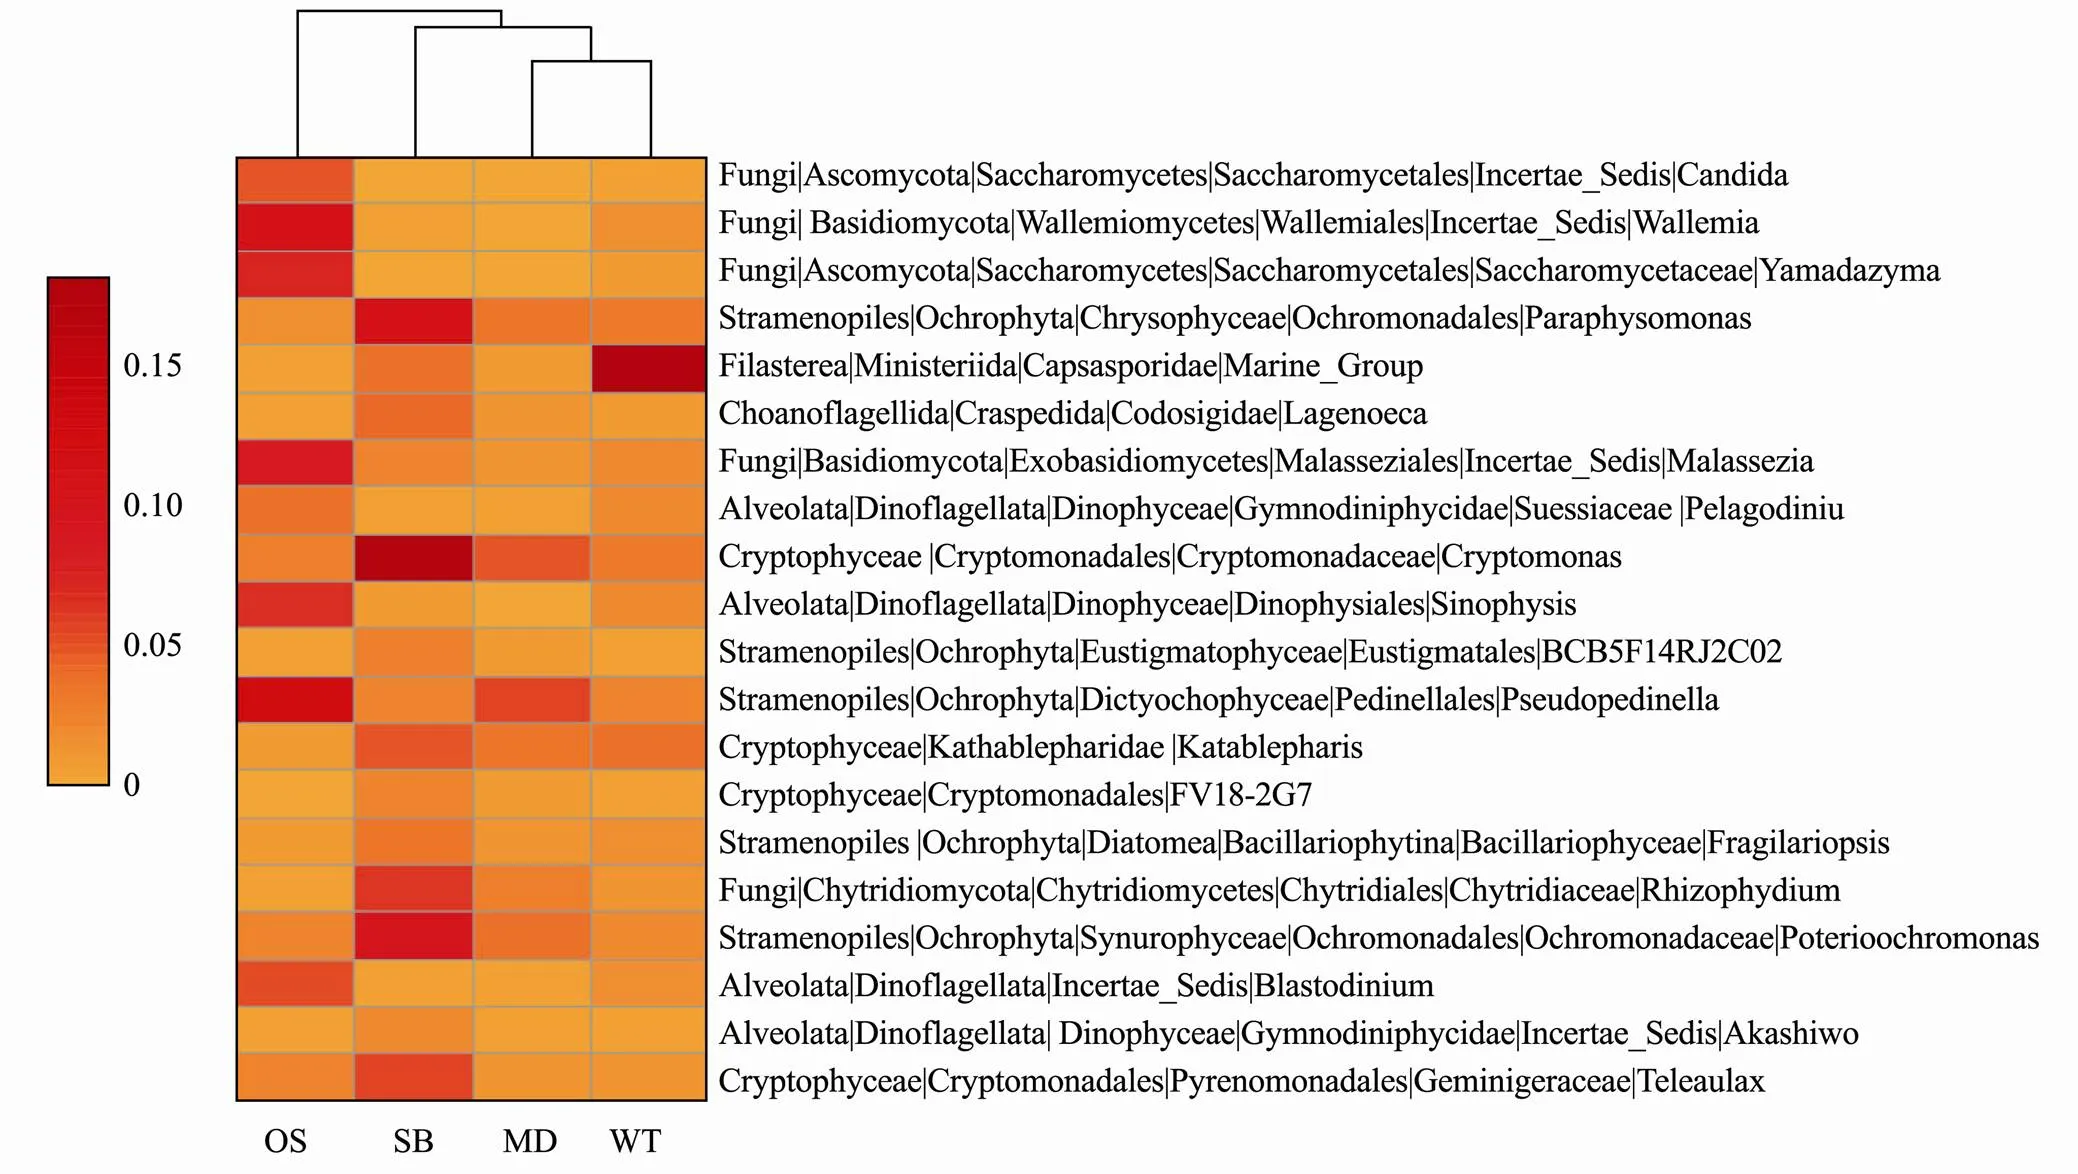
Fig.5 Heatmap of the top 20 eukaryotic microbial orders selected by random forest. OS, Offshore sea; SB, Sanshawan 1; MD, Mindong; WT, Wentai. The average relative abundance is subsequently square root transformed.

Fig.6 Heat map depicting correlations between top ten abundance at the phylum level and environmental parameters.
Before the variance partitioning procedure, the principal components of the environmental factors were extracted as mentioned.Seven environmental factors were retained from 8 environmental factors, namely, phosphate, nitrate, nitrite, ammonia nitrogen, total nitrogen, water temperature and salinity. All factors were significant in the Monte Carlo permutation tests (<0.05, permutations=9999) and explained 38.6% of the EMCSs variance (= 7.87,=0.001).
The partial Mantel test and RDA were used to determine the relationship between the environmental factors and EMCSs. The axis permutation tests of the partial RDA showed that the first four axes were significant (= 34.49, 7.99, 4.10, and 3.51;=0.001, permutations= 9999). The ordination diagram of the RDA (the first two axes, Fig.7), accounting for 84.8% of the four significant axes, showed that the variation in the EMCSs was significantly related to the environmental factors.In particular, phosphate, nitrite, ammonia nitrogen, total nitrogen, water temperature and salinity strongly shaped the EMCSs in SB and the OS sections in various directions. However, there were no significant correlations between the environmental factors and EMCSs in the WT and MD.

Fig.7 Partial redundancy analysis showing the variations of eukaryotic microbial community constrained by environmental factors in the study area.
The RDA indicated that environmental factors played a significant role (<0.001) in shaping the EMCSs at the sampling sites (Fig.7). The partial Mantel test further validated the pure correlation of the seven main environmental factors and EMCSs (Table 4).Although the geographic distance was controlled in partial Mantel tests (Table 4), all seven environmental variables were significantly correlated with the β-diversity of eukaryotic microbes (variation in composition).Phosphate (=0.7235), salinity (=0.5975) and water temperature (=0.5651) were the strongest environmental drivers of β-diversity, which was confirmed by permutation analyses of variance on the distance matrix (Table 5)
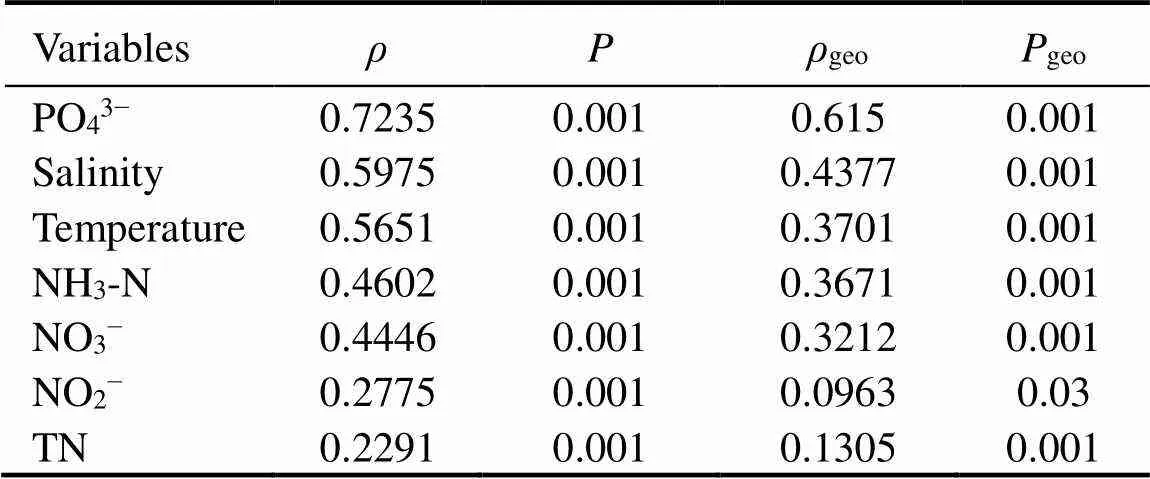
Table 4 Simple and partial mantel tests for the correlations between environmental variables (Euclidean distance) and β-diversity of microeukaryotic community (Bray-Curtis dissimilarity) with 9999 permutations

Table 5 Permutational multivariate analysis of variance (Adonis) on distance matrix in study area
Note:***≤0.0001.
.
3.4 Effects of Geographic Distance and Variation Partitioning Analysis of EMCSs
Spearman correlation analysis between Bray-Cutis co- mmunity similarity and geographic distance in the study sites presented a significant negative correlation, which showed a clear distance-decay pattern (2=0.2906,<0.01, Fig.8).Variation partitioning analysis showed that environmental and spatial variables in total could explain 53.4% of the variation in the EMCSs (Fig.9).The pure environmental effects explained 15.7% of the variation (<0.01), which was slightly higher than the variation explained by the pure spatial effects (14.8%,<0.01). Approximately 22.9% and 22.9% of the variation were caused by environmental changes in the spatial structure, which were explained by environmental and spatial fac- tors, respectively. The residual 46.6% of the variation was unexplained.
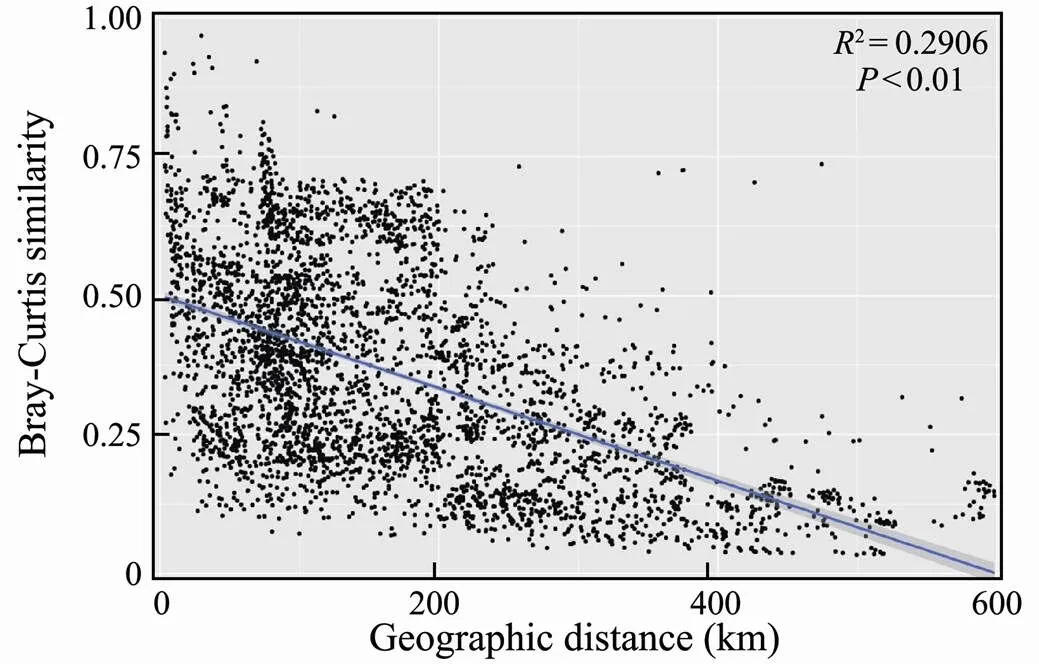
Fig.8 Relationship between the Bray-Curtis similarity of micro eukaryotic community and geographic distance be- tween studying sites.

Fig.9 Variation partitioning analysis of EMCS in SECS.
4 Discussion
4.1 Microeukaryotic Community Distribution and Variation among the Sampled Zones
Our study revealed that there were significantly different eukaryotic microbial community structures among the four study sites (Figs.3, 4). The similarity in the EMCSs decreased with increasing geographical distance (Fig.8), which showed a strong relationship of distance-decay and indicated that spatial factors play an important role in shaping the EMCSs. This relationship of distance decay matched that in the research conducted by Zhao. (2020).
Dinoflagellates and Ochrophyta had the highest relative abundances at the study sites in our research, which was consistent with the results of research in coastal areas of China (Chen., 2017; Zhang., 2018). Dinofla- gellates are common marine phytoplankton, with more than 2000 species being found to date. Some dinoflagellates may produce toxins and cause red tides, and some may produce photosynthetic pigments, which are important sources of marine bioluminescence (Taylor., 2008). Compared with other marine organisms, dinoflagellates are particularly sensitive to water temperature, with an optimum temperature of 20℃ (Nagasoe., 2006). In the present study, the higher water temperature and abundance of dinoflagellates in WT than in the other research areas suggested that temperature may be more suitable for the growth of dinoflagellates. In contrast to dinoflagellates, ciliates seem to prefer to live in areas with low salinity, and the abundance of ciliates decreased with increasing salinity in our study, which was also reported by Lei. (2009). In the present study, the abundance of Ciliophora decreased gradually with increasing salinity (SB, WT, MD, and OS) (Fig.4), which is consistent with the results of Zhang. (2018). In addition, photosynthesis of ciliates was directly affected by nutrients, and in our study, the abundance of ciliates was significantly correlated with the concentrations of several inorganic nutrients (Fig.6), which is consistent with the results of Wang. (2014b). Therefore, SB serves as the closest research site to the coastline, and its high levels of nutrients may have led to a large population of ciliates in that area.
Syndiniales (Dinophyceae and Alveolata) are a diverse parasitic group of dinoflagellates (Chambouvet., 2011). Parasites of the Syndiniales order are common in marine environments, especially in pelagic ecosystems (Clarke., 2019; Zamora-Terol., 2021). They can infect a variety of plankton types, including protozoa, such as flagellates or ciliates and metazoans (Guillou., 2008). In our study, Syndiniales had the highest abundance in all of the orders, accounting for more than 14% of the sequences in all areas. OS, as the farthest offshore study site, had a relative abundance of Syndiniales greater than 20%.of Dinophyceae, a genus that may cause harmful algal blooms (HABs) known to produce paralytic shellfish poisoning (PSP), was enriched in MD. Diatomea, includingand, were distributed in WT and MD, which indicated a strong habitat pattern.andare common in marine environments, and studies have shown that they often spread from nutrient-poor areas to nutrient-rich areas (Kükrer., 2010), which may indicate that they are more suitable to grow in environments that are nutrient rich (Liess., 2009). However,andhad nonsignificant associations with nutritional concentrations in our study. Studies have shown that a large number of freshwater emissions reduce the concentration of diatoms (Gasiūnaitė., 2005), which may explain why MD and WT had a higher diatom abundance than SB, which is farther away from the estuary. The distribution of eukaryotic microbes was closely related to the local environmental conditions at the study sites.
4.2 Role of Spatial and Environmental Factors in EMCSs Variations
The VPA results revealed thatenvironmental and spatial factors accounted for 53.4% of the EMCSs variation, suggesting that both played a major role in shaping the EMCSs in the SECS (Fig.9), which was consistent with the results of recent studies on eukaryotic microorganisms in other areas (Chen., 2017; Zhang., 2018; Lai., 2020).
The pure spatial factor may be formed by dispersal limitation. Compared with bacteria, eukaryotes are larger and more vulnerable to turbulence, which limits their transportation and affects their dispersal and changes the composition of the EMCSs particularly in large-scale (hundreds to thousands of kilometres) data (Potapova and Charles, 2002; Crump., 2007; Findlay, 2010; Liu., 2013). Our research showed that spatial factors had a significant relationship with the change in EMCSs (< 0.01), and the similarity in the community composition decreased with increasing geographic distance (Fig.7).
However, some results from previous studies have shown that microbial eukaryotes are more susceptible to environmental factors than spatial factors (Hanson., 2012; Wu., 2017). In our study, environmental factors account for a larger percentage of variance than spatial factors (Fig.9), suggesting that environmental factors may play a more important role than dispersal limitation in moulding the EMCSs in the SECS. All of the environmental factors were significantly correlated with EMCSs, except for total phosphorus (Table 4).
Nutrients, such as nitrogen and phosphorus, are essential for phytoplankton growth and development. Many other studies have shown that the composition of the microbial eukaryote community is related to nutritional status (Gaedke., 2004; Moore., 2008; Chen., 2010; Lai., 2020). The distributions of phytoplankton have different patterns throughout the world, and their specific strategies of nutrient utilization are also different under different nutrient constraints (Palenik, 2015). In this study, RDA ordination revealed that all four nutrients (NO2−, NO3−, NH4+and PO43−) were significantly correlated with EMCSs, and most nutrients (NO2−, NO3−and PO43−) were orthogonal to the eukaryotic microbial community in SB. SB is the estuary of the inner bay and has a higher nutrient concentration than those in the other study areas. This spatial coordination indicated that nutrition mainly mediated the EMCSs of SB.
Salinity has a strong influence on the abundance and composition of the eukaryote community (Ruiz, 1998; Casamayor, 2002). A large-scale analysis in the world showed that salinity is one of the main driving factors in shaping EMCSs (Lozupone and Knight, 2007). In the study area, SB, MD and WT are closer to the coastline than OS and are affected by river input, resulting in lower salinity.In coastal areas where freshwater is discharged, salinity plays a crucial role in shaping the EMCSs. At the same time, marine plants prefer to live in the open ocean, which indicates that the salt tolerance of microbial eukaryotes will also affect their distribution (Wu., 2020). In our RDA ordination results, salinity was orthogonal to the eukaryotic microbial community of OS, which confirms our hypothesis. Furthermore, salinity can also determine the abundance of some microbial eukaryotes, such as Ciliophora.
Water temperature is generally considered an important basic environmental factor that directly or indirectly affects a EMCSs (Liu., 2013; Duarte., 2019) and prokaryote community structure (Hu., 2018). Water temperature is the key driving factor of a EMCSs, and many phytoplankton are sensitive to temperature. As a seasonal environmental factor, water temperature is a strong constraint on the composition and structure of eukaryotic microbial communities in seasonal studies (Wu., 2011; Liu., 2013; Suikkanen., 2013). However, since our study was conducted in the same season, we did not find a large difference in the water temperature, and water temperature had a weaker constraint compared with the above nitrogen constraint according to the RDA diagram (Fig.7).
Although environmental variables contributed more to the EMCSs in the SECS, spatial factors also affected the EMCSs. Therefore, the inherent spatial variation in eukaryotic microbial assemblages should be considered when assessing the impact of environmental factors on eukaryotic microbial communities at a large spatial scale.
4.3 Potential Effects of Eukaryotic Microbes on the Breeding of Yellow Croaker (Pseudosciaena crocea)
Sansha Bay is a deep, semi-closed bay, and the intersection and mixing of salt water and freshwater have made it rich in nutrients and one of the main inner-bay spawning grounds of large yellow croaker since ancient times (Cai, 2007; Hu., 2014). The spawning grounds for the fish protection areas of Wentai and Mindong were newly established by the local government (Han, 2020; Wu, 2004). Every spring (March–April), large yellow croakers migrate from the wintering ground (OS) to the spawning areas (including SB, WT and MD) for breeding and feeding on prey (Fig.1). Eukaryotic microbes are irreplaceable and important feed for most juvenile fish. However, the communities of eukaryotic microbes maintain temporal and spatial variation and will potentially affect the breeding of fish,.., yellow croaker.
of Chytridiomycota fungi can effectively control the outbreak of cyanobacterial blooms and play a certain role in the regulation of water quality (Frenken., 2017; Ortiz-Cañavate., 2019). In our study,had a higher abundance distribution in SB than in other study areas, indicating that SB has better water qualities and a healthier breeding environment (Fig.5). However, some fungi, such as Chytridiales, can parasitize or rot on fish or diatoms (James., 2006). Some fungi can even cause epidemics. A small number ofwas found in WT, MD and SB, which may cause epizootic ulcerative syndrome (Saylor., 2010) that affects the breeding and growth of large yellow croaker.
Phytoplankton are not only recognized as main primary producers in marine ecosystems but also have other ecological functions.of Ochromonadales Stramenopiles was identified as capable of absorbing cyanobacterial toxics (Yang and Kong, 2012). A considerable number ofwere distributed in SB in this study, which may mitigate harmful algal blooms (HABs) (Fig.5). Chrysophyceae are natural high-quality prey for most aquatic animals because of their bare cell walls, good palatability and rich contents of eicosapentaenoic acid, docosahexaenoic acid and nutrients (Lai., 2020). In the present study, Chrysophyceae were widely distributed in SB (Fig.5) as well as in MD and WT. Cryptophytes are indicators of healthy water quality (Lai., 2020).andof Cryptophytes were widely distributed in SB (Fig.5), and the difference in their distribution indicated that the water in SB was better than that in other sampling zones (Figs.4 and 5). Thus, Sansha Bay may be assumed to have the most suitable conditions for breedingof our study areas.
In summary, a considerable number of eukaryotic microbes were beneficial at the three sampling sites, which could improve water quality and provide high-quality natural prey for fish. However, there are still a small number of harmful microorganisms that need attention. Among the eukaryotic microbes in this study, some larger-celled organisms, such as dinoflagellates, unicellular ciliates and multicellular molluscs usually have more copies of 18S rRNA than other eukaryotes (Gong., 2013), which may lead to overestimation of their relative abundance.
5 Conclusions
This study demonstrated that the differences in EMCSs along the East China Sea and the distinctness were significantly constrained by spatially structured environmental factors based on the analysis of 18S rDNAhigh-throughput sequencing technology. The higher existence of some phytoplankton (..,) and fungi (..,)in Sansha Bay could purify the water quality and the Chrysophyceae in Sansha Bay, Mingdong and Wentai reserves could be beneficial to juvenile fish growth. Furthermore, we also found that some key microbes (..,,and) may significantly affect the habitat of large yellow croaker in the East China Sea. These findings provide valuable information for research on eukaryotic microbial ecology in the marine.
Acknowledgements
This research was supported by the National Key Research and Development Program of China (No. 2018 YFC1406300), the Natural Science Foundation of Zhejiang Province (No. LQ20C190003), the Department of Education Scientifific Research Project of Zhejiang Pro- vince (No. Y201839309), the Natural Science Foundation of Ningbo (Nos. 2019A610421 and 2019A610443), and the K. C. Wong Magna Fund in Ningbo University.The authors would like to thank the colleagues from Xiamen University, Second Institute of Oceanography, and other institutions for helping on board works. In addition, the authors thank Prof. Lingfeng Huang and Prof. Jianyu Hu from Xiamen University for their selfless sharing of environmental data.
AQSIQ, 2007. The specification for marine monitoring of China- Part 4: Seawater analysis (GB 17378.4-2007). General administration of quality supervision, inspection and quarantine (AQSIQ) of the People’s Republic of China.
Baird, M. E., Walker, S. J., Wallace, B. B., Webster, I. T., and Parslow, J. S., 2003. The use of mechanistic descriptions of algal growth and zooplankton grazing in an estuarine eutrophication model., 56 (3- 4): 685-695, DOI: 10.1016/S0272-7714(02)00219-6.
Blanchet, F. G., Legendre, P., and Borcard, D., 2008. Forward selection of explanatory variables., 89 (9): 2623- 2632, DOI: 10.1890/07-0986.1.
Bråte, J., Logares, R., Berney, C., Ree, D. K., Klaveness, D., Ja- kobsen, K. S.,., 2010. Freshwater Perkinsea and marine- freshwater colonizations revealed by pyrosequencing and phylogeny of environmental rDNA., 4 (9): 1144-1153, DOI: 10.1111/j.1550-7408.2011.00547.x.
Cai, Q. H., 2007. Study on marine ecological environment of Sansha Bay in Fujian Province., 23 (006): 101-105, DOI: 10.3969/j.issn.1002-6002. 2007.06.028 (in Chinese with English abstract).
Casamayor, E. O., Massana, R., Benlloch, S., Ovreas, L., Diez, B., Goddard, V. J.,., 2002. Changes in archaeal, bacterial and eukaryal assemblages along a salinity gradient by comparison of genetic fingerprinting methods in a multipond solar saltern., 4 (6): 338-348, DOI: 10. 1046/j.1462-2920.2002.00297.x.
Chambouvet, A., Alves-de-Souza, C., Cueff, V., Marie, D., Karpov, S., and Guillou, L., 2011. Interplay between the parasitesp. (Alveolata) and the cyst formation of the red tide dinoflagellate., 162 (4): 637-649, DOI: 10.1016/j.protis.2010.12.001.
Chen, M. J., Chen, F. Z., Zhao, B. Y., Wu, Q. L., and Kong, F. X., 2010. Seasonal variation of microbial eukaryotic community composition in the large, shallow, subtropical Taihu Lake, China., 44 (1): 1-12, DOI: 10.1007/s10452- 009-9254-7.
Chen, W. D., Pan, Y. B., Yu, L. Y., Yang, J., and Zhang, W. J., 2017. Patterns and processes in marine microeukaryotic com- munity biogeography from Xiamen coastal waters and intertidal sediments, Southeast China., 8: 1-12, DOI: 10.3389/fmicb.2017.01912.
Cheung, M. K., Au, C. H., Chu, K. H., Kwan, H. S., and Wong, C. K., 2010. Composition and genetic diversity of picoeukaryotes in subtropical coastal waters as revealed by 454 pyrosequencing., 4 (8): 1053-1059, DOI: 10. 1038/ismej.2010.26.
Clarke, L. J., Bestley, S., Bissett, A., and Deagle, B. E., 2019. A globally distributed Syndiniales parasite dominates the Sou- thern Ocean micro-eukaryote community near the sea-ice edge., 13 (3): 734-737, DOI: 0.1038/s413 96-018-0306-7.
Crump, B. C., Adams, H. E., Hobbie, J. E., and Kling, G. W., 2007. Biogeography of bacterioplankton in lakes and streams of an Arctic tundra catchment., 88 (6): 1365-1378, DOI: 10.1890/06-0387.
Daniel, B., and Legendre, P., 2002. All-scale spatial analysis of ecological data by means of principal coordinates of neigh- bour matrices., 153 (1-2): 51-68, DOI: 10.1016/S0304-3800(01)00501-4.
Diniz-Filho, J. A. F., Soares, T. N., Lima, J. S., Dobrovolski, R., Landeiro, V. L., Telles, M. P. C.,., 2013. Mantel test in population genetics., 36 (4): 475-485, DOI: 10.1590/s1415-47572013000400002.
Duarte, L. N., Coelho, F. J. R. C., Cleary, D. F. R., Bonifácio, D., Martins, P., and Gomes, N. C. M., 2019. Bacterial and microeukaryotic plankton communities in a semi-intensive aqu- aculture system of sea bass (): A sea- sonal survey., 503: 59-69, DOI: 10.1016/j.aqua- culture.2018.12.066.
Edgar, R. C., 2010. Search and clustering orders of magnitude faster than BLAST.,26 (19): 2460-2461, DOI: 10.1093/bioinformatics/btq461.
Edgar, R. C., 2016. UNOISE2: Improved error-correction for Illumina 16S and ITS amplicon sequencing.(Preprint),DOI: 10.1101/081257.
Findlay, S., 2010. Stream microbial ecology., 29: 170-181, DOI: 10. 1899/09-023.1.
Frenken, T., Alacid, E., Berger, S. A., Bourne, E. C., Gerphagnon, M., Grossart, H. P.,., 2017. Integrating chytrid fungal parasites into plankton ecology: Research gaps and needs., 19 (10): 3802-3822, DOI: 10.1111/1462-2920.13827.
Gaedke, U., Seifried, A., and Adrian, R., 2004. Biomass size spectra and plankton diversity in a shallow eutrophic lake., 89 (1): 1-20, DOI: 10. 1002/iroh.200310661.
Gasiūnaitė, Z. R., Cardoso, A. C., Heiskanen, A. S., Henriksen, P., Kauppila, P., Olenina, I.,., 2005. Seasonality of coas- tal phytoplankton in the Baltic Sea: Influence of salinity and eutrophication., 65 (1-2): 239-252, DOI: 10.1016/j.ecss.2005.05.018.
Gong, J., Dong, J., Liu, X. H., and Massana, R., 2013. Extremely high copy numbers and polymorphisms of the rDNA operon estimated from single cell analysis of oligotrich and peritrich ciliates., 164 (3): 369-379, DOI: 10.1016/j. protis.2012.11.006.
Guillou, L., Viprey, M., Chambouvet, A., Welsh, R. M., Kirkham, A. R., Massana, R.,., 2008. Widespread occurrence and genetic diversity of marine parasitoids belonging to Syndiniales (Alveolata)., 10 (12): 3349-3365, DOI: 10.1111/j.1462-2920.2008.01731.x.
Han, X. F., 2020. Study on community structure and diversity of swimming animals in spawning ground protection area and adjacent waters of Wentai fishery. Master thesis. Zhejiang Ocean University.
Hanson, C. A., Fuhrman, J. A., Horner-Devine, M. C., and Martiny, J. B. H., 2012. Beyond biogeographic patterns: Processes shaping the microbial landscape., 10 (7): 497-506, DOI: 10.1038/nrmicro2795.
Hu, A. Y., Li, S., Zhang, L. P., Wang, H. J., Yang, J., Luo, Z. X.,., 2018. Prokaryotic footprints in urban water ecosystems: A case study of urban landscape ponds in a coastal city, China., 242: 1729-1739, DOI: 10.1016/j. envpol.2018.07.097.
Hu, M., Wei, Z. L., Han, H. B., Cui, J. J., Huo, Y. Z., and He, P. M., 2014. Investigation and evaluation of water quality for mariculture in Yantian Port, Sansha Bay., 23 (4): 582-587 (in Chinese with English abstract).
Huisman, J., Matthijs, H. C. P., and Visser, P. M., 2005.. Springer, Dordrecht, 256pp, DOI: 10. 1007/1-4020-3022-3.
James, T. Y., Letcher, P. M., Longcore, J. E., Mozley-Standridge, S. E., Porter, D., Powell, M. J.,., 2006. A molecular phylogeny of the flagellated fungi (Chytridiomycota) and description of a new phylum (Blastocladiomycota)., 98 (6): 860-871, DOI: 10.3852/mycologia.98.6.860.
Kükrer, S., Sunlu, F., Buyukisik, B., Aydin, H., and Sunlu, U., 2010. Growth kinetics of two diatomsandsp. from Izmir Bay (eastern Aegean Sea/ Turkey). Rapp Comm int Mer Médit, 39: 379, DOI: 10.13140/ 2.1.2370.5280.
Lai, H., Zhao, L., Yang, W., Nicholaus, R., Lukwambe, B., Zhu, J. Y.,., 2020. Eukaryotic microbial distribution pattern and its potential effects on fisheries in the fish reserves of Qiantang River in breeding season., 39 (2): 566-581, DOI: 10.1007/s 00343-020- 9331-2.
Legendre, P., and Anderson, M. J., 1999. Distance-based redundancy analysis: Testing multispecies responses in multifactorial ecological experiments., 69 (1): 1-24, DOI: 10.1890/0012-9615(1999)069[0001:DBRAT M]2.0.CO;2.
Lei, Y. L., Xu, K. D., Choi, J. K., Hong, H. P., and Wickham, S. A., 2009. Community structure and seasonal dynamics of planktonic ciliates along salinity gradients., 45 (4): 305-319, DOI: 10.1016/j.ejop.2009. 05.002.
Liess, A., Lange, K., Schulz, F., Piggott, J. J., Matthaei, C. D., and Townsend, C. R., 2009. Light, nutrients and grazing interact to determine diatom species richnesschanges to productivity, nutrient state and grazer activity., 97 (2): 326-336, DOI: 10.1111/j.1365-2745.2008. 01463.x.
Liu, L. M., Yang, J., Yu, X. Q., Chen, G. J., and Yu, Z., 2013. Patterns in the composition of microbial communities from a subtropical river: Effects of environmental, spatial and temporal factors., 8 (11): e81232, DOI: 10.1371/journal.pone.0081232.
Liu, M., and Mitcheson, Y. S., 2008. Profile of a fishery collapse: why mariculture failed to save the large yellow croaker.,9 (3): 219-242, DOI: 10.1111/j.1467- 2979.2008.00278.x.
Lozupone, C. A., and Knight, R., 2007. Global patterns in bacterial diversity., 104 (27): 11436-11440, DOI: 10.1073/pnas.0611525 104.
Massana, R., Gobet, A., Audic, S., Bass, D., Bittner, L., Boutte, C.,., 2015. Marine protist diversity in European coastal waters and sediments as revealed by high-throughput sequencing., 17 (10): 4035-4049, DOI: 10.1111/1462-2920.12955.
Meot, A., Legendre, P., and Borcard, D., 1998. Partialling out the spatial component of ecological variation: Questions and propositions in the linear modelling framework., 5 (1): 1-27, DOI: 10.1023/a: 1009693501830.
Moore, C. M., Mills, M. M., Languois, R., Milne, A., Achterberg, E. P., Roche, J. L.,., 2008. Relative influence of nitrogen and phosphorous availability on phytoplankton physiology and productivity in the oligotrophic sub-tropical North Atlantic., 53 (1): 291-305, DOI: 10.4319/lo.2008.53.1.0291.
Nagarkar, M., Countway, P. D., Yoo, Y. D., Daniels, E., Poulton, N. J., and Palenik, B., 2018. Temporal dynamics of eukaryo- tic microbial diversity at a coastal Pacific site., 12 (9): 2278-2291, DOI: 10.1038/s41396-018-0172-3.
Nagasoe, S., Kim, D. I., Shimasaki, Y., Oshima, Y., Yamaguchi, M., and Honjo, T., 2006. Effects of temperature, salinity and irradiance on the growth of the red tide dinoflagellateFreudenthal et Lee., 5 (1): 20-25, DOI: 10.1016/j.hal.2005.06.001.
O’brien, R. M., 2007. A caution regarding rules of thumb for variance inflation factors., 41 (5): 673- 690, DOI: 10.1007/s11135-006-9018-6.
Oikonomou, A., Filker, S., Breiner, H. W., and Stoeck, T., 2015. Protistan diversity in a permanently stratified meromictic lake (Lake Alatsee, SW Germany)., 17 (6): 2144-2157, DOI: 10.1111/1462-2920.12666.
Ortiz-Cañavate, B. K., Wolinska, J., and Agha, R., 2019. Fungicides at environmentally relevant concentrations can promote the proliferation of toxic bloom-forming Cyanobacteria by inhibiting natural fungal parasite epidemics., 229: 18-21, DOI: 10.1016/j.chemosphere.2019.04.203.
Palenik, B., 2015. Molecular mechanisms by which marine phytoplankton respond to their dynamic chemical environment., 7 (1): 325-340, DOI: 10.1146/annurev-marine-010814-015639.
Potapova, M. G., and Charles, D. F., 2002. Benthic diatoms in USA rivers: Distributions along spatial and environmental gradients., 29 (2): 167-187, DOI: 10. 1046/j.1365-2699.2002.00668.x.
Richardson, T. L., and Jackson, G. A., 2007. Small phytoplankton and carbon export from the surface ocean., 315 (5813): 838-840, DOI: 10.1126/science.1133471.
Ruiz, A., Franco, J., and Villate, F., 1998. Microzooplankton grazing in the Estuary of Mundaka, Spain, and its impact on phytoplankton distribution along the salinity gradient., 14: 281-288, DOI: 10.3354/ame014 281.
Saylor, R. K., Miller, D. L., Vandersea, M. W., Bevelhimer, M. S., Schofield, P. J., and Bennett, W. A., 2010. Epizootic ulcerative syndrome caused byin captive bullseye snakeheadcollected from South Florida, USA., 88: 169- 175, DOI: 10.3354/dao02158.
Sherr, E. B., and Sherr, B. F., 2000. Marine microbes: An overview. In:Kirchman, D. L., ed. Wiley-Liss, New York, 13-46.
Suikkanen, S., Pulina, S., Engström-Öst, J., Lehtiniemi, M., Lehtinen, S., and Brutemark, A., 2013. Climate change and eutrophication induced shifts in northern summer plankton communities., 8 (6): e66475, DOI: 10.1371/journal.pone.0066475.
Tasevska, O., Jersabek, C. D., Kostoski, G., and Gušeska, D., 2012. Differences in rotifer communities in two freshwater bodies of different trophic degree (Lake Ohrid and Lake Dojran, Macedonia)., 67 (3): 565-572, DOI: 10.2478/ s11756-012-0041-x.
Taylor, F. J. R., Hoppenrath, M., and Saldarriaga, J. F., 2008. Dinoflagellate diversity and distribution., 17: 407-418, DOI: 0.1007/s10531-007-9258-3.
Wang, L., Shi, X. F., Su, Y. Q., Meng, Z. N., and Lin, H. R., 2012. Loss of genetic diversity in the cultured stocks of the large yellow croaker,, revealed by microsatellites.,13 (5): 5584-5597, DOI: 10.3390/ijms13055584.
Wang, X., Singh, P., Gao, Z., Zhang, X., Johnson, Z. I., and Wang, G., 2014a. Distribution and diversity of planktonic Fungiin the West Pacific Warm Pool., 9 (7): e101 523, DOI: 10.1371/journal.pone.0101523.
Wang, Y. B., Zhang, W. J., Lin, Y. S., Cao, W. Q., Zheng, L. M., and Yang, J., 2014b. Phosphorus, nitrogen and chlorophyll-are signifificant factors controlling ciliate communities in summer in the northern Beibu Gulf, South China Sea., 9 (7): e101121, DOI: 10.1371/journal.pone.01011 21.
Wen, X. L., Xi, Y. L., Qian, F. P., Zhang, G., and Xiang, X. L., 2011. Comparative analysis of rotifer community structure in five subtropical shallow lakes in East China: Role of physical and chemical conditions., 661 (1): 303-316, DOI: 10.1007/s10750-010-0539-6.
Worden, A. Z., Follows, M. J., Giovannoni, S. J., Wilken, S., Zimmerman, A. E., and Keeling, P. J., 2015. Rethinking the marine carbon cycle: Factoring in the multifarious lifestyles of microbes., 347 (6223): 1257594, DOI: 10.1126/ science.1257594.
Wu, G. F., 2004. Management of fishery resources and sustainable development strategy of fishery in Mindong fishery., 19 (3): 8-11, DOI: 10.3969/j. issn.1004-8340.2004.03.002 (in Chinese with English abstract).
Wu, N., Schmalz, B., and Fohrer, N., 2011. Distribution of phytoplankton in a German lowland river in relation to environmental factors., 33 (5): 807- 820, DOI: 10.1093/plankt/fbq139.
Wu, P. F., Li, D. X., Kong, L. F., Li, Y. Y., Zhang, H., Xie, Z. X.,., 2020.The diversity and biogeography of microeukaryotes in the euphotic zone of the northwestern Pacific Ocean., 698: 134289, DOI: 10.1016/j.scitotenv.2019.134289.
Wu, W. X., Lu, H. P., Sastri, A., Yeh, Y. C., Gong, G. C., Chou, W. C.,., 2017. Contrasting the relative importance of species sorting and dispersal limitation in shaping marine bacterialprotist communities., 12 (2): 485-494, DOI: 10.1038/ismej.2017.183.
Xu, Z. L., and Chen, J. J., 2011. Analysis of migratory route ofin the East China Sea and Yellow Sea.,35: 429-437 (in Chinese with English abstract).
Yang, Z., and Kong, F. X., 2012. Formation of large colonies: A defense mechanism ofunder continuous grazing pressure by flagellatesp., 71 (1): 5, DOI: 10.4081/jlimnol.2012.e5.
Yu, S. X., Pang, Y. L., Wang, Y. C., Li, J. L., and Qin, S., 2017. Spatial variation of microbial communities in sediments along the environmental gradients from Xiaoqing River to Laizhou Bay., 120 (1-2): 90-98, DOI: 10.1016/j.marpolbul.2017.04.059.
Zamora-Terol, S., Novotny, A., and Winder, M., 2021. Molecular evidence of host-parasite interactions between zooplankton and Syndiniales., 55 (1): 125-134, DOI: 10.1007/s10452-020-09816-3.
Zhang, H. J., Huang, X. L., Huang, L., Bao, F. J., Xiong, S. L., Wang, K.,., 2018. Microeukaryotic biogeography in the typical subtropical coastal waters with multiple environmental gradients., 635: 618-628, DOI: 10.1016/j.scitotenv.2018.04.142.
Zhang, Q. Y., and Hong, W. S., 2015. The rise and fall of Guanjingyang large yellow croaker resources and their restoration strategies., 37 (2): 179-186 (in Chinese with En- glish abstract).
Zhang, Q. Y., Hong, W. S., and Chen, S. X., 2017. Stock changes and resource protection of the large yellow croaker () and ribbon fish () in coastal waters of China., 36 (3): 438-445 (in Chinese with English abstract).
Zhao, F., Filker, S., Xu, K. D., Huang, P. P., and Zheng, S., 2020. Microeukaryote communities exhibit phyla-specific distance-decay patterns and an intimate link between seawater and sediment habitats in the western Pacific Ocean., 160: 103279, DOI: 10.1016/j.dsr.2020.103279.
(Oceanic and Coastal Sea Research)
https://doi.org/10.1007/s11802-022-5064-5
ISSN 1672-5182, 2022 21 (3): 789-800
(May 14, 2021;
November 18, 2021;
December 22, 2021)
© Ocean University of China, Science Press and Springer-Verlag GmbH Germany 2022
Corresponding author. E-mail:zhengzhongming@nbu.edu.cn
(Edited by Ji Dechun)
 Journal of Ocean University of China2022年3期
- Journal of Ocean University of China的其它文章
- Effect of Intertidal Elevation at Tsuyazaki Cove, Fukuoka,Japan on Survival Rate of Horseshoe Crab Tachypleus tridentatusEggs
- Asian Horseshoe Crab Bycatch in Intertidal Zones of the Northern Beibu Gulf: Suggestions for Conservation Management
- Experimental Investigation on the Interactions Between Dam-Break Flow and a Floating Box
- Variational Solution of Coral Reef Stability Due to Horizontal Wave Loading
- High Microplastic Contamination in Juvenile Tri-Spine Horseshoe Crabs: A Baseline Study of Nursery Habitats in Northern Beibu Gulf, China
- Influence of Autonomous Sailboat Dual-Wing Sail Interaction on Lift Coefficients