
The study of arc behavior with different content of copper vapor in GTAW
2022-07-26 08:18FanDingYaoXinglongHouYingjieHuangJiankangLiDequan
China Welding 2022年2期
Fan Ding , Yao Xinglong , Hou Yingjie , Huang Jiankang , Li Dequan
1. School of Materials Science and Engineering, Lanzhou University of Technology, Lanzhou 730050, China;2. State Key Laboratory of Advanced Processing and Recycling of Non-ferrous Metals, Lanzhou 730050, China
Abstract In order to understand the effects of different content of copper vapor entering the arc plasma on the arc behavior, the tungstencopper materials with copper contents of 0%, 10%, 20% and 30% were made into special tungsten electrodes, which replaced the melting electrode to generate copper vapor. The effects of different content of copper vapor on the arc morphology, arc voltage, arc pressure, current density and arc axial temperature were studied. When copper vapor was transported into the arc plasma, the arc consisted of two parts: a high brightness arc core and the surrounding green luminous area. Through the observation and measurement of the stabilized arc, the results showed that as the content of copper vapor increased, the radius of the greenish region gradually increased, the brightness and size of the core area gradually decreased, the axial temperature of the arc gradually decreased and arc voltage gradually increased with a maximum difference of 1.5 V. This is because the increase of copper vapor concentration changes the net emission coefficient, resulting in a decrease in arc temperature and electrical conductivity. The distribution of arc pressure and current density showed unimodal distribution on the anode surface, and as the content of copper vapor increased, the distribution curves were gradually flattening. A factor contributing to this is that with the increase of copper vapor concentration, the current tends to flow through the edge of the electrode, which expands the conductive path and makes the arc disperse. And the coupling mathematical model of tungsten electrode and arc were established to further explain the experimental results.
Key words the gas tungsten arc welding, copper vapor, arc behavior, numerical simulation
0 Introduction
The gas tungsten arc welding (GTAW) and gas metal arc welding (GMAW) are two welding methods that commonly used in the manufacturing field, but they will produce a large amount of metal vapor in the welding process[1]. For GTAW, the only source of metal vapor is the molten pool, while for GMAW, the evaporation of molten dropletsis an additional sources. When metal vapor enters the arc plasma, the distribution of the current density and the energy transmitted to the workpiece will be changed[2 – 3]. The reaction to the actual welding production process will have effect on the welding quality[4]. Therefore,it is very important to study the effect of metal vapor on arc behavior.
In recent years, the generation and transmission of metal vapor in the arc plasma has re-established as a focal point of research in arc welding. Several studies of the metal vapor on arc behavior have been conducted by numerical simulation and experimental observation (such as imaging spectroscopy, low current wall stabilization method and laser scattering measurement, etc.)[5 – 10]. Through the continuous improvement of the TIG welding model,Gonzalez[11]found that the metal vapor changed the energy transferred to the workpiece by affecting the net radiation coefficient and electrical conductivity of the arc plasma. Fan et al[12]established a numerical model to study the behavior of metal vapor in double electrode TIG welding. It was found that the existence of metal vapor suppressed the heat flux of arc plasma and molten pool. By establishing the mathematical models of cathode, anode and arc plasma, Xiang et al[13]found that the distribution of iron vapor in the arc was related to the mole fraction of argon. Tanaka et al[14]have studied the behavior of metal vapor in TIG welding and found that metal vapor has an obvious shrinking effect on the anodic arc root of high sulfur helium arc. Hertel et al[15]obtained the metal vapor distribution and droplet transfer process with the help of hydrodynamics software CFX,which was close to the experimental results. Schnick et al[16]studied the behavior of metal vapor under different evaporation rates, they found that the lowest central temperature would appear when the evaporation rate was 1% of the wire feeding rate. Tanaka et al[17 – 18]studied the transient transport mechanism of metal vapor in helium arc plasma by imaging spectroscopy. It was found that iron vapor and chromium vapor were ionized in plasma, but chromium vapor reached the center of arc faster than iron vapor. Yang et al[19]measured the emission spectrum by using transfer arc combustion, it was found that the presence of 1% copper vapor reduced the arc temperature by 2000 K. Rahal et al[20 – 21]calculated the diffusion rate of copper vapor by arc wall stabilization method, it was found that the diffusion rate of neutral copper vapor is about 10 ms−1. Terasaki et al[22]measured the electron temperature of pure helium arc and helium arc during welding by laser scattering method. Using copper wire for the pulse GMAW process,Goecke et al[23]obtained three kinds of arc morphologies by using filters with different bandwidths, obtaining the distribution of copper vapor in the arc. Murphy et al[24– 25] contrasted temperature distributions of iron electrode and aluminum electrode, it was suggested that there was no local minimum temperature on the axis of aluminum electrode because of the low radiative emission coefficient of aluminum vapor. However, there are obvious deficiencies in the process of experimental research, and most of the experimental research is focused on GTAW. For example, there was great difference between the wall stable arc and the free combustion arc, so only some general trends can be observed; due to the limitation of autogenic technology, it was difficult to control the accuracy of laser scattering measurement, etc. So, especially for GMAW, the experimental measurement still has a broad prospect.
In this paper, a new experimental method is proposed,the tungsten-copper materials with copper content of 0%,10%, 20% and 30% were made into special tungsten electrodes, which replaced the melting electrode to generate copper vapor and calculate the evaporation rate. The focus of this research is that the effect of metal vapor generated from the polar region on the arc behavior. This method not only obtains a stable arc and metal vapor, but also avoids the interference of droplet transfer. The effects of different content of copper vapor on arc morphology, arc voltage, arc pressure, current density and arc axial temperature were studied by this method. And the coupling mathematical model of tungsten electrode and arc were established to further explain the experimental results.
1 Experiment
1.1 Experimental conditions
The GTAW machine was used in the experiment. The shielding gas was 99.9% argon, and the anode was watercooled copper. The basic process parameters were listed in Table 1. The experiment system was composed of welding system, high-speed camera system, electrical signal acquisition system, pressure acquisition system and spectrum acquisition system.
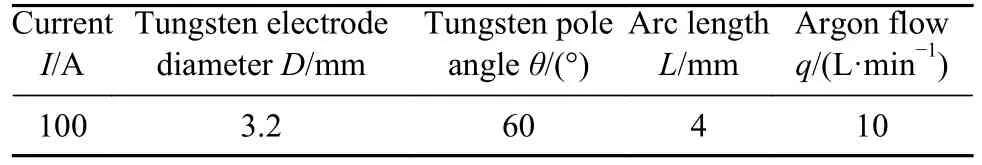
Table 1 Welding parameters
1.2 Experimental setup
The experimental system used in this work was shown in Fig. 1. In order to ensure the stability in the welding process, the welding torch was fixed and the anode was fixed on the moving platform driven by the stepper motor. The arc morphology was photographed by camera and filter.Two kinds of filters were used, one was (780 ±5 nm) narrowband filter, which reflected the distribution gradient of Ar in plasma, and the other was (510 ±5 nm) narrowband filter, which reflected the spatial distribution of copper vapor. The arc voltage was transmitted to the data acquisition card by the Hall voltage sensor, which converted the output voltage of the welding machine into a voltage signal, and the real-time acquisition was carried out by the LabVIEW program[26]. The static keyhole method was used to measure the pressure distribution of GTAW[27]. A hole with a diameter of 1 mm was machined on water-cooled copper.The hole connected with the pressure sensor by a gas pipe,and the pressure signal was converted into an electrical signal. Finally, the electrical signal was converted into a pressure value by a computer. The current density was measured by probe method[26]. The probe was a diameter 1 mm tungsten electrode, which separated from water-cooled copper by corundum tube. Plasma spectral diagnosis combined with Boltzmann mapping method to calculate the temperature of arc[28 – 29]. The optical fiber probe was connected to light-blocking plate, which had a small round hole of diameter of 0.5 mm. The size of the plate was 20 mm × 10 mm ×1 mm. In the process of experimentation, the special tungsten electrodes with 0%, 10%, 20% and 30% copper contents were taken as a variable, and other process parameter remain unchanged. Among them the tungsten electrode with 0% copper content was a very common thorium tungsten electrode. For the calculation of the average evaporation rate of the special tungsten electrode with different copper content, the tungsten electrode is weighed by an electronic analytical balance after arc ignition in 10 seconds, and the results are shown in Table 2.
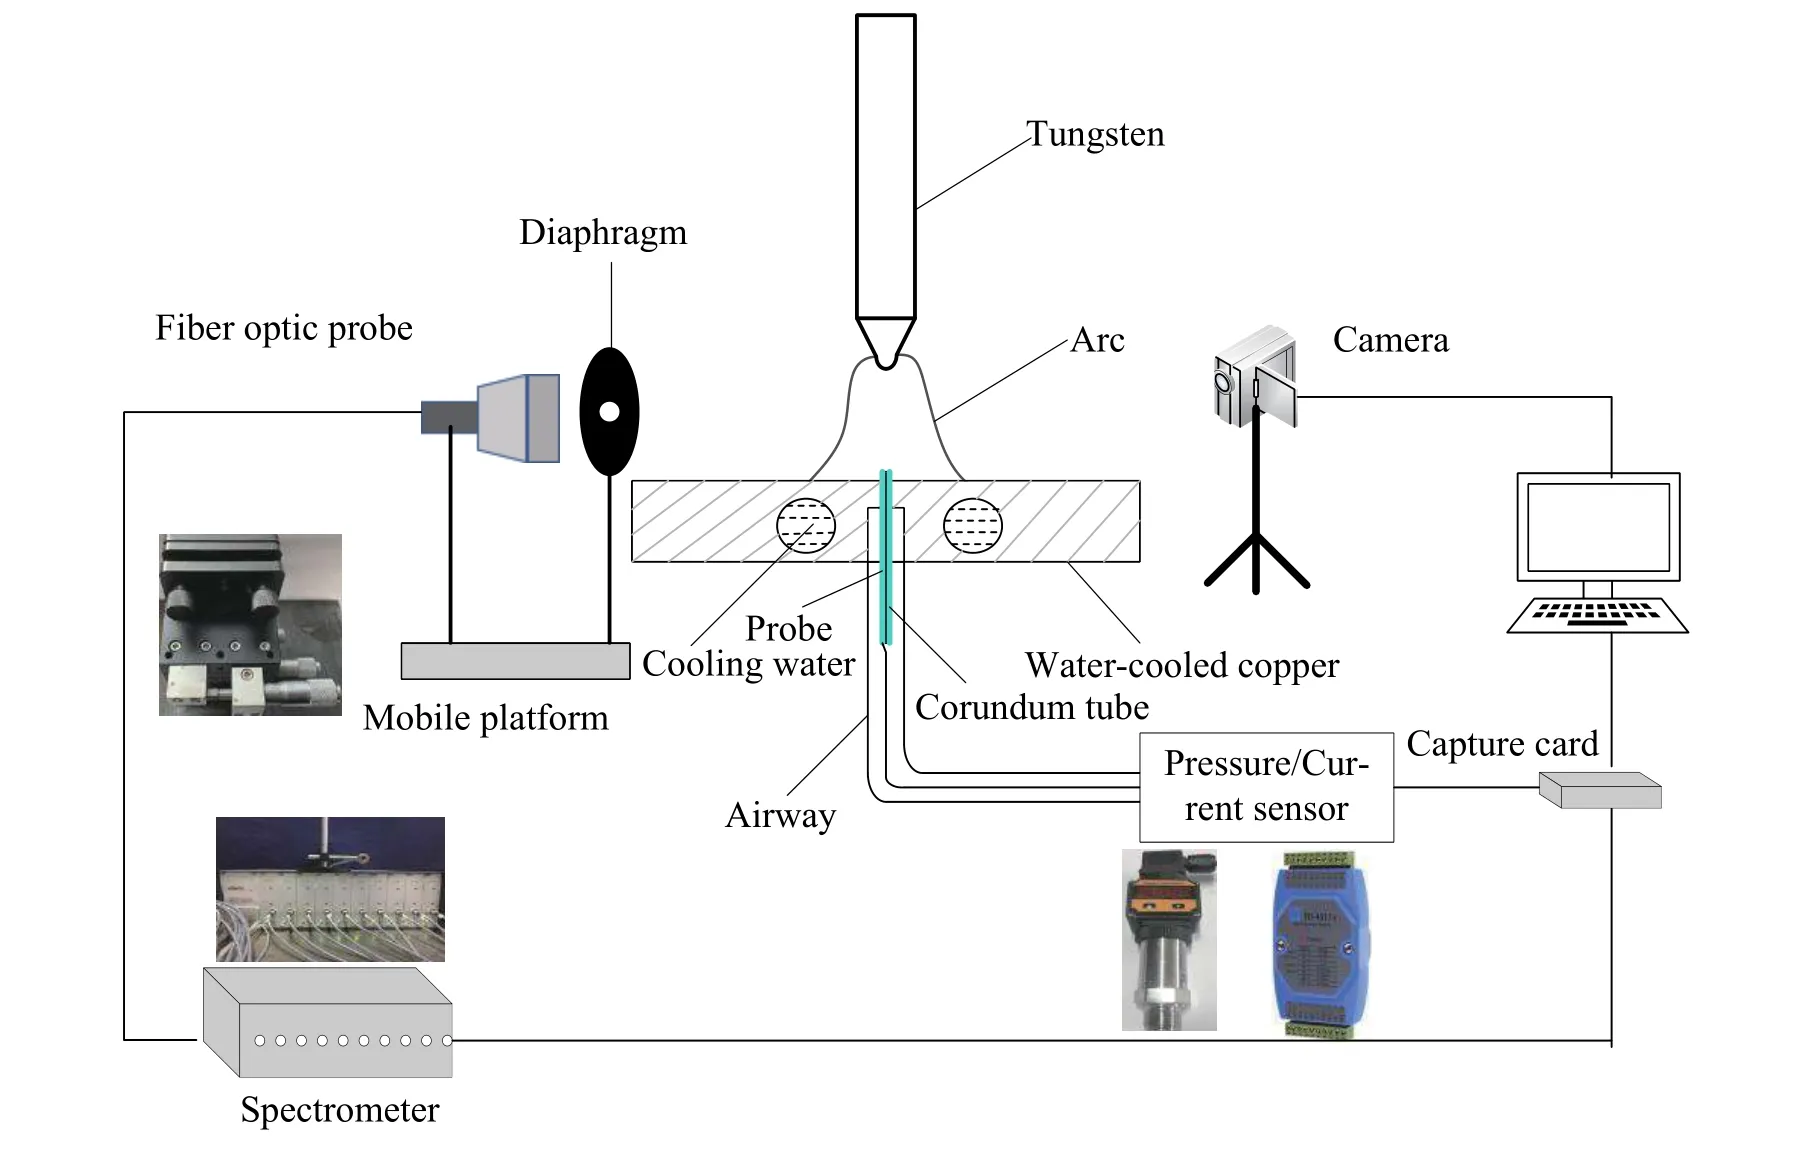
Fig.1 Schematic illustration of experimental system
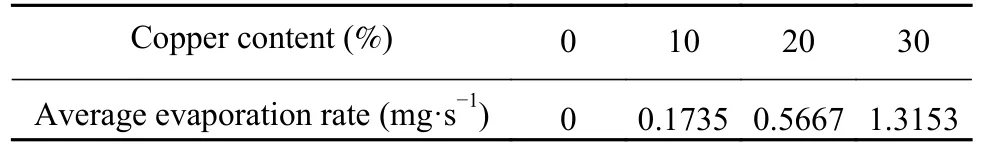
Table 2 Average evaporation rate with different content(mg·s−1)
2 Experimental results
2.1 Effect of copper vapor on arc morphology
Fig. 2 shows the arc morphology changing with time for special tungsten electrodes with copper contents of 0%,10%, 20% and 30%, which obtained by using a (510±5) nm narrowband filter in 4 s. It can be seen from the figure that the arc morphology of the tungsten electrode with 0% copper content basically does not change with time after arc ignition. Att= 1s, the arc morphology of the tungsten electrodes with 10% and 20% copper content is basically the same as that of 0%, but arc morphology of the tungsten electrode with 30% copper content changes obviously due to the presence of copper vapor. Att= 2 s, the tungsten electrodes with 10% and 20% copper content begin to evaporate copper vapor. Att= 3 s, it can be seen from the figure that the arc of special tungsten electrode consisted of two parts: a highly luminous core area and the surrounding green luminous area. Att= 4 s, the evaporation process of copper vapor in special tungsten electrodes reach a stable state. At this time, it can be found that the radius of the green luminous area around the arc increases with the increase of copper content from the arc morphology. It needs to be explained that the arc morphology of tungsten electrode with 0% copper content is also green, mainly due to the partial coincidence of the wavelength range of CuⅠ and ArⅡ.
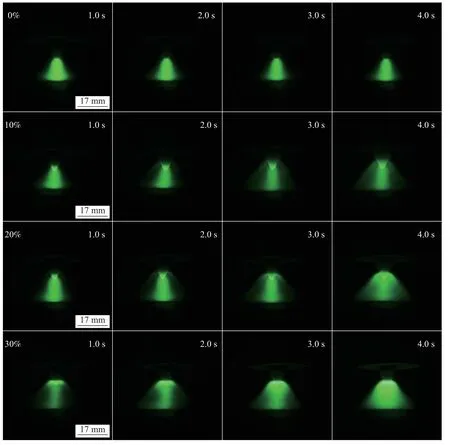
Fig.2 High-speed photographic images of special tungsten electrode with different content of copper by using a (510±5) nm narrowband filter
Fig. 3 shows the arc morphology changing with time for special tungsten electrodes with copper content of 0%, 10%,20% and 30%, which obtained by using a (780 ±5) nm narrowband filter in 4 s. It reflects the spatial distribution of Ar in the arc plasma with time. It can be seen from the figure that the arc morphology of the tungsten electrode with 0%copper content basically does not change with time after arc ignition, which is consistent with that shown in Fig. 2. The special tungsten electrodes with 10%, 20% and 30% copper content are quickly form a bright ball at the tip of the tungsten pole after arc ignition. Att= 1 s, the arc morphology of the tungsten electrodes with 10% and 20% copper content are basically the same as that of 0%, but the arc radial size of tungsten electrode with 30% copper content decreases obviously. Att= 2 s, the arc radial size of tungsten electrodes with 10% and 20% copper content also begin to decrease gradually. Att= 4 s, for tungsten electrodes with copper content of 10%, 20% and 30%, as time passed, the radial size and brightness of the arc will gradually decrease.And the change of arc morphology is obviously different due to the difference of copper content in special tungsten electrodes. The decrease of brightness and arc radial size of tungsten electrode with 30% copper content is the most obvious. It also confirms that the existence of copper vapor leads to the decrease of the temperature of the arc center,resulting in reducing the size and brightness of the arc center. This phenomenon is more obvious with the increase of the content of copper vapor in the arc plasma.
Fig.3 High-speed photographic image of special tungsten electrode with different content of copper by using a (780±5) nm narrowband filter
Fig. 4 a shows the morphology of tungsten tip after arc initiation of 10 s, it can be seen from the picture that the tungsten tip forms a bright hemisphere with a diameter of 1mm after starting the arc. In order to further determine the new phase formed at the tip of tungsten electrode, the interface at the tip is analyzed by X-ray diffraction (XRD), the test result is shown in Fig 4 b. The results show that the tungsten tip is most likely to form a phase of CuW, the material not only has the high temperature resistance of W, but also combines the high conductivity of Cu, so the heat load and temperature gradient are very large. When the surface temperature is very high, the heat exchange is mainly characterized by heat conduction, the heat accumulated at the tungsten tip is transferred backward, and melting and vaporization occurs in other parts of the material. Therefore, it is found that even after a large amount of copper vapor is evaporated, the tungsten tip can still maintain its previous shape, which can meet the requirements of the test.
Fig.4 The change of tungsten electrode tip after arc initiation of 10 s (a) Tungsten electrode tip morphology (b) Tungsten electrode tip XRD analysis
2.2 Effect of copper vapor on arc voltage
The synchronous voltage signal collected during welding is shown in Fig. 5. Att= 1s, the arc starting voltage increases gradually with the increase of copper content in WCu composites,and the maximum voltage difference is 4V.This is because the original cold cathode is transformed into a hot cathode due to the addition of copper, electron emission no longer depends on hot electron emission. The moving speed of cathode spot increases with the increase of copper content, resulting in increasing in arc voltage. For the thorium-tungsten electrode with 0% copper content, it relies on hot electron emission, and the cathode spot is fixed, so the arc voltage is relatively low and does not change with time. After 3 seconds, arc voltage curve of the special tungsten electrode with 10%, 20% and 30% copper content gradually tend to smooth. Att= 4 s, the concentration of copper vapor reaches the maximum in the arc plasma. It can be seen from the figure that the arc voltage of 30% copper is obviously higher than that of other contents,and the maximum difference is about 1.5 V. Because the sharp cooling of the arc leads to the decrease of electrical conductivity, the arc voltage increases gradually.
Fig.5 Effect of copper vapor on arc voltage
2.3 Effect of copper vapor on arc pressure on the anode surface
Fig.6 shows the arc pressure distribution curves of special tungsten electrodes with copper content of 0%, 10%,20% and 30%. It can be seen from the figure that the copper content is 0%, the peak arc pressure is 387 Pa, with the increase of copper content in tungsten-copper composites,the peak arc pressure gradually decreases. The pressure at the center of the arc decreases to 298 Pa when the copper content is 10%, to 272 Pa when the copper content is 20%,and to 228 Pa when the copper content is 30%. The arc pressure distribution curve shows Gaussian distribution, and the peak pressure appears in the center of the arc.
Fig.6 Effect of copper vapor on arc pressure on the anode surface
2.4 Effect of copper vapor on current density on the anode surface
Fig. 7 shows the current density distribution curves of special tungsten electrodes with copper content of 0%, 10%,20% and 30%. It can be seen from the figure that the copper content is 0%, the peak current density is 21.1 A/mm2,with the increase of copper content, the peak current density gradually decreases. The current density at the center of the arc decreases to 18.6 A/mm2when the copper content is 10%, to 11.6 A/mm2when the copper content is 20%, and to 6.4 A/mm2when the copper content is 30%. The current density distribution is always a unimodal distribution, and the peak value is in the center of the arc.
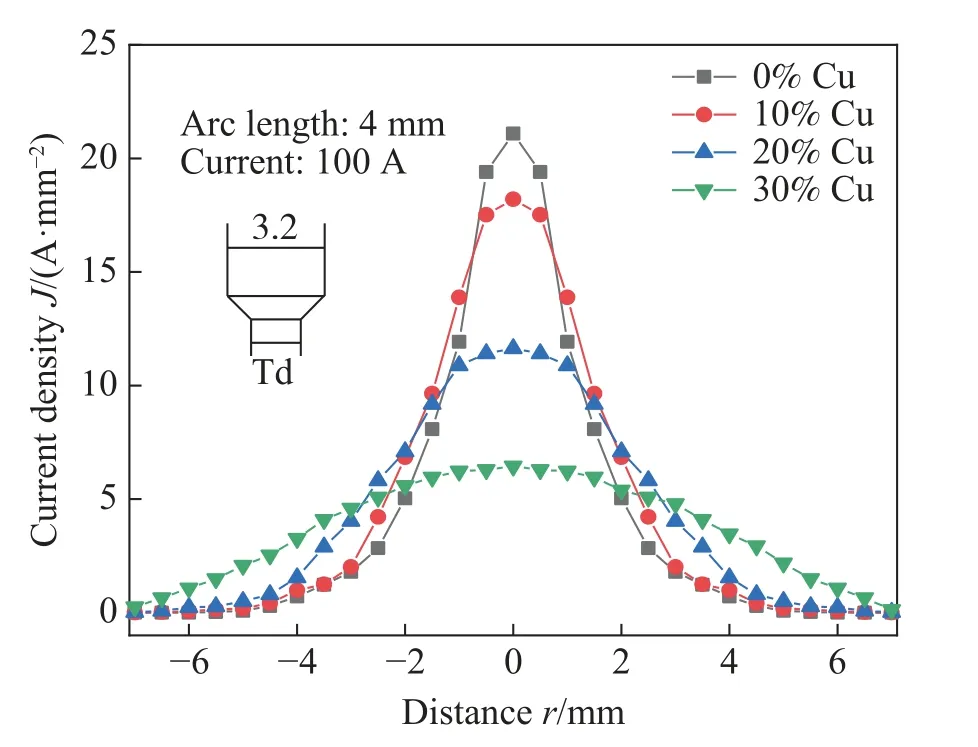
Fig.7 Effect of copper vapor on current density on the anode surface
2.5 Effect of copper vapor on arc axial temperature
It is found that the characteristic spectrum of ArⅡ in 375−475 nm band can meet the requirements of spectral line selection of Boltzmann mapping. Query the NIST database (transition probabilityA, statistical weightgand excited-state energyE) to calibrate the characteristic spectral lines[30]. TakingEas abscissa and ln (I/νAg)as ordinate (vis freguency), the points are drawn and fitted by least square method. The slope of the straight line is (−1/kT), whereTis the excitation temperature. After calculation, the arc axial temperature distribution is obtained. Fig. 8 shows the arc axial temperature distribution of special tungsten electrodes with copper content of 0%, 10%, 20%, and 30%. As can be seen from the figure that the closer to the cathode, the higher the arc temperature. In the absence of copper vapor, the maximum axial temperature of the arc is 21 611 K, with the increase of copper vapor, the axial temperature near the arc gradually decreases, the maximum axial temperature of the arc drops to 15 762 K when the copper content is 30%.
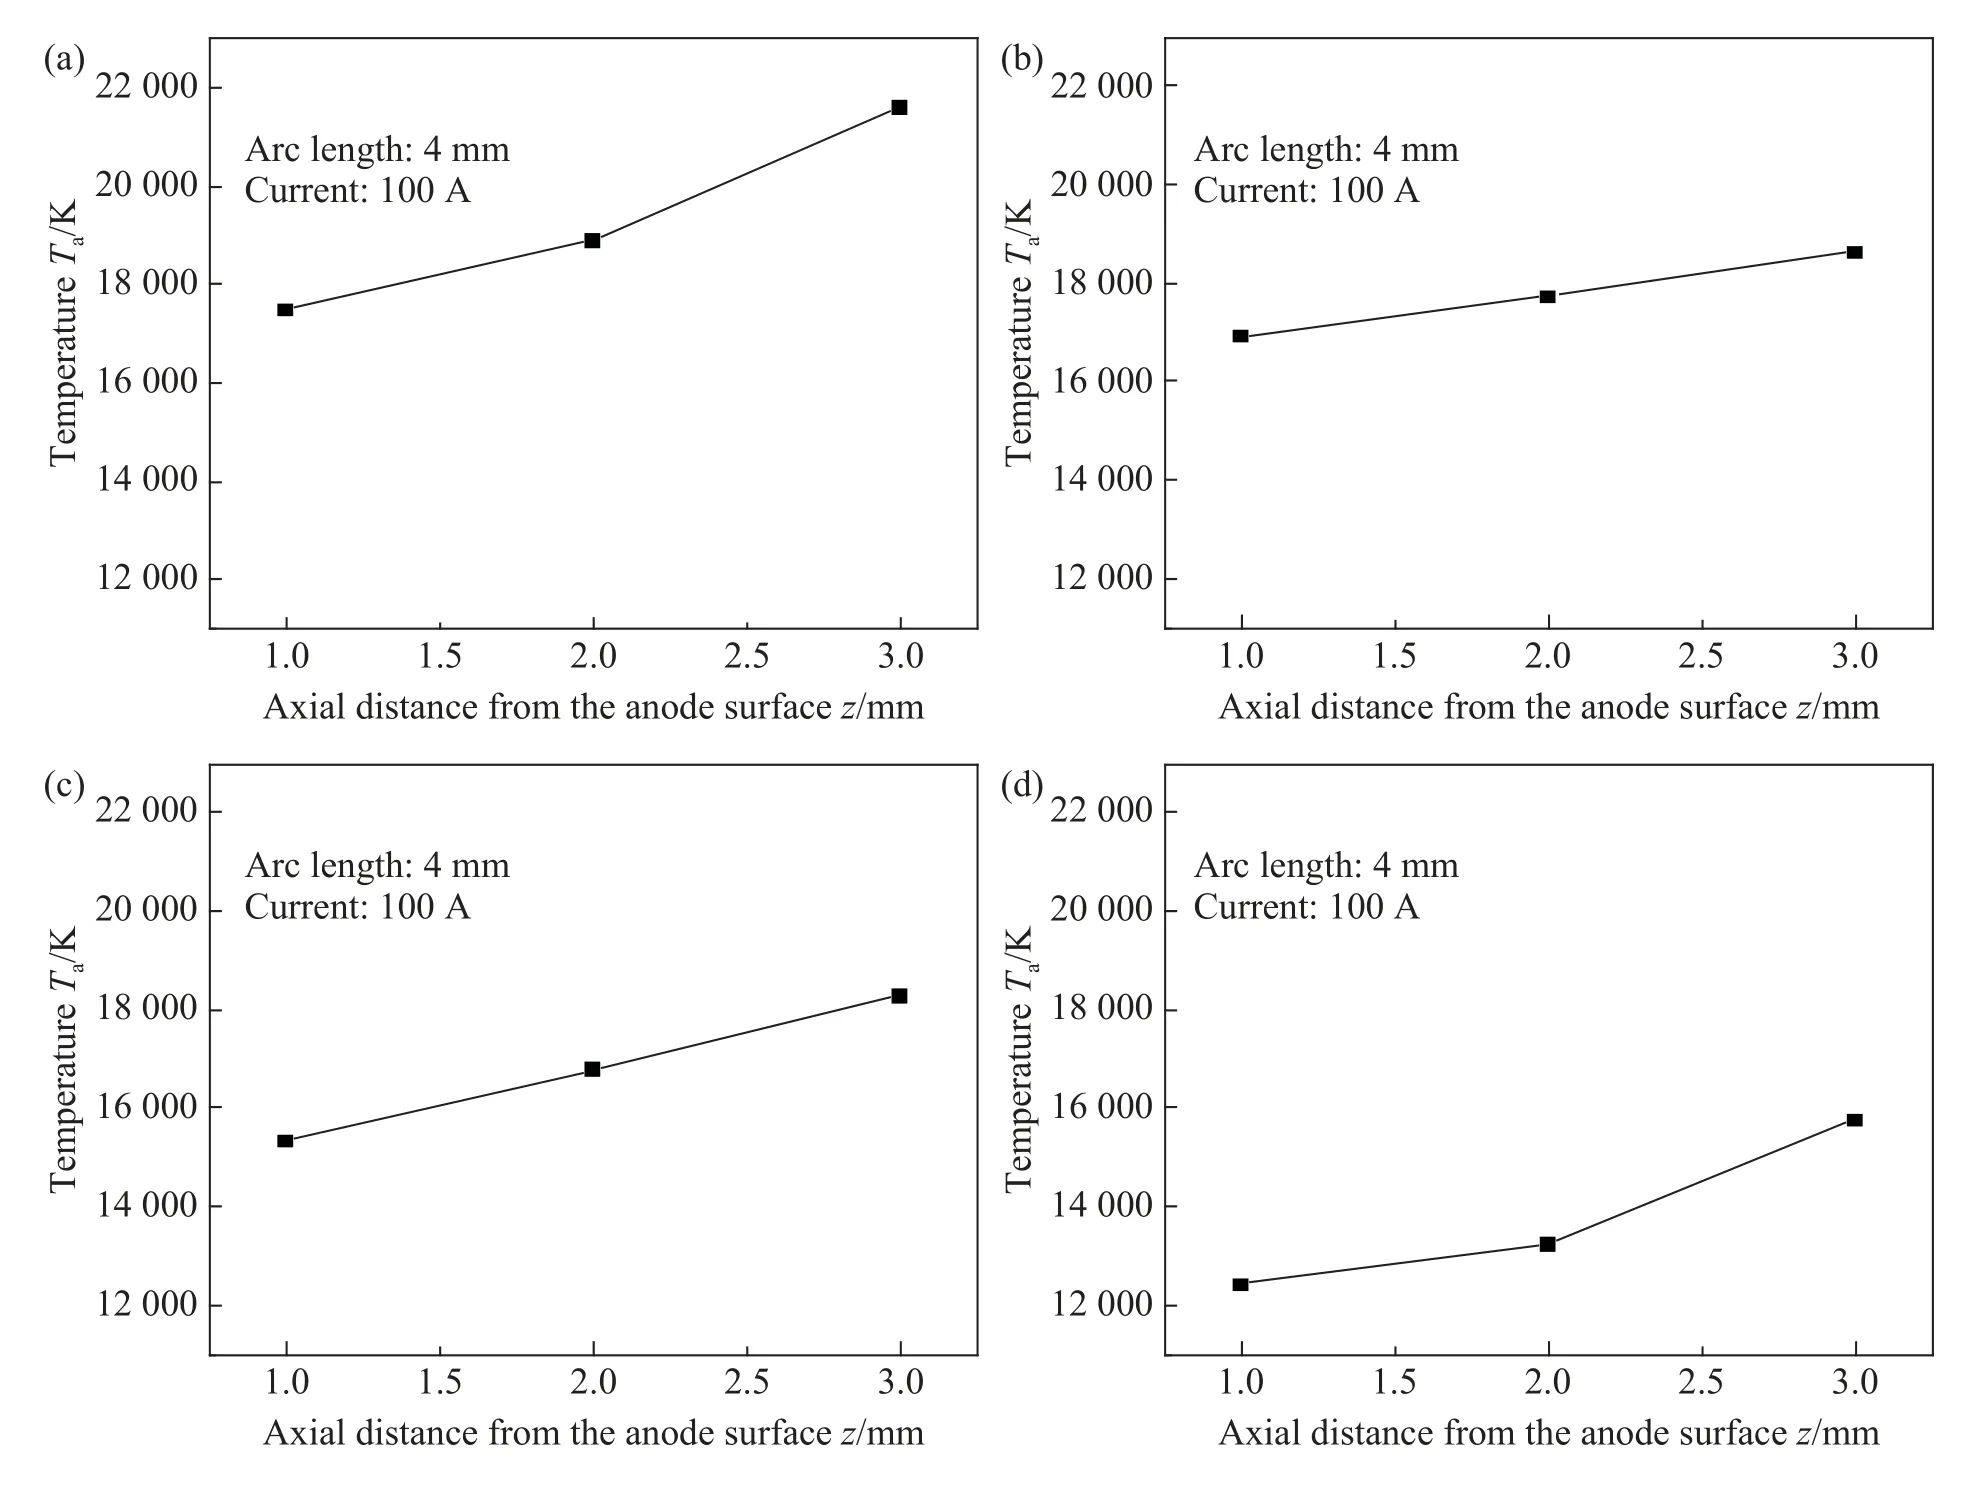
Fig.8 Effect of copper vapor on arc axial temperature (a) 0% Cu (b) 10% Cu (c) 20% Cu (d) 30% Cu
3 Mathematical models
3.1 Assumptions
Arc is a complex physical process under the action of sound, light, heat, force, electricity, magnetism and other factors. Considering the importance of the factors affecting the arc and the accuracy of the calculation, we made the following assumptions for the established arc model:
(1) Arc plasma is in steady state and has the property of symmetry.
(2) The radiation-related calculation parameters are expressed by the net radiation coefficient, regardless of the absorption of radiation energy by the low temperature part of the plasma.
(3) The arc is a laminar flow Newton fluid, and at standard atmospheric pressure, it is a stable and continuous medium.
(4) Ignore the heat loss caused by arc viscosity effect.
3.2 Control equations
Based on the above assumption of TIG welding arc model, a two-dimensional axisymmetric arc analysis model is established. All the governing equations used can be written in a unified form, it is physical quantities represented byΦ、ГΦandSΦthat listed in Table 3 in the different governing equations[31 – 32].
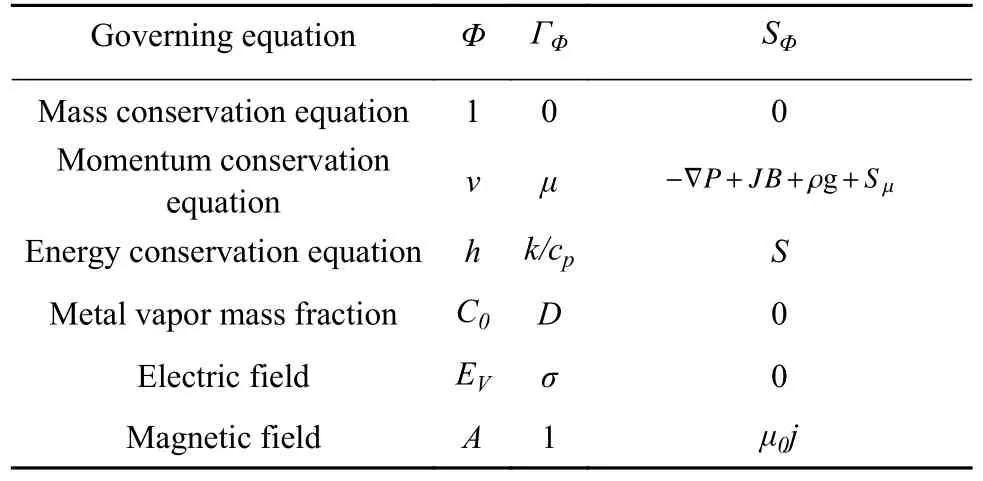
Table 3 Meaning of equation and corresponding variables
Unified form of governing equation:
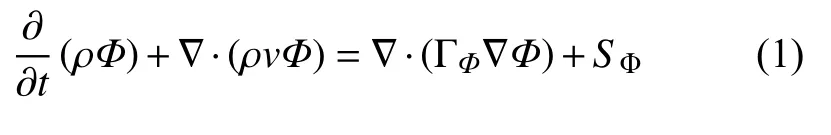
The source termSin the Eq. (1) can be expressed as follows for the arc plasma. The energy source term includes the current Joule heat source term, the electron transport enthalpy source term and the arc radiation heat loss source term[33 – 34].
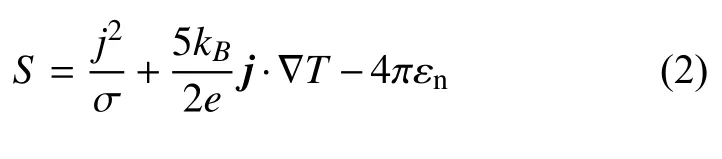
whereσis the conductivity,kBis the Boltzmann constant,eis the electron quantity, andεnis the net radiation coefficient.
In order to consider the effect of copper vapor on arc characteristics, the component transport equation of copper vapor is introduced. The binary diffusion coefficient in the diffusion term of the mass fraction conservation equation of copper vapor is calculated as[35 – 36]
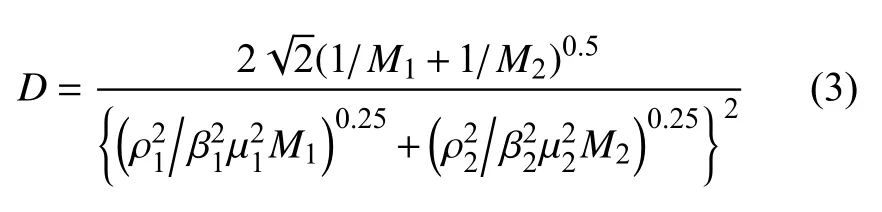
WhereM1andM2are the molar masses of copper and argon atoms;ρ1,μ1andρ2,μ2are the density and viscosity of copper vapor and Ar, respectively.β1andβ2are dimensionless constants, which are generally 1.20−1.543 in a large number of different gases, and1.385 is taken here.
Ohm's law and Helmholtz decomposition equation are expressed as
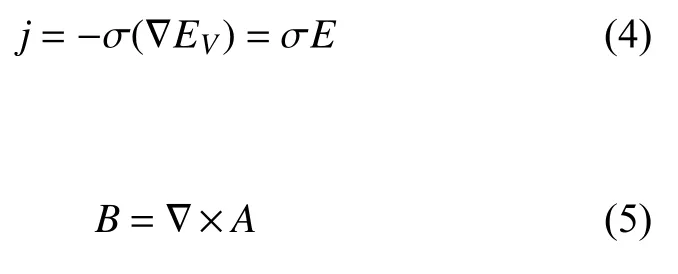
WhereEVis the electric potential,Ais the magnetic vector potential,Eis the electric field strength.
3.3 Boundary conditions
Table 4 shows the boundary conditions of the two-dimensional arc analysis model, and the specific two-dimensional axisymmetric TIG welding arc model is shown in Fig. 9
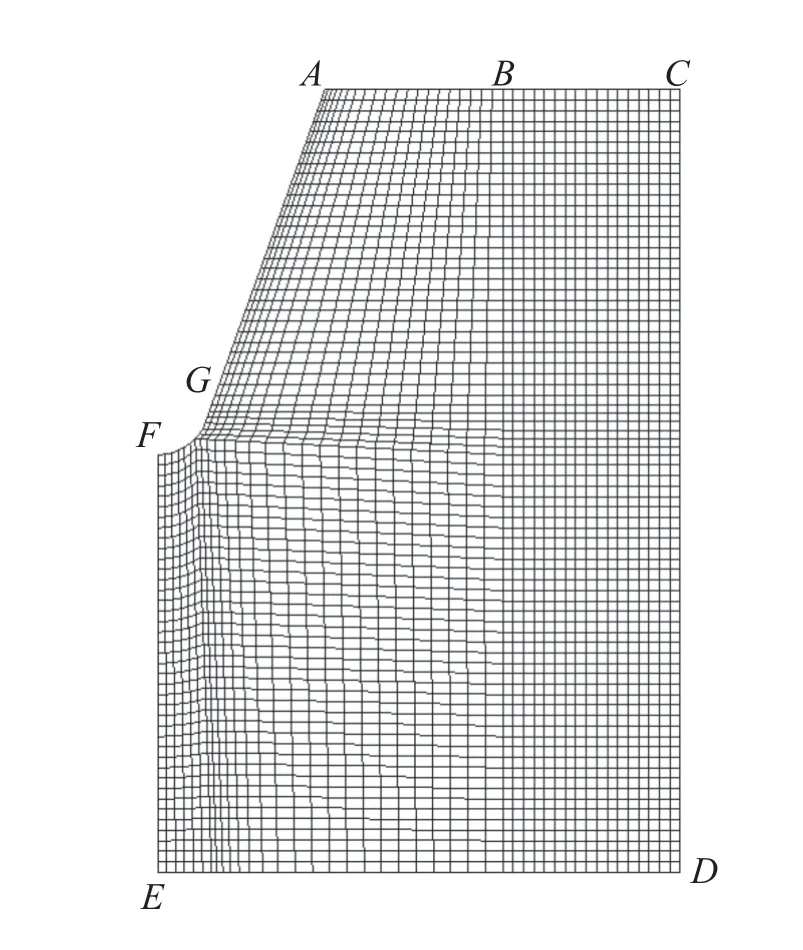
Fig.9 Two-dimensional arc analysis mode
In the welding process, the argon gas flow rate is 10 L/min, the inner diameter of the welding gun is 6.6 mm,and the diameter of the tungsten electrode is 3.2 mm. According to the above data, it can be calculated that the crosssectional area of the argon gas inlet is about 26.17 mm2, so the argon gas flow rate at the gas inlet is about 6.372 m/s.The electric potential on the surface of tungsten electrode is the most important boundary condition in the process of arc calculation and simulation. In this paper, the electric field will be calculated by setting the relative potential difference.The surface potential of the anode is zero, and the current density on the surface of the sharp angle tungsten electrode can be expressed as
whereris distance from the arc center.
3.4 Numerical processing
GAMBIT software is used for geometric modeling. The diameter of tungsten electrode is 3.2 mm, the cone angle is 60°. The welding parameters used in numerical analysis are as follows: welding current is 100 A, arc length is 4 mm,gas flow is 10 L/min, simulation time is 1 s. In the model,copper vapor is generated by the tip of tungsten pole and the evaporation of copper vapor is calculated by experimental measurement. The copper vapor evaporation rate used in the calculation is shown in Table 2.

Table 4 Boundary condition
The whole computing domain is divided by unstructured grid. The electromagnetic variable is added to the user-defined variable (user-defined scalars, UDS), and the corresponding source term and boundary conditions are added by using the user-defined function (user-defined functions, UDF). The equations are solved by SIMPLEC algorithm and discretized by the second-order upwind scheme to ensure the accuracy of calculation. The physical parameters of Ar-Cu mixtures come from Murphy in simulation[3, 4, 37 – 39].
4 Simulation results and discussion
By establishing and calculating the two-dimensional model of GTAW arc considering different content of copper vapor, the distribution of copper vapor in the arc,changes in arc voltage, pressure, current density distribution and temperature field are analyzed.
4.1 The distribution of copper vapor
Fig. 10 shows the distribution of copper vapor in the arc plasma, Fig. 10 a shows the distribution of copper vapor of special tungsten electrode with copper content of 10%,Fig. 10 b shows the distribution of copper vapor of special tungsten electrode with copper content of 20%, Fig. 10 c shows the distribution of copper vapor of special tungsten electrode with copper content of 30%. Through calculation,it is found that with the increase of copper content, the concentration of copper vapor also increases gradually in arc plasma, the radial radius of arc also increases gradually. For constant current GTAW, the electric field strength in the arc is constant. With the increase of copper vapor concentration, the arc wants to maintain stable combustion only by increasing the conductive cross section. This is consistent with the arc morphology captured by Fig. 2 in the experimental results, the green area around the arc increases with the increase of copper vapor. At the same time, it can be seen from Fig. 10 that the copper vapor is mainly concentrated in the center of the arc. The presence of copper vapor reduces the brightness and size of the arc core, which is proved by the arc morphology captured by Fig. 3. Because of the radiation loss increases, causing the arc center to cool sharply.
Fig.10 Comparative diagram of copper vapor distribution (a) Special tungsten electrode with 10% copper content(b) Special tungsten electrode with 20% copper content(c) Special tungsten electrode with 30% copper content
4.2 The changes in arc voltage
Fig. 11 shows the change of arc voltage when different contents of special tungsten electrodes are used. It can be seen from the figure that when the copper content is 0%, the arc voltage is 10.8 V. Because of the arc voltage is lower because the thorium-tungsten electrode relies on hot electron emission and the cathode spot is fixed. However, with the increase of copper content, the arc voltage increases gradually. when the copper content is 30%, the arc voltage reaches the maximum value of 12.73 V, and the maximum difference is 1.93 V. This is consistent with the effect of copper vapor on arc voltage in Fig. 5. The main reason for this phenomenon is that the ionization energy of copper vapor is much lower than that of argon, resulting in copper vapor participates in ionization. This is because the copper vapor entering the arc increases the net emissivity, resulting in decreasing in arc conductivity.
Fig.11 Effect of copper vapor on the arc voltage
4.3 Distribution of arc pressure and current density
Fig. 12 shows contrast diagram of special tungsten electrodes with copper content of 0% and10%. Fig. 12 a shows the contrast diagram of arc pressure, Fig. 12 b is the contrast diagram of current density. It can be found that the anode surface pressure decreases significantly and the current tends to flow through the edge of the arc after considering copper vapor.
Fig.12 The contrast program of Cu-W electrode with copper content of 10%.(a) The contrast diagram of arc pressure(b) The contrast diagram of current density
Fig. 13 shows the arc pressure distribution curve of special tungsten electrodes with copper content of 0%, 10%,20% and 30%. It can be seen from the figure that the arc pressure distribution curve shows a Gaussian distribution,and the peak pressure appears in the center of the arc. The peak arc pressure is 377 Pa when no copper vapor in the plasma, with the increase of copper content, the peak decreases gradually, it decreases to the lowest 291 Pa when the copper content is 30%. This is consistent with the trend of arc pressure change in Fig. 6. The main reason for this phenomenon is that with the increase of copper vapor concentration, the arc conductive section size increases, arc becomes dispersed, electromagnetic contraction effect weakens, resulting in the gradual decrease of arc pressure.
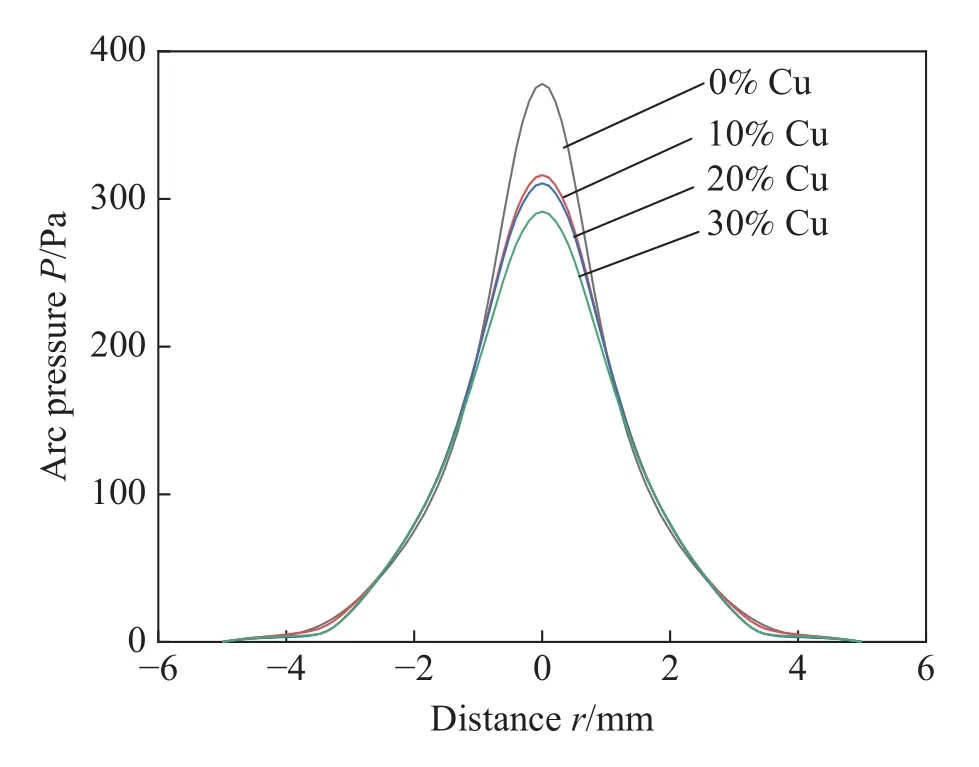
Fig.13 Distribution curve of arc pressure on the anode surface
Fig. 14 is the current density distribution curve of special tungsten electrodes with copper content of 0%, 10%,20% and 30%. It can be seen from the figure the current density at the center of the arc is 10.07 A/mm2in the absence of copper vapor. With the increase of copper content,the peak decreases gradually, to the lowest 7.3 A/mm2when the copper content is 30%. The changing trend of current density in the center of arc is consistent with that of Fig. 7.The main reason for this phenomenon is that with the increase of the copper vapor concentration, the current tends to flow through the electrode edge, which expands the current path, reduces the heat flux density and current density in the arc center, resulting in the decrease of the current density in the center of the arc. The distribution of current density in Fig. 14 is different from that in Fig. 7. When the content of copper reaches 30%, the distribution of current density changes from unimodal distribution to bimodal distribution. It is considered that when the arc temperature is higher than 10 000 K, the arc satisfies the LTE. The main reason for this phenomenon is that in the calculation, copper vapor is mainly concentrated near the arc center 1 mm,and there is little distribution around it, as can be seen in Fig. 10. However, in practical welding, the copper vapor distribution is more dispersed and the distribution around the arc is much higher than calculated, as can be seen from Fig. 2.
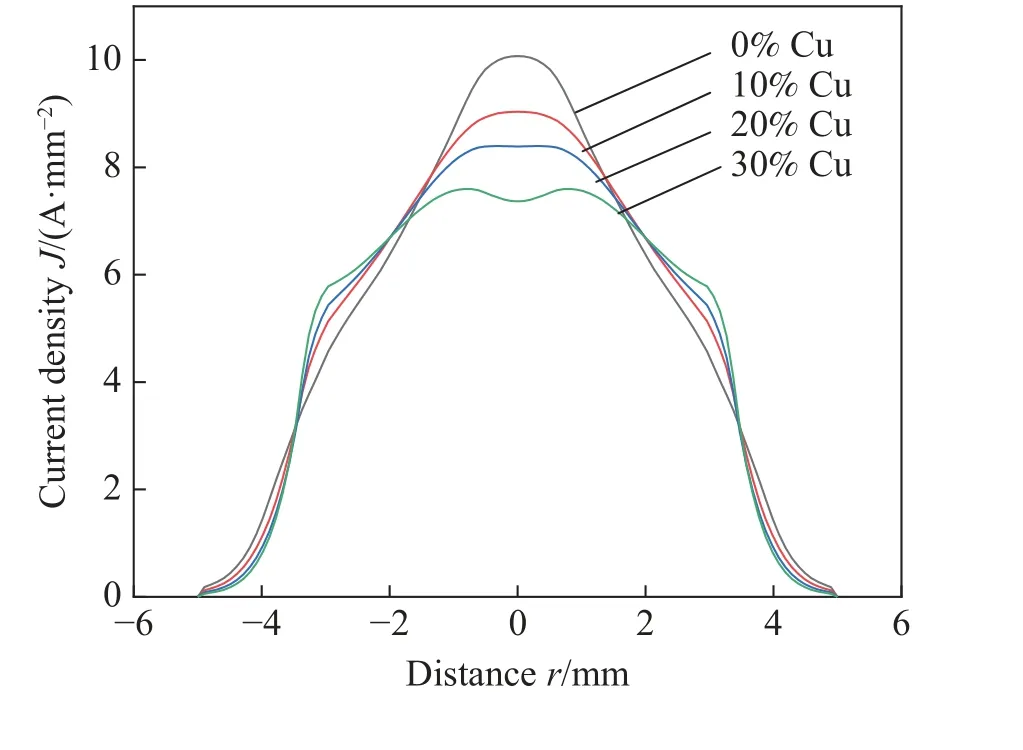
Fig.14 Distribution curve of current density on the anode surface
Fig. 15 shows the comparative diagram of arc temperature field distribution in the case of no copper vapor and different content of copper vapor. Fig. 15 a shows special tungsten electrode with 10% copper content, Fig. 15 b shows special tungsten electrode with 20% copper content,Fig. 15 c shows special tungsten electrode with 30% copper content. It can be seen from the figure that the temperature near the axis of the arc is the highest, and the temperature near the cathode reaches the maximum. When there is no copper vapor, the axial temperature of the arc can reach 23 142 K. With the increase of copper vapor, the axial temperature decreases gradually. the axial maximum temperature reaches 16 115 K when the copper content is 30%. This is consistent with the trend that the axial temperature of arc decreases gradually with the increase of copper content in Fig. 8. The main reason for this phenomenon is that the existence of copper vapor allows the current to flow through the larger radius area, resulting in a decrease in the peak current density, resulting in decrease the axial temperature of the arc. Another important reason is that whenT≥ 10 000 K,the net radiation coefficient of 1% argon-copper mixed gas is 108[40]. Therefore, with the gradually increase of copper vapor in the arc, the radiation effect is dominant, which reduces the ohmic heat of the arc, resulting in a sharp cooling of the axial temperature of the arc. Fig. 16 shows the arc radial temperature distribution of special tungsten electrodes with 0% and 30% copper content at 1mm on the anode surface. As can be seen from the picture, for the tungsten electrode with 0% copper content, the radial temperature gradually decreases with the increase of radial distance at 1 mm.However, for the special tungsten electrode with copper content of 30%, the radial temperature increases first and then decreases at 1 mm, and a "low-temperature cavity" appears near the 1 mm[41]. This is consistent with the bimodal distribution of current density. The main reason for this phenomenon is that copper vapor is concentrated in the center of the arc, and the radiation effect makes the center of the arc cool sharply.
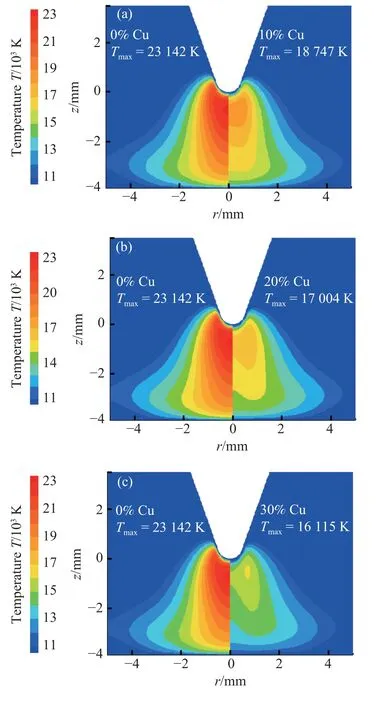
Fig.15 Comparative diagram of temperature field distribution (a) Special tungsten electrode with 10% copper content(b) Special tungsten electrode with 20% copper content(c) Special tungsten electrode with 30% copper content
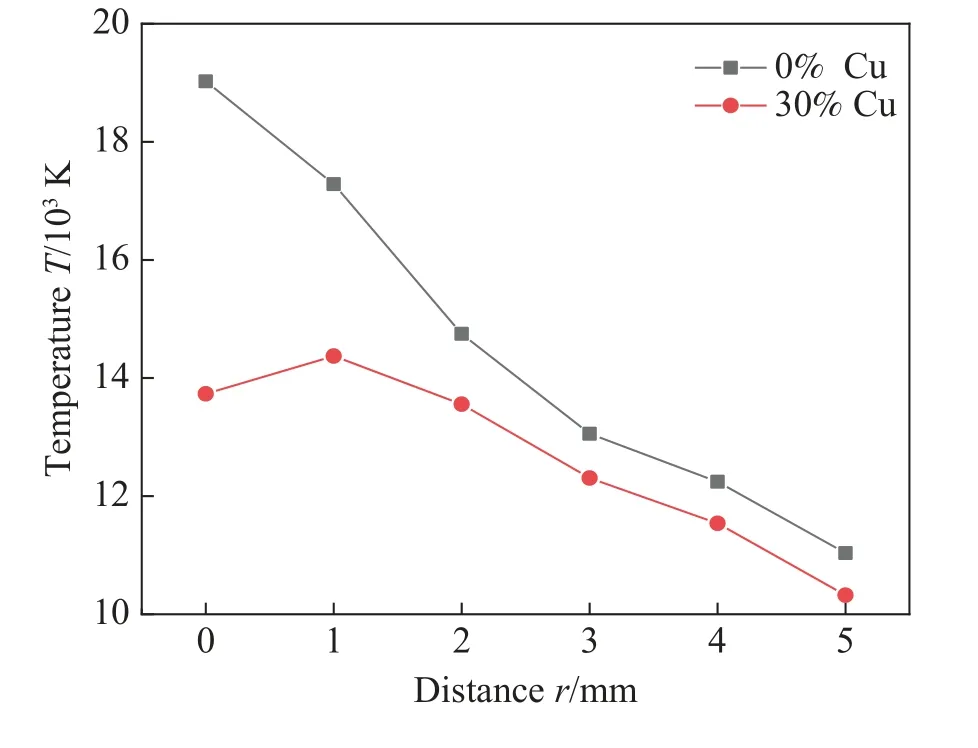
Fig.16 Radial temperature distribution of arc at 1 mm on the anode surface
5 Conclusions
Based on the experiment and mathematical model, the effect of different concentrations of copper vapor on arc characteristics in GTAW was studied. The main conclusions are summarized as follows:
(1) The tungsten-copper materials with copper contents of 0%, 10%, 20% and 30% are made into special tungsten electrodes, which replace the melting electrode to generate copper vapor. This study may provide a new experimental method for transferring metal vapor into the arc plasma.
(2) When the copper vapor is transported into the arc plasma, the arc consists of two parts: a high brightness arc core and the surrounding green luminous region. With increase of copper vapor concentration, the radius of the greenish region gradually increases, the brightness and radius of the core area gradually decreases, and the axial temperature of the arc also decreases gradually.
(3) With increase of copper vapor, the distribution of arc pressure and current density gradually flattened on the anode surface. When the copper content is 30%, the arc pressure in the arc center decreases to the lowest of 228 Pa, and the current density decreases to the lowest of 6.4 A/mm2.
(4) Numerical simulation results show that the distribution of copper vapor, arc pressure and temperature field are basically consistent with the experimental results. However,the current density distribution changes from unimodal to bimodal when the content of copper in electrode reaches 30%. The main reason is that the copper vapor concentration in the arc center is higher in the simulation.
- China Welding的其它文章
- Research on stretching flame correction technology of aluminum alloy ship frame skin welding structure
- Application of silver nanoparticles in electrically conductive adhesives with silver micro flakes
- Groove modeling and digital simulation for intersecting structures of circular tubes based on coplanarity of vectors
- A novel single wire indirect arc metal inert gas welding process operated in streaming mode
- A review of welding residual stress test methods
- Ceramic-copper substrate technology introduction