
Role of unsteady tip leakage flow in acoustic resonance inception of a multistage compressor
2023-11-10 02:18XiohuLIUZihoWUChngxinSIJunYANGXiofngSUN
CHINESE JOURNAL OF AERONAUTICS 2023年10期
Xiohu LIU, Ziho WU, Chngxin SI, Jun YANG, Xiofng SUN
a School of Aeronautics and Astronautics, Shanghai Jiao Tong University, Shanghai 200240, China
b Key Laboratory(Fluid Machinery and Engineering Research Base)of Sichuan Province,Xihua University,Chengdu 610039,China
c China Three Gorges Investment Management Co.Ltd, Shanghai 200124, China
d School of Energy and Power Engineering, University of Shanghai for Science and Technology, Shanghai 200093, China
e Research Institute of Aero-Engine, Beihang University, Beijing 100191, China
KEYWORDS
Abstract In previous studies, a theoretical model was developed after Acoustic Resonance (AR)was experimentally detected in a four-stage compressor,and AR inception was proposed to be triggered by an unknown sound source,which is a pressure perturbation of a specific frequency with a suitable circumferential propagation speed.The present paper, which is not dedicated to the simulation of acoustic field,aims to identify the specific sound source generated by the unsteady tip leakage flow using the unsteady Computational Fluid Mechanics (CFD) approach.After a comprehensive analysis of an Unsteady Reynolds Averaged Navier-Stokes (URANS) simulation,a pressure perturbation of non-integer multiple of rotor frequency is found at the blade tip.Since the essence of the tip leakage flow is a jet flow driven by the pressure difference between two sides of blade,a simplified tip leakage flow model is adopted using Large Eddy Simulation(LES)in order to simulate the jet flow through a tip clearance.It is found that the convection velocity of shedding vortices fits the expected propagation speed of the sound source, the frequency is also close to one of the dominating frequencies in the URANS simulation, and the resultant combination frequency coincides with the experimentally measured AR frequency.Since such a simplified model successfully captures the key physical mechanisms, it is concluded that this paper provides a piece of unambiguous evidence on the role of unsteady tip leakage vortex in triggering the AR inception of the multistage compressor.
1.Introduction

Nomenclature A System matrix of a linear system Ac Amplitude of circumferential mode Amp Amplitude of dynamic mode c Length of blade chord cj Coefficient of each mode eN-1 (N - 1)th unit vector f Frequency fc Combined frequency of sound source detected in stationary system fs Frequency of sound source k Residual term Ks Coefficient of circumferential propagation velocity relative to shroud m Circumferential mode P Pressure matrix Q Value of Q criterion Rtip Blade radius S Approximate matrix t Time moment U Left singular matrix V Right singular matrix vrel Circumferential velocity in relative coordinate frame of rotor vstn Circumferential velocity in stationary coordinate frame μ Norm of eigenvector λj Eigenvalue yj Eigenvector θ Circumferential position ω Angular frequency φ Base mode of dynamic mode decomposition method Σ Diagonal matrix Subscripts i, j, N Integer m, n Total number of angular position and moments stn Stationary coordinate frame rel Relative coordinate of rotor Abbreviation AR Acoustic Resonance BPF Blade Passing Frequency DMD Dynamic Mode Decomposition FFT Fast Fourier Transformation LES Large Eddy Simulation RF Rotor Rotational Frequency URANS Unsteady Reynolds-Averaged Navier-Stokes equations
Since the invention of modern aeroengine, the aerodynamic performance of compressor has partly been limited by flow instability.1Several types of typical unstable flow phenomena such as rotating stall and surge directly influence the stability margin of the aeroengine.With the efforts of researchers over decades, a considerable amount of literature has been published on flow stability,2–4and the mechanisms of these phenomena have almost been explained.Flow separation generally appears when the leading edge of blade meets the flow with a relatively large angle of attack.Due to flow separation,blockage then occurs inside one or few passages.When blockage propagates circumferentially and occupies the majority passages, rotating stall starts.Such condition may further develop into surge,which will seriously endanger the structural integrity of turbomachinery.5,6Due to the evident connection between tip leakage flow and rotating stall, profiling of the shroud endwall7,8and air injection at the blade tip are regarded as two effective ways to increase the stability margin of the compressor.Compared with rotating stall and surge,rotating instability is a mild phenomenon, but it may happen in the stable operating range of compressor.9Wang10and Wu11et al.attributed this phenomenon to the oscillation of tip clearance leakage vortices.While it is reported that the frequency of rotating instability generally appears as a broadband peak located below the Blade Passing Frequency(BPF), both tip leakage vortex and shear flow at the endwall are found to be closely related to the origin of rotating instability.9–11
Unlike rotating stall and rotating instability, less research literature on Acoustic Resonance (AR) has been published.While the noise of rotor–stator interaction occurs at an integer multiple of the blade passing frequency at any operating condition of a turbomachinery,AR is characterized as several discrete sharp peaks on the frequency spectrum at some specific flow conditions, and these resonant acoustic frequencies are not generally integer multiple of rotor Rotational Frequency(RF).The generation of AR in compressor is usually explained by a trapped acoustic mode when the frequency of acoustic wave is close to the natural frequency of the compression system at a specific operating condition.It is noted that the signal of AR could be detected even far away from the stall boundary by the acoustic measurement method.
Although Parker12first explained the phenomenon of AR in a low-speed axial compressor, researchers did not realize the possible severe consequence caused by AR until some cracks was found on the blade of a certain type of axial compressor in the 1980s.After a scrutiny of the compressor,researchers admitted that no reasons could be explained from the perspective of flow instability and mechanical vibration other than AR.Since then, researchers started to put more emphasis on the research of acoustic performance of aeroengine.Ziada et al.13found the phenomenon of AR in a turbo compressor of a gas storage station,which led to an extremely high-level vibration of the rotor blade.By installing the acoustic liner to reduce the shedding vortices from the inlet scroll,the resonance was successfully eliminated.In 2010,Lin et al.14quantified the harm of noise in the aeroengine compressor,and found that the noise from the compressor rotor could exceed 150 dB.When AR occurs, the vibration on the blade will exceed 12% of the fatigue limitation.Therefore, research on the acoustic performance can not only reduce the aeroengine noise, which is an important consideration in the modern airworthiness certification, but also protect integrity of the structure.
Due to the possible damage induced by AR,some pioneering works are also dedicated to figuring out the main characteristics of AR.Parker and Stoneman15found that the AR signal is a narrow-band and sharp peak on the frequency spectrum below the BPF.Kameier and Neise16reported that the pattern of AR is nonuniformly distributed along the circumferential direction, and the circumferential propagation speed of this phenomenon is basically a half of the rotor rotation speed.In addition,they found that the frequency of the phenomenon is usually not the integer multiples of RF.During the test on a low-speed multistage compressor, Camp17indicated that the acoustic mode has a helical structure which propagates downstream and rotates against the rotor rotation direction.The acoustic frequency is irrelevant to the axial length of the compressor, because the energy of acoustic wave is trapped in the circumferential direction.
In order to further investigate the possible reasons for AR,Kameier et al.18investigated the aeroacoustics noise in an axial fan, and explained that the tip clearance flow caused by the pressure difference between the pressure and suction sides of the blade is one of the major factors.The experimental results by Camp17showed that when AR occurs, the sound pressure level at the blade tip is much higher than the magnitude at the other spanwise location on the blade.In 2014, Ziada and Lafon19proposed a design guideline for suppressing the AR in piping systems.Hong et al.20described the lock-in mechanism of AR using a simplified discrete vortex model of compressor blade, and recently experimentally validated this model.21All the above studies suggest that shedding vortices and tip clearance flow may contribute to the generation of AR in the compressor, but neither concrete explanation nor mechanism has been sufficiently revealed so far.In addition,most of the previous conclusions,which are obtained in a simplified flat plate model or single-stage compressor, are far different from the real multistage turbomachinery situation due to the complex geometry and nonuniform flow field.An unambiguous explanation of the AR inception and flow structure in a multistage compressor is still not available.
In order to further understand the phenomenon of AR in a multistage compressor, Hellmich and Seume22performed experiments on a four-stage axial compressor.The AR signal is detected at 1487 Hz, which is about 5.22 multiples of RF.The intensity of this acoustic wave rapidly increases when the mass flow rate is gradually reduced, and the resonant acoustic wave finally triggers the rotating stall.In some circumstances, the amplitude of AR is even much higher than the BPF.Their study offered a simplified model to explain the phenomenon through an acoustic approach,but the sound source is not determined.Courtiade and Ottavy23applied this model and explained the magnitude distribution of the acoustic modes along the axial direction.These understandings of AR provide the first step for establishing an AR onset prediction method, which is still lacking.
Regarding the research on AR prediction, Woodley and Peake24firstly proposed an eigenvalue method of AR,and calculated the natural frequency in a tandem-cascade system.Liu et al.25developed a novel sophisticated theoretical model using the global linear stability theory with body force approach,which can compute the possible resonant frequency considering the effects of nonuniform flow field and geometry of the compressor system.One of the computed resonant frequencies agrees well with the experimental results by Hellmich and Seume.22Additionally,using the formula given by Liu et al.,25an unknown pulsation source with a roughly assumed circumferentially propagation speed is found to lead to a combination frequency.Because this resultant combination frequency coincides with one of the computed resonant frequencies,the onset of AR is then triggered.It is inferred that the unsteady flow at the blade tip is relevant to the unknown pulsation source.There is no doubt that the determination of the sound source is a necessity for the AR onset point prediction.However, the understanding on both the detailed mechanism of the sound source and the assumed propagation speed of the pressure pulsation remains ambiguous.It is the lack of such an unambiguous identification of the sound source that motivates the present research, which is a further in-depth investigation of our previous work.25Additionally, the propagation speed of the pressure pulsation is quantitatively derived in this paper.
As mentioned above, several studies have recognized the important role played by the tip leakage flow, but there are no unambiguous explanations and solid proofs of AR inception in a multistage compressor.Due to complexity of the interaction between the acoustic field and the nonuniform flow field in an extremely complicated configuration, a complete simulation of the evolution of the acoustic field in a multistage compressor remains some way off nowadays.The present paper, which is not dedicated to the simulation of acoustic field, aims to further explore the role of unsteady tip leakage vortices at the onset point of AR in a four-stage compressor.The results are then compared with the experimental work22to provide straightforward evidence for the theoretical model.25Additionally, a simplified tip leakage flow model is verified to provide an acceptable prediction methodology of AR onset point in industrial application.
Fig.1 shows the logical relationship between this investigation and the preceding studies.In the previous theoretical work,25a computational model of the natural frequency of the compression system is developed based on the global stability theory.One of the computed frequencies at the measured mass flow of AR onset point is found to be consistent with the measured frequency of AR in experiment.22Additionally, as indicated by the proposed formula, it is assumed that an unknown sound source at the blade tip of a specific frequency(fs, the first key parameter), which rotates with an estimated coefficient of circumferential propagation velocity relative to shroud (Ks, the second key parameter), can generate a combination frequency.Since this combination frequency agrees well with the measured AR frequency as well as the computed natural frequency of the system, it is then concluded that the theoretical model is validated by the experiment data.However,as marked by the dash line in Fig.1, both the accurate values of the two key parameters in the formula and the unknown sound source are only roughly estimated in the previous theoretical work.In the present study, the unsteady evolution of the tip leakage vortex, which is assumed to be the sound source, is the research focus.In order to provide a suitable inlet condition of the jet flow in a simplified tip leakage flow model, Three-Dimensional (3D) Unsteady Reynolds-Averaged Navier-Stokes(URANS)simulation of the compressor stage is conducted in Section 2.Meanwhile, the Key Parameter 1 obtained from the URANS simulation is also used as a mutual confirmation of the results of the simplified tip leakage flow model.Because it has been already revealed that the essence of the tip leakage flow is a jet flow driven by the pressure difference between pressure side and suction side at rotor tip, a simplified tip leakage flow model using Large Eddy Simulation (LES) in Section 3 is proposed based on this jet flow model to capture the main physics of the tip clearance flow.Furthermore, the two key parameters, which are calculated in results analysis, is validated by the measured AR frequency.In Section 4, after a comprehensive analysis is performed, the consistencies of the main frequencies and flow structures between the simplified tip leakage flow model, the URANS simulation and the measured frequency sufficiently validate both the simulation method and the main idea in this paper.
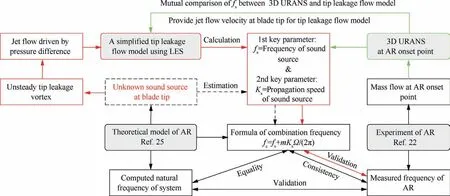
Fig.1 Logical connection between this investigation and previous theoretical and experimental studies.
To the best of our knowledge, this is the first attempt in open literature to clarify the role of tip leakage flow in triggering AR inception of an axial multistage compressor by using a simplified model.The present investigation is not committed to the simulation of the resonant acoustic field,and the main purposes of this paper can be summarized as follows:
(1) To identify the unsteady tip leakage flow as the sound source of the AR inception in a four-stage compressor.
(2) To provide supplementary evidences for the developed theoretical model of AR.
(3) To verify the capability of the proposed simplified tip leakage flow model, which can facilitate AR onset prediction for engineering application.
2.Experimental results and 3D URANS simulation
The current work is a further investigation of the experimental research by Hellmich and Seume22at the University of Hannover,Germany.Firstly,the main results of their study,which are closely relevant to the present paper, are briefly summarized below for completeness.Because AR and the blade crack induced by AR were recognized during the data processing after the experiment, a detailed measurement of the flow field were not conducted during the AR inception period.Secondly,an analysis of 3D URANS simulation results is therefore presented in order to perform the analysis in both frequency and time domains.On the one hand,this URANS simulation provides a suitable inlet condition for the following simplified tip leakage flow model using LES.On the other hand, the URANS simulation results in combination with the experimental results are also used to verify the following simplified tip leakage flow model.
2.1.Experimental results
As shown in Fig.2, the test rig is a four-stage axial compressor,which is driven by a DC motor,and the major parameters are shown in Table 1.During the test, several sensors are laid on the shroud of the compressor in order to capture the dynamic pressure at the blade tip region.At a specific rotor rotation frequency of 285 Hz, a throttle is applied to control the mass flow rate.Then, an abnormal and sharp peak of around 5.22RF on the frequency spectrum appears at the mass flow rate of 7.26 kg/s(AR onset point),as shown in Fig.3.It is noted that this mass flow rate is at about 6.5 kg/s,which is just beyond the design point and is still far away from the stall boundary.After further closing the throttle and investigating the frequency spectrum, this frequency peak is proved to be relevant to AR, and its sound pressure level becomes higher than the BPF when the mass flow rate approaches the stall point.Four experimental findings which are essential to the current research are summarized: (A) the frequency of AR detected at the shroud is about 5.22RF;(B)the mass flow rate at the onset point of AR is at around 7.26 kg/s;(C)the circumferential mode of sound source is three;(D)the sound pressure level of AR is the strongest around the third rotor.
2.2.Numerical method

Fig.2 Sketch of four-stage axial compressor (redrawn from Ref.25).
Due to the non-uniform distribution of the unsteady pressure disturbance in the circumferential direction, a single-passage simulation is not appropriate for this case, and a fullannulus simulation is therefore conducted.However, a fourstage compressor, which consists of 8 blade rows and more than 200 blade passages,will lead to a huge computation cost.As mentioned above, it is experimentally found that AR is most obvious around the third rotor, and it is also inferred in the previous theoretical work that the pulsating pressure in the tip region of Rotor 3 could play the role of sound source.Thus,a specific stage of only three blade rows,which consist of Stator 2(S2),Rotor 3(R3)and Stator 3(S3),is selected for the URANS simulation,as shown in Fig.4.Compared to the poor Fast Fourier Transformation (FFT) frequency accuracy provided by the computation of only a few rotational revolutions in the simulation conducted by Liu et al.25, the present paper not only improves the frequency accuracy by means of calculating more rotational revolutions, but also reveals the detailed flow mechanism in the inception period of AR by using several modal analysis methods.The Spalart-Allmaras(SA) turbulence model is applied in this simulation.In order to check the grid-independence solution, a total of 34.79 million and 40.0 million unstructured grids are generated.It is found that the relative error of the resultant total pressure ratio and efficiency for these two types of grids is less than 0.5%.Therefore, 34.79 million grids are sufficient to get a grid-independent solution.The y+is less than 5 for the rotor blade,and less than 10 for the stator blade.The mass flow rate of the simulation is set to be around 7.26 kg/s,because the purpose of this research is to investigate the inception of AR.For the inlet boundary condition, the radial distribution of the total pressure,total temperature and velocity direction are prescribed based on the result of a steady single passage simulation of the whole four stage compressor.In order to obtain the accurate mass flow rate, several steady simulations under different back pressures are conducted until the mass flow rate approaches 7.26 kg/s.Finally, an average value of static pressure, which is 112000 Pa, is given as the outlet boundary condition.The transient rotor–stator is selected at the interface between rotor and stator.In order to assure both accuracy in the frequency domain during the post-processing and convergence of the unsteady simulation, a high-resolution scheme is selected, and 928 physical time steps with 40 pseudo timesteps are set for one rotational revolution.The simulation is conducted using ANSYS CFX on a high-performance computer with 640 cores, and a total of 12 rotor revolutions are computed.
2.3.Analysis of simulation results
2.3.1.Distribution of numerical monitor points
The first type of monitor points are placed around the full annulus near 99.4% span which is approximately the radial position of Rotor 3 blade tip.Eleven points from leading edge to trailing edge in the chordwise direction, and eight points from suction side to pressure side in the circumferential direction are uniformly distributed on the layout.The entire blade row of R3 consists of 29 passages,and there are 2552 monitor points in total.Fig.5 shows the top layout of monitor points inside only one passage for clarity, and the monitor points inside the other passages are not shown herein.
The second type of layout of monitor points, which is shown in Fig.6,are used for the analysis in one single passage rather than the whole annulus.The monitor points density is therefore much finer than the first type of layout.It contains 40, 50, 20 points along the circumferential, streamwise and spanwise directions, respectively.Along the spanwise direction, the monitor points cover the region from 96.5% to 99.5% span, containing the blade tip region.
2.3.2.Analysis in frequency domain
Based on Liu’s assumption,25due to the circumferential propagation of the pressure wave, the combination frequency follows Eq.(1):
where fcis the combination frequency detected in the stationary system;fsis the frequency of the sound source(Key Parameter 1);m is the circumferential mode;Ω is the angular velocity of the rotor,which is 285 Hz×2π in this case;Ks(Key Parameter 2) is the nondimensional coefficient of circumferential propagation speed relative to the shroud.According to the experimental results of Hellmich and Seume,22m is 3,and fcis about 5.22RF.Meanwhile, it is summarized by Liu et al.,25Kameier and Neise,16Camp,17and Pardowitz et al.26that Ksis generally around 0.5.If Ksis simply assumed to be 0.5,the unknown frequency of the sound source fsis computed to be around 3.72RF.
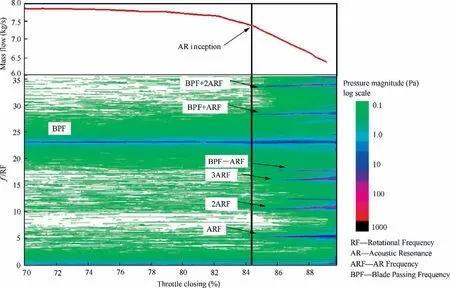
Fig.3 Evolution of wall static pressure during a continuous throttling process (redrawn from Ref.22).

Fig.4 Selected specific stage for 3D URANS simulation.
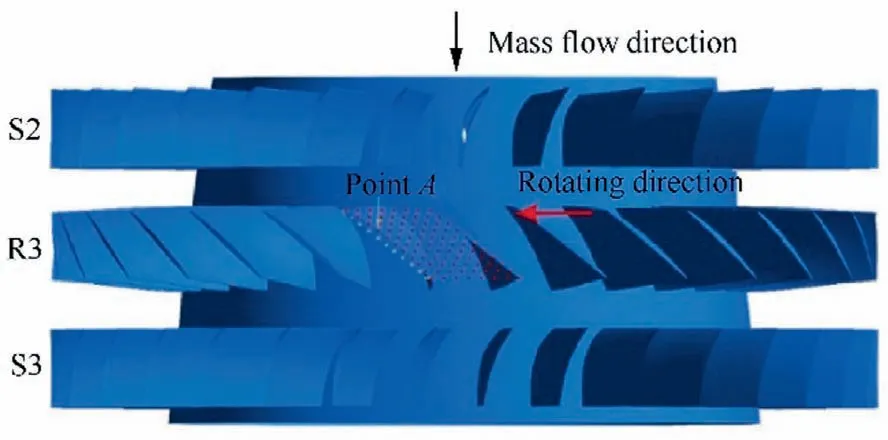
Fig.5 Top layout of the first type of monitor points around full annulus of blade tip at 99.4%span (monitors in only one passage are shown for clarity).
In fact, the relative propagation speed Ksis not necessarily a fixed constant,and then 3.72RF is not the final definite value of fs.Therefore, in the following research, both fsand Ksneed to be quantitatively determined by numerical simulation.If the resultant combination frequency obtained by Eq.(1) still agrees well with the measured combination frequency 5.22RF, the validation of Eq.(1) is convinced, and the mechanism of AR inception is finally verified.

Fig.6 Second type of layout of monitor points in 3D URANS simulation.
In summary, the target frequency needs to fit two criteria:(A) the frequency value is around 3.72RF, but not a multiple of RF; (B) Eq.(1) is approximately satisfied.After observing the FFT result at different monitor points, it is found that most of them have quite similar results.Therefore, only Point A from Fig.5 is selected to illustrate this for clarity.In the stationary coordinate, only RF and its harmonics can be found,as shown in Fig.7(a).Fig.7(b) presents the result in the relative coordinate.It is found that one peak of 3.75RF,which fits the proposed Criteria A, is possibly related to sound source frequency.
The method of high-order frequency analysis is widely used in determining the non-linear frequency signals in the frequency domain.In bi-spectrum analysis, the magnitude implies the intensity of a linearly independent frequency.27Yang et al.28successfully applied this analysis method to distinguish the relationship between the BPF and the target hump signal in a single stage pump-turbine.This method is also adopted in the present research to eliminate the possibility that the signal of 3.75RF is the modulation of other frequencies,i.e.,to verify that this signal is linearly independent.As shown in Fig.8, there is a visible hump at the frequency of 3.75RF,indicating that this frequency is relatively irrelevant to those lower frequencies.Therefore, the frequency of 3.75RF can be regarded as a component linearly independent from other frequencies.
A Butterworth band-pass filter is applied on all monitor points to further investigate the frequency of 3.75RF.As shown in Fig.9, only the frequency signals between 3RF to 4RF are reserved.The pressure contours before and after band-pass filtering are compared in Fig.10.At around 30%chordwise position, a pattern with 3 lobes, which agrees with the findings of the experimental work and the theoretical model,25can be visibly found.Since the following spatial mode analysis in Fig.10 indicates that Mode 3 does not present an extremely dominating peak, the 3 lobes are therefore not uniformly distributed in Fig.9.Additionally, it is noted from Fig.7(b) and Fig.9 that 3.75RF is dominant in the interval of 3RF to 4RF,which means that Fig.10(b)mainly illustrates the pressure contour of 3.75RF at blade tip.
2.3.3.Analysis of circumferential mode decomposition
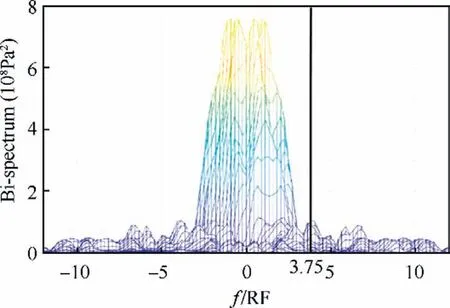
Fig.8 Bi-spectrum analysis of unsteady pressure at Point A in relative coordinate.
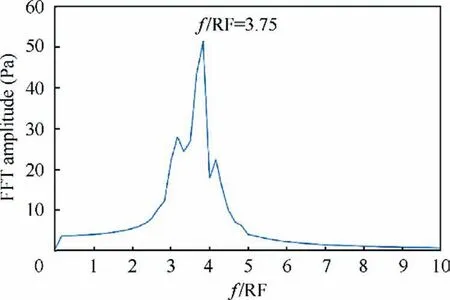
Fig.9 Frequency spectrum of Point A in relative coordinate after band-pass filtering.
In order to further illustrate the circumferential distribution of our target phenomenon, a circumferential mode decomposition method is used to extract the pressure wave lobe structure along the circumferential direction of the compressor at a certain span and chordwise position.Wang et al.10used this method to study the propagation characteristics of the tip leakage flow around the anulus of a compressor.In order to implement this method, the circumferential distribution of pressure at a certain chordwise position is arranged as Eq.(2):

Fig.7 Frequency spectrum of Point A in (a) stationary coordinate and (b) relative coordinate.
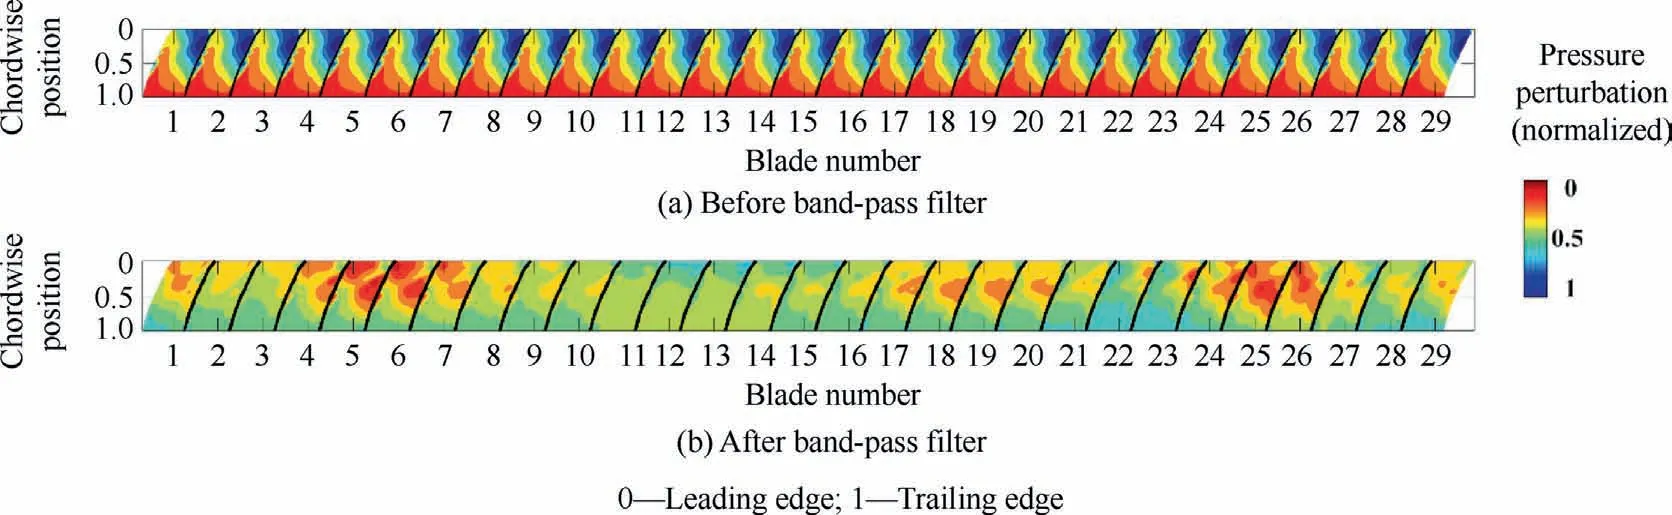
Fig.10 Pressure contours at blade tip area before and after band-pass filtering.
where P,θ,t,m,n represent the pressure perturbation,angular position, time, total number of angular positions, and time moments, respectively.
Next, Fourier transformation is first applied on the time series dimension and then on the dimension of angular position, as shown in Eqs.(3) and (4), respectively:
where Acis the amplitude of circumferential mode, and ω is the angular frequency.Applying the above two steps,not only the amplitude of different circumferential modes but also the phase and frequency is derived.In this research, the Fourier transformation is directly applied on the matrix P along the dimension of angular position at a certain moment, as shown in Eq.(5):
At six chordwise positions of the blade tip,8 monitor points in each blade passage are uniformly and circumferentially distributed around the shroud annulus.It is illustrated from Figs.11(a)to(f)that there are two dominating modes ranging from 10% to 100% chordwise position, which are low order modes around Mode 3 and higher order modes around Mode 29.As shown in Fig.11(c),Mode 3,which means 3 lobes of the pressure wave along the circumferential direction at the 30%chordwise position around the blade tip region, is one dominating mode followed by Mode 29.While Mode 29 is obviously generated by the rotation of Rotor 3 with 29 Blades,Mode 3 can be caused by the interaction of Rotor 3 and Stator 2 with 32 blades.The amplitude of Mode 3 firstly increases from the leading edge to 30% chordwise position, and then decreases towards the trailing edge which is at 100%chordwise position.It is noted that both Mode 3 and Mode 29 are the circumferential modes of pressure after a band-pass filtering of 3RF to 4RF, and 3.75RF is found to be the dominant frequency in Fig.9.Since the pressure disturbance is still very weak during the AR inception period,Mode 3 of the frequency of 3.75RF is thus not expected to be the only dominant mode compared to other modes on the frequency spectrum.It is therefore concluded that the simulation in the present study captures the main frequency characteristics which are experimentally detected during the inception stage of AR.
2.3.4.Analysis of time domain
A clear visual of small vortices is difficult to be identified in the 3D URANS simulation,and the axial reverse flow contours is shown in Fig.12, so that the evolution of vortices can be approximately illustrated.Passage No.5(P5)with a red arrow at different time moments is the focus.From Moment t1, a leakage vortex starts to leak from the suction side.From t=t2to t=t4,this leakage flow becomes larger along the suction side,and the size of this vortex gradually grows and moves downstream.At t = t5, when another jet from the leading edge, which could be caused by rotor–stator interaction,approaches the leakage flow, a part of the leakage flow detaches from the suction side and moves downstream.The remaining part of the leakage flow continuously moves along the suction side until they are also detached at t = t7, gathers with the previously detached vortices, and finally moves towards the trailing edge of the neighboring blade.
2.3.5.Analysis of dynamic mode decomposition
Although the evolution of the leakage flow from the suction side is described above, the connection between this leakage flow and the target sound source frequency remains unclear so far.The Dynamic Mode Decomposition (DMD) method is thus applied to observe the flow structure of 3.75RF in the flow field.As one kind of modal decomposition methods,DMD is widely used to process high-dimensional and massive data.Because the method is based on frequency analysis, i.e.,each DMD mode has a fixed oscillation frequency and growth(or decay) rate, this method can isolate the flow structure of a specific frequency from the entire flow field.It is summarized that this method is quite effective in processing the simulation result as well as demonstrating the flow structure of a specific frequency, i.e., 3.75RF in the present case.The major process of DMD is introduced herein,and more details can be found in the work of Schmid.29
First, the flow data changing with N time moments is basically viewed as a linear system as shown in Eq.(6).For this research, p is an ordered column of pressure perturbation extracted from the monitor points on the second type of layout, as shown in Fig.6.
where matrix A is the system matrix, and its eigenvalues and eigenvectors directly determine the DMD modes.However,A is not easy to be solved explicitly.Another approximate Matrix S is therefore used to replace A like Eq.(7), where k is the remaining parts with eN-1as the (N - 1)th unit vector.Then,S can be derived by Eq.(8),and its eigenvalues represent the main eigenvalues of Matrix A.
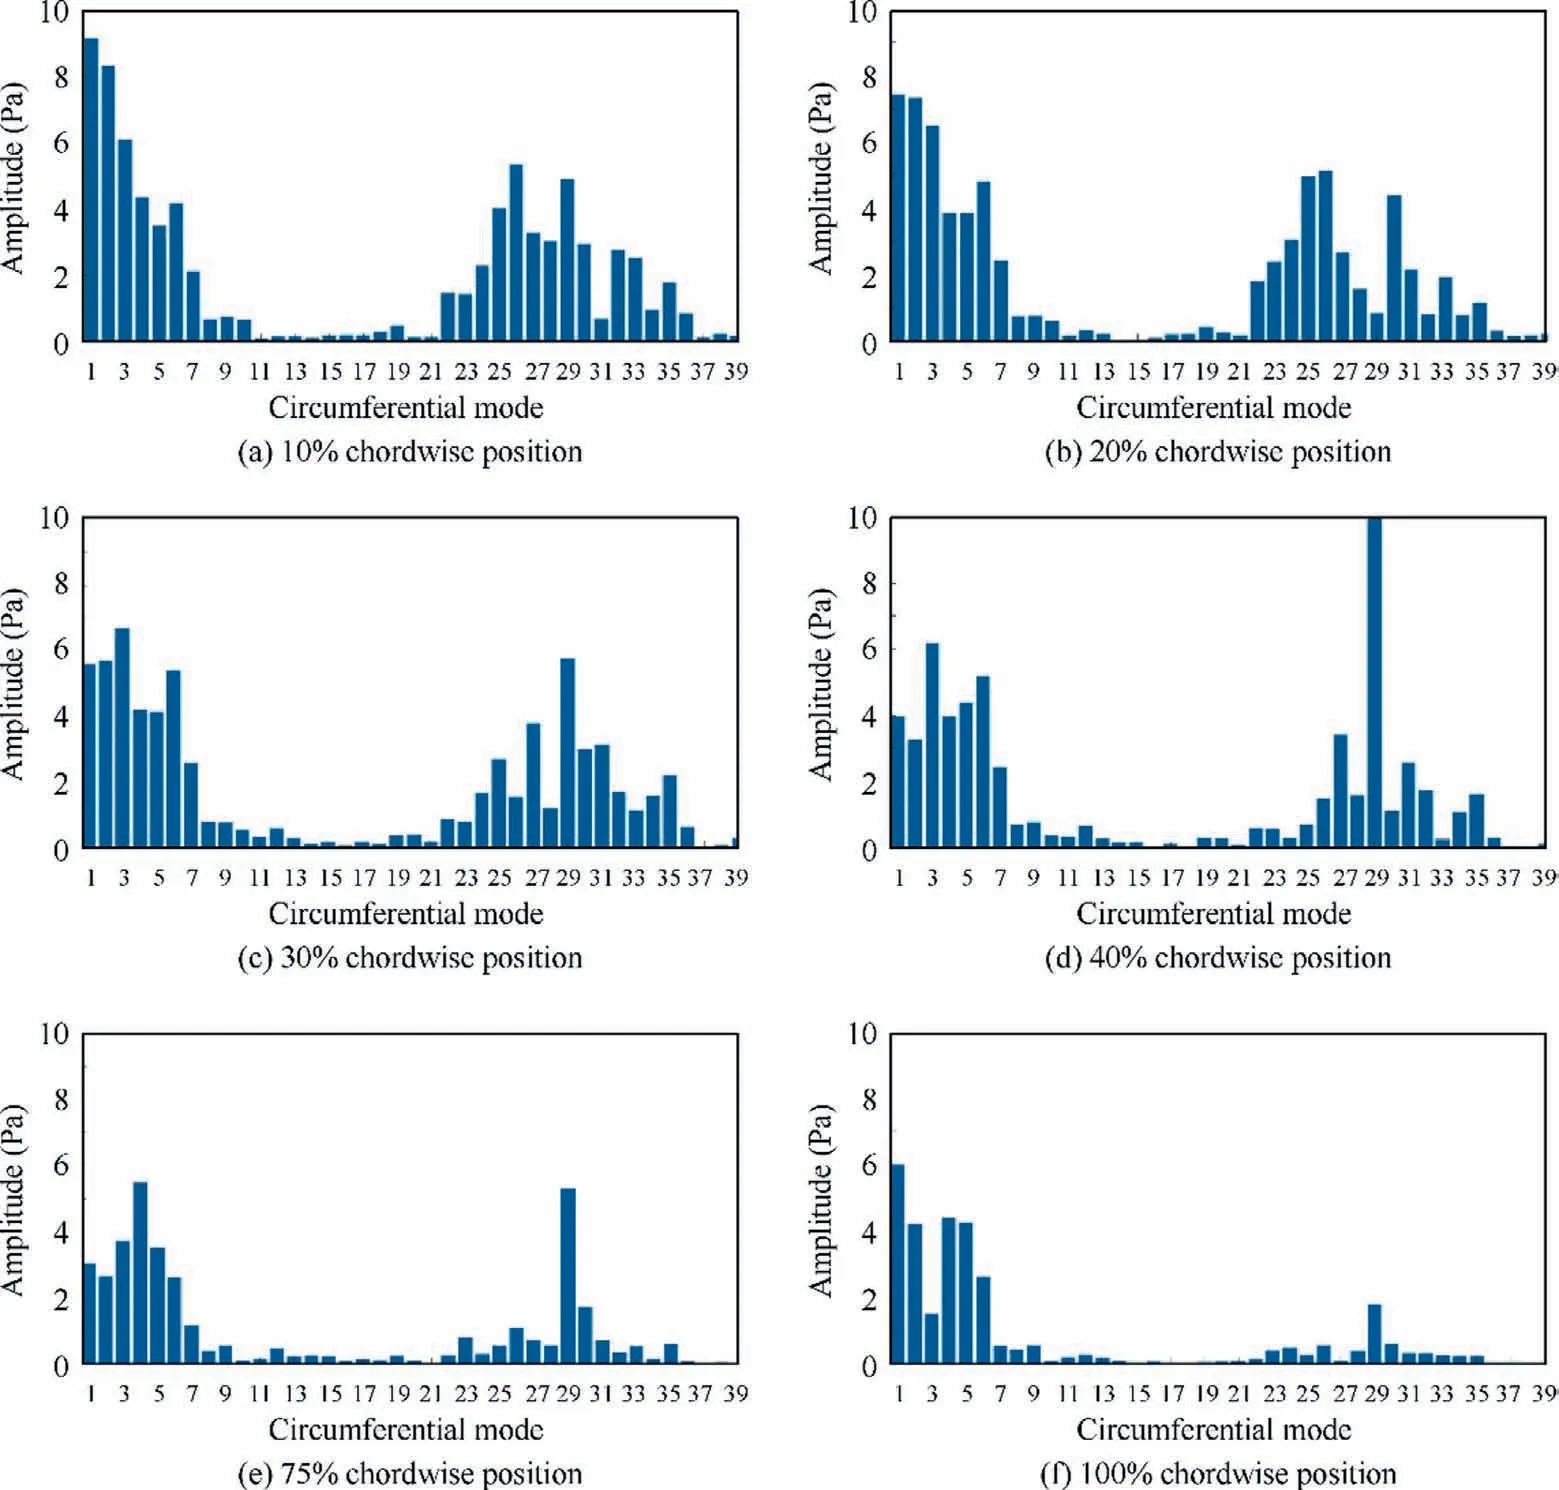
Fig.11 Circumferential mode decomposition of pressure at blade tip after band-pass filtering at six chordwise positions.
where U ∊Cm×ris the left singular matrix,V ∊Cn×ris the right singular matrix, Σ ∊Cr×ris the diagonal matrix, and r is the rank of, i.e., singular value (the number of diagonal elements in Σ).In this paper, the exact DMD method is used in Eq.(8) to obtain the dynamic mode, and the mode is represented as Eq.(9):
where μ is the norm of eigenvector,and yjis the eigenvector of matrix S.For each mode, its frequency is unique and can be represented as Eq.(10):
Generally, there is no universal definition of the amplitude of each mode.Referring to Schmid,29it is better to describe the amplitude of each mode by the second order norm of every value in each mode at different moments,as shown in Eq.(11):
Then, the coefficient cjof each mode at the initial moment should be defined by Eq.(12), and the values of following moments can be defined with the eigenvalues of each mode as shown in the Eq.(13):
Therefore, the pressure matrix P at different moments can be expressed by the base mode, the coefficient, and the eigenvalue in the form of Vandermonde matrix, as shown in Eq.(14):

Fig.12 Evolution of reversed flow at blade tip.
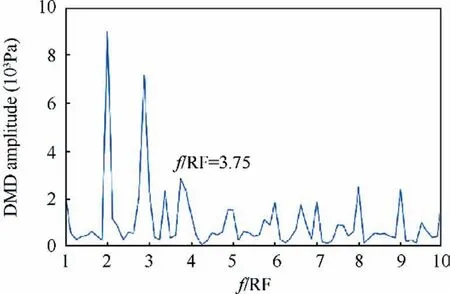
Fig.13 Amplitude of DMD mode.
Using the above method, the flow field of the specific passage in the relative coordinate is decomposed, and the amplitude of each DMD mode is shown in Fig.13.It is found that the sharp peak of 3.75RF is still visible,which agrees with the result in Fig.7(b).
The dynamic mode of 3.75RF, as well as the streamline from 15% to 40% chordwise position from the suction side of the blade tip region,are shown in Fig.14.It is observed that the major flow structure of 3.75RF appears near the suction side of the blade,and its pattern matches that in the streamline direction.In addition,the trace of the streamline is towards the trailing edge of the pressure side of the adjacent blade,it is thus evident that the leakage flow will impinge or influence the trailing edge of the adjacent pressure side.The red area in Fig.14 is where the most obvious perturbation occurs, which is also insistent with the core region where shedding vortices are about to shed.Those streamlines, which go through the core red area, originate from the 30% chordwise position of the suction side.This location is close to the chordwise position where circumferential Mode 3 is visible, as shown in Fig.10.
As mentioned above, shedding vortices can be approximately expressed by the axial reverse flow contour,so the same streamline cluster is plotted together with the reversed flow contour in Fig.15.It is found that these same streamlines also match the movement direction of shedding vortices.So far, it can be inferred that the flow structure of 3.75RF is the main leakage flow from the suction side.
The analysis of 3D URANS simulation results are summarized: (A) The numerical simulation successfully captures the main flow field at the onset point of AR;(B)A sharp peak frequency at 3.75RF in the relative coordinate is found as the sound source frequency,and the fact that this frequency could only be observed in the relative coordinate also indicates that this sound source is caused by shedding vortices, because vortex shedding is indeed an obvious phenomenon in the frame fixed to the rotating blade; (C) DMD analysis shows that the flow structure of 3.75RF fits the pattern of leakage flow from the 30% chordwise of suction side; (D) The vortices from the leakage flow, which are the main flow structure of 3.75RF,impinge on the pressure side of the adjacent blade near the trailing edge.
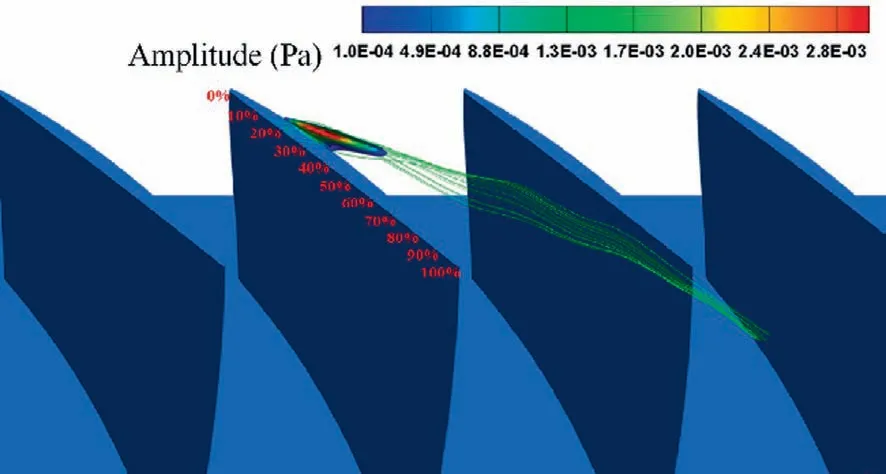
Fig.14 Flow structure of DMD mode 3.75RF and streamlines from 15% to 40% chordwise position.

Fig.15 Axial reverse flow contours and streamlines from 15%to 40% chordwise position at suction side.
So far, the second key parameter, Ks, which is the coefficient of circumferential propagation velocity relative to shroud in Eq.(1), remains unknown.However, due to a variety of unsteady vortices of different time and length scales involved in the 3D simulation results,it is not straightforward to clearly obtain the shape and core position of the unsteady leakage vortices.Therefore, a simulation of a simplified tip leakage flow model is performed in the next section to focus on the jet flow at the tip clearance.This simplified simulation model is applied to further investigate the unsteady characteristics of unsteady tip vortex shedding.
3.Numerical simulation of a simplified tip leakage flow model
Since the specific core position of those small shedding vortices in the URANS simulation is hard to be identified,it is easier to determine it in a simplified duct,so that the propagation speed of all shedding vortices can be derived.Several simplified jet flow models have been used to depict the flow field accurately and to obtain more data of tip leakage flow.Khalid et al.30evaluated the endwall blockage in the compressor using a simplified conceptual framework, in which it is supposed that tip leakage jet flow in different sections is independent from each other.Chen et al.31proposed a similarity analysis method,and found that tip leakage flow is essentially a jet flow driven by the pressure difference between the two sides of the blade.It is proved that the formation of tip leakage vortices can be regarded as the evolution of the two dimensional (2D)unsteady flow in the cross-section plane,i.e.,the unsteady simulation of the jet flow in a 2D plane can still capture the main characteristics of tip shedding vortices.Gao and Liu32conducted a 3D numerical simulation by a simplified flow model for the turbomachinery,and their results agree well with experimental results.It is found that a successful simplified physical model including the main physics of the concerned flow problem can successfully capture the key flow structure of 3D flow field.While Gao and Liu32focused on the time-averaged flow structure, this paper is devoted to the unsteady characteristics of tip leakage flow, such as the circumferential propagation speed and the frequency.Importantly, if such a simplified numerical model considering only the main pressure-driven jet flow of tip leakage flow can obtain the expected unsteady flow characteristics, it could be naturally concluded that the unsteady tip leakage vortex indeed plays a role of sound source in the AR inception of the multistage compressor.
3.1.A simplified tip leakage flow model
As shown in Fig.16,a simplified tip leakage flow model using a square duct with a longitudinal slit is adopted, and the dimensions of this model are derived from R3 in the fourstage axial compressor.The coordinate system is shown in Fig.17, and x axis is along the reversed spanwise direction,y axis is perpendicular to the chordwise direction, and the streamwise direction is represented by z axis.The two side walls represent the suction side of a blade and pressure side of the adjacent blade.The slit resembles the tip clearance,and the sizes of the slit, c and τ, are the length of the blade chord and the tip clearance, respectively.The height of this square duct,Lx,is equal to the length between hub and casing.The width of this square duct,Ly,is equal to the projection of pitchwise width in the y direction.The total length of the flow passage, Lz, is 2.5 times the length of blade chord.The extended duct between blade trailing edge and outflow boundary is used for a better numerical convergence and avoiding the influence of the possible outlet reversed flow on the shedding vortices around tip gap.More detailed geometries of the model are shown in Table 2.
In order to save computational cost, the total physical domain is divided into nine parts.The tip region near the top wall,which is the most concerned region,occupies massive elements, while in other areas the element size is gradually stretched, which is shown in Fig.18.This model consists of about 5.76 million elements, and y+near the tip clearance region is smaller than 1.The simulation is conducted on ANSYS Fluent with spatial discretization of bounded central differencing method and second order pressure-based implicit transient solver, and the turbulence is modeled by LES with a subgrid scale mode of Wall-Adapting Local Eddy viscosity model (WALE).The physical time step of 6.5 × 10⁻⁷s is adopted with 35 pseudo timesteps for each physical timestep,and the CFL number is around 5,which is an acceptable value for an implicit solver.
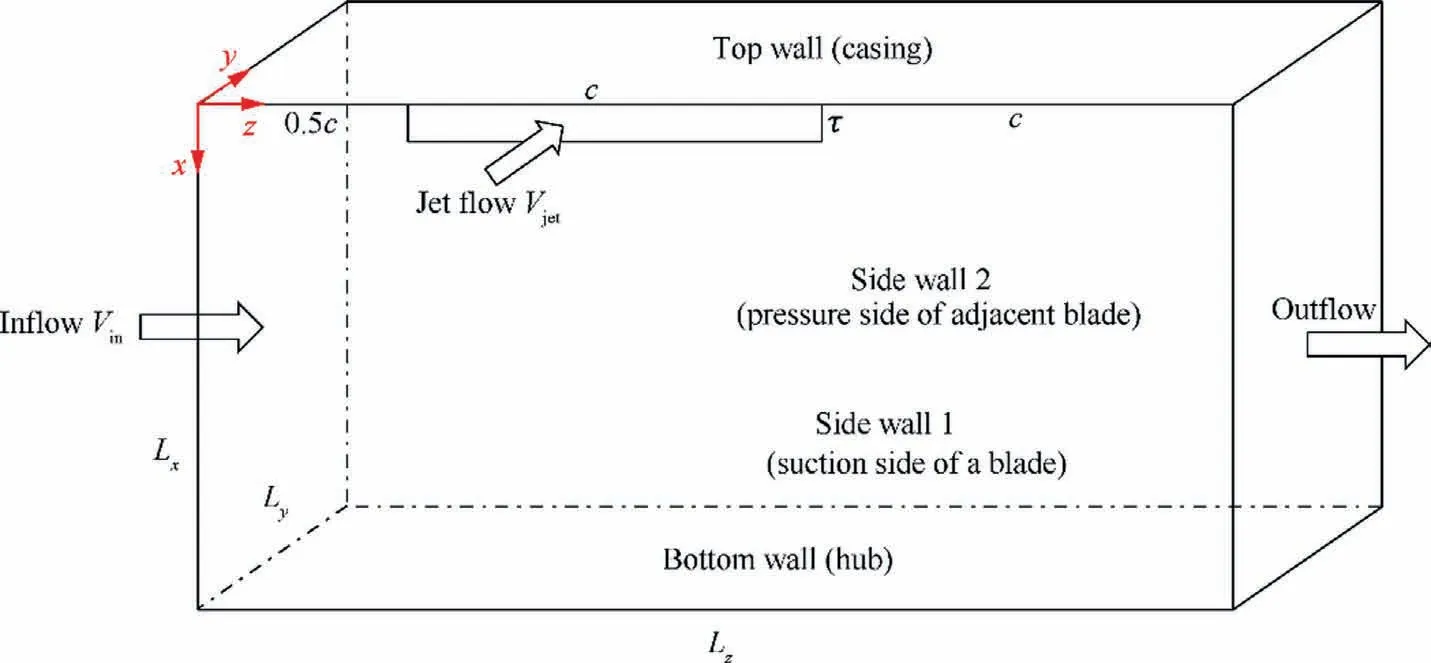
Fig.16 Simplified tip leakage flow model (redrawn from Ref.32).

Fig.17 Illustration of structure in simplified model.
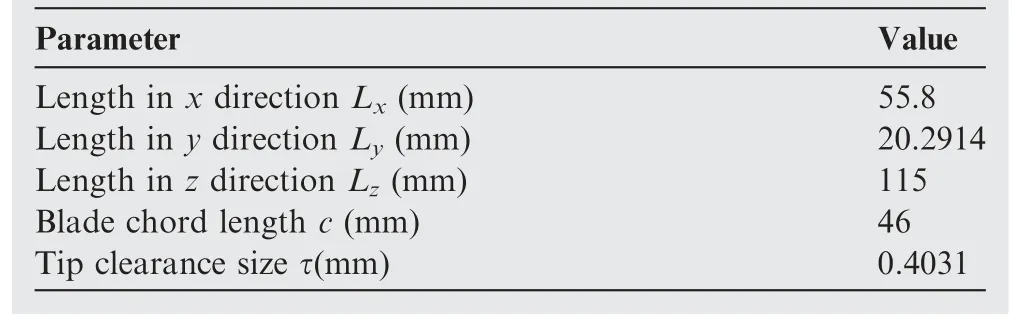
Table 2 Detailed geometries of model.

Fig.18 Grid distribution in simplified tip leakage flow model.

Fig.19 Monitor points indicated by yellow at 30% chordwise position at blade tip.

Fig.20 Velocity distribution of jet flow at slit inlet.
The velocity inlet boundary condition is adopted at the inflow and jet flow boundary, and the data are extracted from the URANS simulation.The main inflow velocity along the streamwise direction is 143.3 m/s.For the velocity of jet flow,a velocity distribution is used.From Figs.14 and 15,it is evident that this target frequency of 3.75RF is related to the leakage flow from 15%to 40%chordwise position of the suction side.Since the red core of the DMD mode of 3.75RF in Fig.14 is at around 30% chordwise position, the relative flow velocity at the tip clearance of this chordwise position is extracted from the previous URANS simulation results, so as to prescribe the jet flow inlet boundary condition of the simplified tip leakage flow model.In order to obtain the tip clearance velocity as precisely as possible, 80 points in the radial direction are uniformly distributed at 30%chordwise position of tip clearance,as shown in Fig.19.The distribution of the inlet relative velocity is obtained by an interpolation of the URANS results on these discrete points, as shown in Fig.20.The velocity at the tip region is along the circumferential direction,not perpendicular to the chord direction, as shown in Fig.17.At two inlet boundaries, the spectral synthesizer is used for fluctuating velocity algorithm.The turbulent intensity is set to 2.8%,and the length scales are based on Lyand τ.The pressure outlet boundary condition is given for the exit.so that shedding vortices can freely leave the domain.The two side walls and the top wall are prescribed as non-slip boundary, and the bottom wall is set to slip boundary.

Fig.21 Streamwise vorticity contours on iso-surface of Q=1×10⁸ s-2.
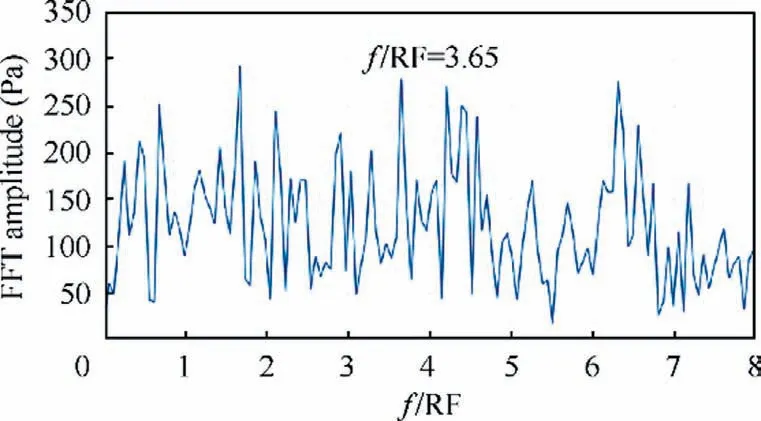
Fig.22 Frequency spectrum at Point A.
3.2.Analysis of results
Q criterion, which follows Eq.(15), is widely used to express the intensity of the rate of rotation in the flow dynamic field.33In order to better observe the morphology of the jet flow, a bottom view is shown in Fig.21 for a streamwise vorticity contour on the iso-surface of Q=1×10⁸s-2.It is displayed that an induced flow with much higher vorticity surrounds the main jet flow with negative vorticity.After developing for some time, both the main jet flow and the induced flow break down and become to be dissipated, which shows a good agreement with previous studies.32,34
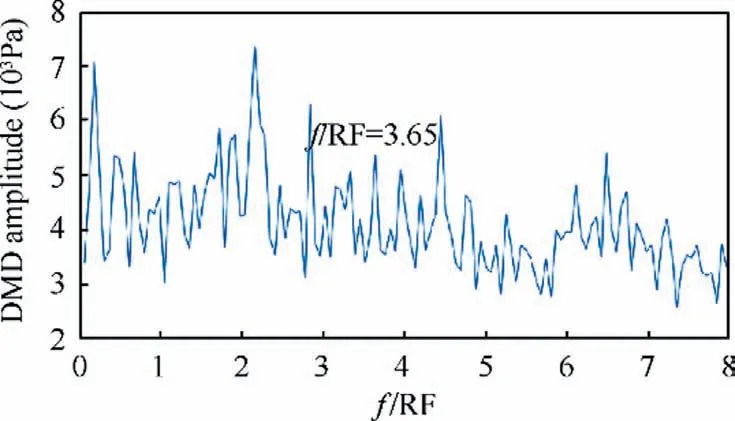
Fig.23 Frequency spectrum of dynamic modes.
To find the sharp peak frequency, several chordwise sections are located along the duct.Only the results at the 30%chordwise position are displayed for clarify.As shown in Fig.17,Point A is placed in the flow field where the vortex just starts to shed from the shear layer at the blade tip.Fig.22 represents the frequency spectrum at Point A.It is found that at the present specific operation condition which is far away from the stall boundary, the frequency spectrum of tip leakage flow approximately shows a kind of broadband distribution due to the existence of many frequency peaks, for instance, the frequency peak in the interval of 1RF-2RF, and the relative strength of adjacent frequency peaks of FFT slightly depends on the specific location of Point A.It is of great interest that 3.65RF is always relatively dominating in the low-frequency region, i.e., the flow structure of the frequency of 3.65RF is a major characteristic at this chordwise position.
Fig.23 shows the amplitude of each dynamic mode from the result at 30% chordwise position.Several frequency peaks are also found to exist in the spectrum, and it is inferred that the tip leakage flow at this specified operating point consists of a variety of frequency components.Regarding the focus of the present work, a sharp peak, which is visible at the frequency of 3.65RF, indicates that this frequency is one of the major characteristics in the flow field.It is noted that the current work focuses on the inception period of AR,i.e.,the linear small perturbation period.Therefore, the most concerned 3.65RF is not necessarily the most dominating frequency component.Fig.24 is a comparison of the DMD mode of 3.65RF and the origin flow field,and it is observed that the vortices in the red rectangular frame are in good agreement with that in the origin flow field.
To further identify the frequency component of 3.65RF around the tip region, as well as the connection with the DMD results, FFT analysis is applied for all the monitor points in the tip region of 30% chordwise position, so that the contour plot of the FFT amplitude of the frequency component of 3.65RF is shown in Fig.25.It is found in the red rectangular region that both the FFT contours and the DMD contour of 3.65RF have a very similar structure of shedding vortices from the tip gap.There seems to be some discrepancies between the FFT contours and the DMD contours,since the DMD contours shows a red-blue-red-blue distribution and the FFT contours just shows a red vortex-like shape.This is because the FFT contours shows only the amplitude of the specific frequency, while the DMD contours represents both the amplitude and phase of one mode.On the other hand,the FFT contours is a collection of the FFT amplitudes at a specified frequency of many single points,and the FFT analysis of each point is independent, but the DMD contours is the analysis of the result of the selected flow region.This difference could also lead to some discrepancies.
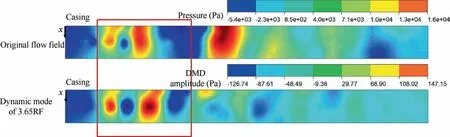
Fig.24 Comparison between original flow field and dynamic mode of 3.65RF.
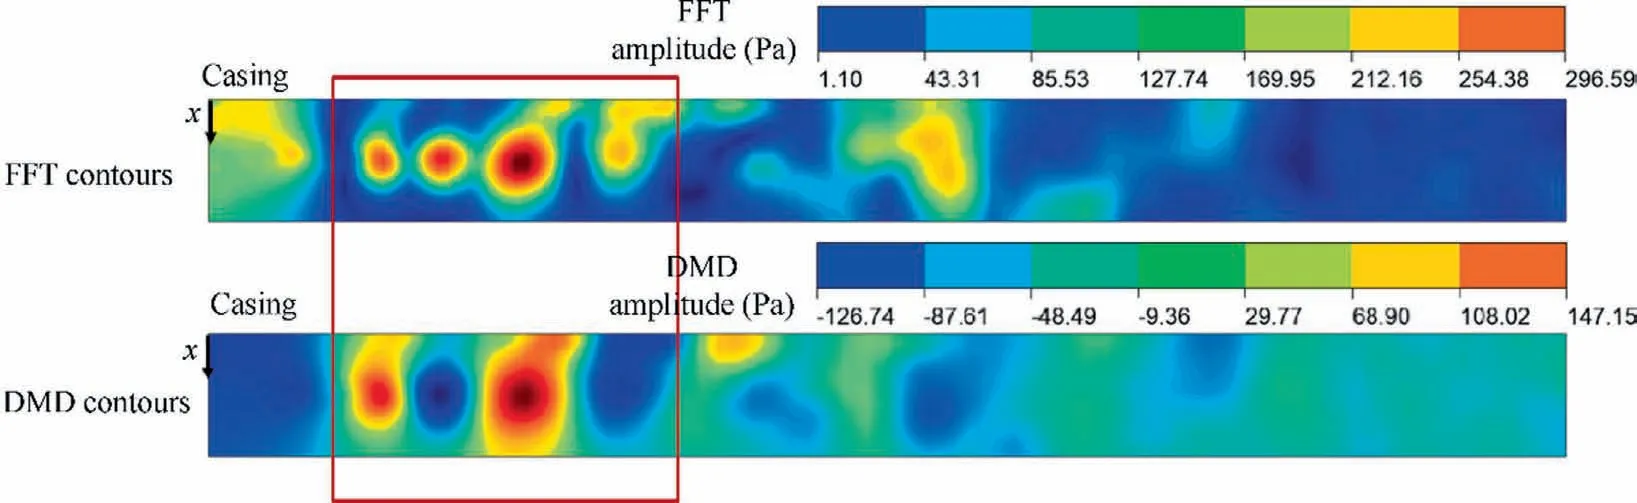
Fig.25 Comparison of FFT contours and DMD contours of 3.65RF.
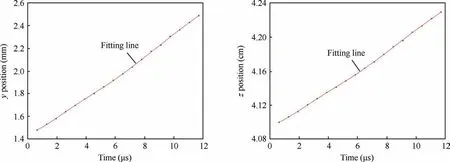
Fig.26 Migration of shedding vortex.
In this case, the migration velocity of these shedding vortices can be viewed as the circumferential propagation speed in the relative coordinate of the 3D domain.From the conclusion of the previous section,it is found that the vortices inside the red rectangular frame in Fig.24 fit the target frequency.It is found that the shape and position of the vortices are quite clear.Thus, the relationship of time and position in the y and z directions of a certain vortex is shown in Fig.26.Several different methods are selected to calculate the convection velocity of the target vortex, and the obtained magnitude of convection velocity is almost unchanged as the slope in Fig.26.After calculating the velocity in the y direction and z direction, the total migration velocity of the shedding vortex can be obtained.Finally, the average migration velocity is derived as 147.39 m/s.
In this section, a simulation of the simplified tip leakage flow model is performed, and the shedding vortices in the tip clearance of the compressor are straightforwardly captured.All the geometry and boundary conditions are obtained from the results of the URANS simulation.A relatively dominant peak frequency, which is identical to the target frequency in the URANS result, is found near the tip clearance region.Further comparison among the original flow field, the original FFT component of 3.65RF and the DMD mode structure confirms that 3.65RF is the natural frequency of shedding vortices.Meanwhile, the circumferential propagation speed of shedding vortices is 147.39 m/s in the relative frame.A more comprehensive analysis and comparison of both simplified tip leakage flow simulation and URANS simulation results are conducted in the following section.
4.Comprehensive analysis of simplified tip leakage flow model and URANS results
This section focuses on the discussion of two findings by comprehensively analyzing the results of the simplified tip leakage flow model and 3D URANS simulation.The first one is the relationship between the target frequency of 3.65RF and the final AR frequency of 5.22RF, while the other one is the flow structure of the target frequency.
4.1.Target frequency and AR frequency
As introduced in Section 2.3, the frequency of the sound source itself is different from the frequency detected in the stationary coordinate due to the circumferential propagation of the sound source,like the phenomenon of the Doppler effect.35According to Liu et al.’s assumption,25the relation of these two frequencies follows Eq.(1).The propagation speed of the shedding vortices in the simplified tip leakage model is about 147.39 m/s,which is obtained in the relative frame.This value can be transferred into the propagation speed in the stationary system by Eq.(16):
where Ksis the nondimensional propagation speed coefficient of the target phenomenon relative to the rotor speed,as shown in Eq.(17):
It is found that this value is close to the assumed propagation speed of 0.5 times rotor tip speed in the theoretical model of Liu et al.25While the circumferential mode m is 3 and fsis 3.65RF, the final combination frequency fccalculated by Eq.(1) is equal to 5.19RF.The relative error between this combination frequency and the experimentally measured frequency of 5.22RF is only 0.5%, showing a quite acceptable accuracy.Therefore,the 3.65RF can be viewed as the frequency of sound source of AR.The small relative error may be caused by the simplification in the tip leakage flow model, such as the neglected nonuniform inlet flow and the neglected mean pressure difference between two side.
4.2.Flow structure of target frequency
Since the sharp peaks around 3.7 RF are discovered as the sound source frequency of AR, the confirmation of the flow structure is essential to the deep understanding of the mechanism of AR at the onset point.Furthermore,from DMD analysis of the simplified tip leakage flow simulation, it is found that the flow structure of 3.65RF in the simplified model resembles the shedding vortices from the edge of the clearance gap,as shown in Fig.24.Additionally,the core position of the DMD mode of 3.75RF in the 3D URANS simulation lies along the streamline direction.As shown in Fig.27, in the URANS results, the length between the core position of DMD mode of 3.75RF and the suction side of the blade is 0.00918 m, and the distance between the middle point of the red frame and the tip gap in the simplified model is 0.0038 m.These two values of 0.00918 m and 0.0038 m are very close.Meanwhile, Fig.28 shows that the core of the 3D DMD mode of 3.75RF is just below the blade tip in the spanwise direction,which also agrees well with the position in the x direction of the shedding vortices in the simplified model results.These pieces of evidence further confirm that the simplified tip leakage flow simulation accurately captures the main physics of the target frequency in the real 3D configuration.
From the above analyses and comparisons, it can be seen clearly that the major flow structure of around 3.7RF is the shedding vortices in the tip leakage flow at around 30%chordwise position from the suction side,and the sound source position just lies around the high-intensity area of the DMD mode of the target frequency, as indicated by red color on the mode contour.
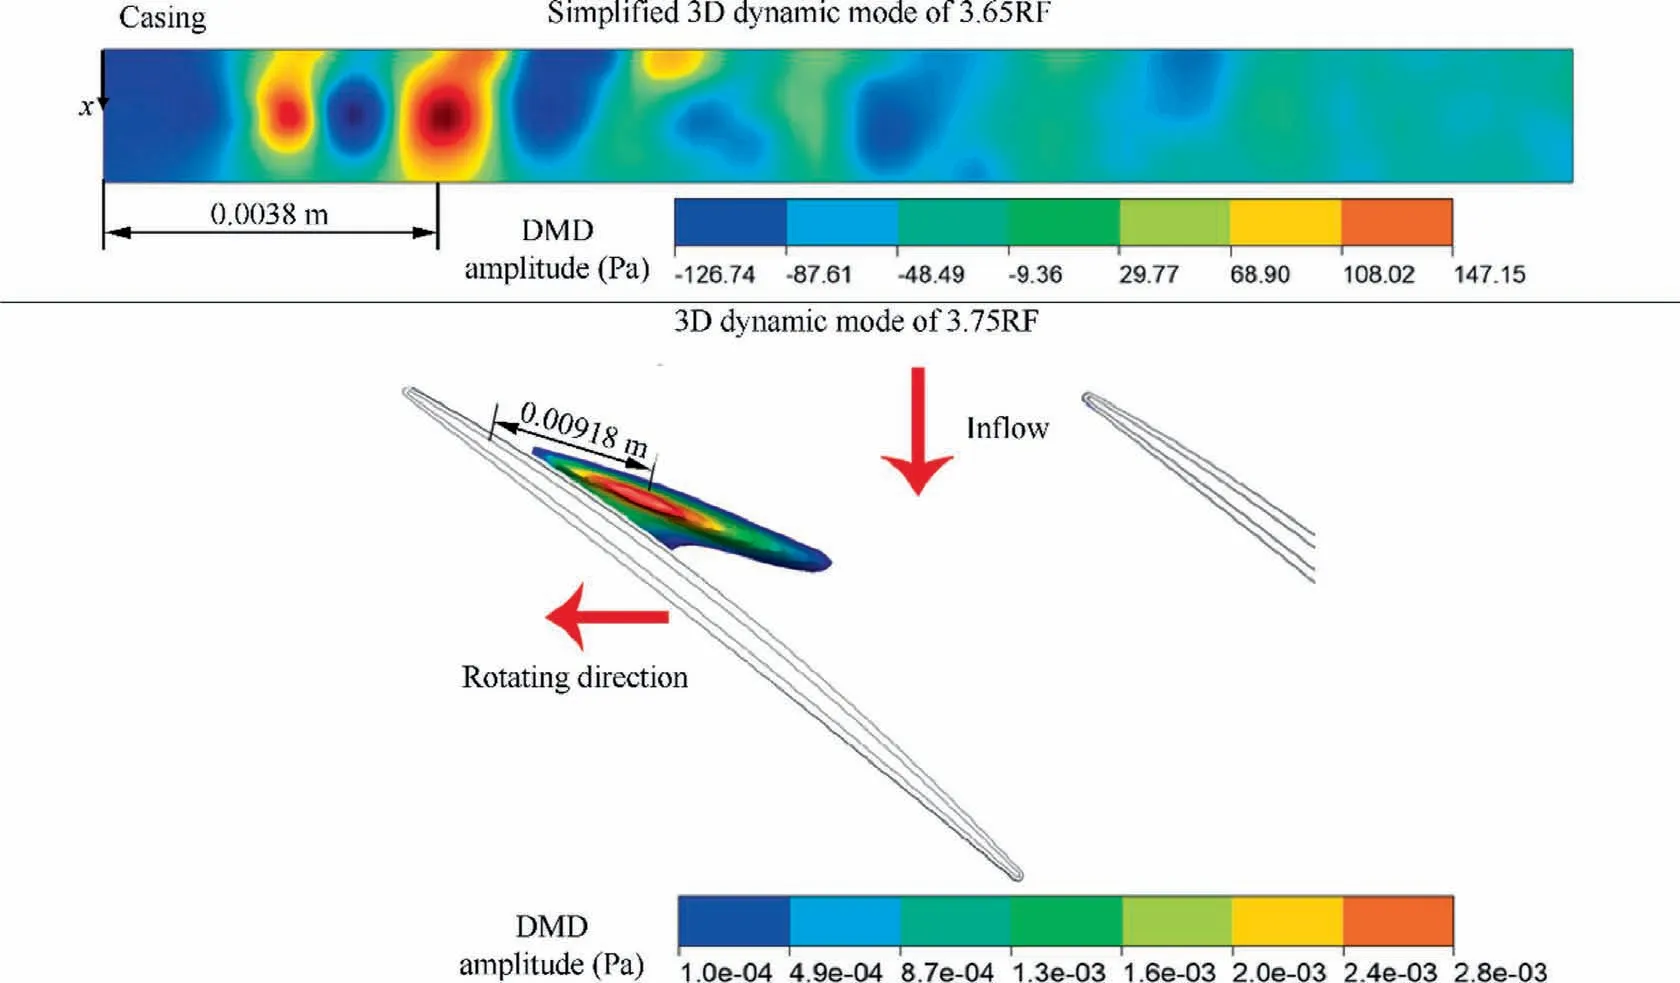
Fig.27 Comparison of streamwise position of DMD mode of 3.75RF in URANS results and 3.65RF in simplified model results.
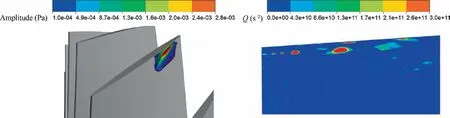
Fig.28 Comparison of spanwise position of DMD mode of 3.75RF in 3D URANS and 3.65RF in simplified model results.
5.Conclusions
To further study the physical mechanism of AR onset in a four-stage compressor, a comprehensive analysis of both 3D URANS and simplified tip leakage flow model simulations using LES is conducted in this investigation.Although the interaction and coupling between the flow field and acoustic field are also of great interest, the focus in this paper is placed on the identification of the specific sound source generated by the unsteady tip leakage flow at the onset point of AR.Additionally,this work also verifies the assumed key formula of the preceding theoretical model.To the authors’ knowledge, it is the first study in open literature on the role of unsteady tip leakage flow in triggering the AR onset of a multistage compressor by numerical simulation.Several conclusions are summarized as follows:
(1) The unsteady tip clearance flow plays a significant role in triggering the inception of AR.In the present case,the shedding vortices in the leakage flow from the 30% chordwise position of the suction side at blade tip area are proved to be the origin, and the shedding vortices move downstream and towards the trailing edge of the adjacent blade.The target phenomenon is quite unclear in the URANS simulation due to the very weak perturbation at the AR onset point.DMD analysis is applied, and performs well in isolating the specific frequency component from the original flow field.The flow structure of the tip leakage flow is thus identified by DMD analysis, which helps to provide an insightful understanding.
(2) Since the tip clearance flow is essentially a pressuredriven jet flow, a simplified tip leakage flow model,which is used to study the unsteady characteristics of tip clearance flow, successfully captures the dominating flow physics at the blade tip.Unsteady vortex shedding,which is related to the intrinsic instability of shear flow,generates the basic frequency of 3.65RF in the fixed frame of the sound source.
(3) By using the Q criterion,it is found that the unsteady tip leakage vortex circumferentially propagates with a speed of 0.515 times the rotor rotational speed in the stationary coordinate.The rotating sound source with the specific frequency of 3.65RF results in a combination frequency of 5.19RF in the fixed frame of shroud,which is close to the experimentally detected frequency of about 5.22RF.The small relative error of only 0.5%again verifies the accuracy of the theoretical model.
(4) It is found in the simplified tip leakage flow model simulation that the convection velocity of the shedding vortices from the clearance fits the expected sound source propagation speed in the circumferential direction.The sound source frequency is also close to one of the dominating frequencies in the URANS simulation, and the resultant combination frequency coincides with the measured AR frequency via experiments.Since such a simplified simulation based on a clearance jet flow model can successfully capture the two key parameters, it is thus concluded that this paper provides unambiguous evidence on the role of unsteady tip leakage vortex as the sound source in AR inception of this multistage compressor.
(5) Using the simplified tip clearance flow model simulation,the sound source frequency due to the tip leakage flow is calculated during the design stage of a new compressor,and a final combination frequency can be derived by the theoretical model.Then, the natural frequency of the compressor blade can be accordingly modified by mistuning,and the possible structural damage by AR could be avoided in advance.
Declaration of Competing Interest
The authors declare that they have no known competing financial interests or personal relationships that could have appeared to influence the work reported in this paper.
Acknowledgements
This study was co-supported by the National Natural Science Foundation of China(Nos.51976116 and 51976125),the Natural Science Fund of Shanghai, China (No.19ZR1425900),and the Open Research Subject of Key Laboratory (Fluid Machinery and Engineering Research Base) of Sichuan Province, China (No.szjj2019-022).Since this paper presents a further investigation of the first author’s previous work during his visiting research in Germany, he would like to thank the great support from Prof.Joerg Seume and Alexander von Humboldt Foundation.
 CHINESE JOURNAL OF AERONAUTICS2023年10期
- CHINESE JOURNAL OF AERONAUTICS的其它文章
- Experimental investigation of typical surface treatment effect on velocity fluctuations in turbulent flow around an airfoil
- Oscillation quenching and physical explanation on freeplay-based aeroelastic airfoil in transonic viscous flow
- Difference analysis in terahertz wave propagation in thermochemical nonequilibrium plasma sheath under different hypersonic vehicle shapes
- Flight control of a flying wing aircraft based on circulation control using synthetic jet actuators
- A parametric design method of nanosatellite close-range formation for on-orbit target inspection
- Bandgap formation and low-frequency structural vibration suppression for stiffened plate-type metastructure with general boundary conditions