
Fast period estimation of X-ray pulsar signals using an improved fast folding algorithm
2023-11-10 02:16MinzhngSONGYidiWANGWeiZHENGLinshengLIYusongWANGXioweiHUYulongWU
CHINESE JOURNAL OF AERONAUTICS 2023年10期
Minzhng SONG, Yidi WANG, Wei ZHENG, Linsheng LI,Yusong WANG, Xiowei HU, Yulong WU
a College of Aerospace Sciences and Engineering, National University of Defense Technology, Changsha 410073, China
b Unit 71770 of PLA, Taian 271000, China
c Beijing Institute of Control Engineering, Beijing 100076, China
KEYWORDS
Abstract An accurate period is important to recover the pulse profile from a recorded photon event series of an X-ray pulsar and to estimate the pulse time of arrival, which is the measurement of X-ray pulsar navigation.Epoch folding is a classical period estimation method in the time domain; however, its computational complexity grows as the number of trail periods increases.In order to reduce the computational complexity, this paper improves the fast folding algorithm through segment correlation and amplitude accumulation,which is based on the post-order traversal of a binary tree.Compared with epoch folding,the improved fast folding algorithm can achieve a similar accuracy at the cost of a lower computational burden.Compared with the original fast folding algorithm,the improved algorithm can be applied to detectors with a much smaller effective area.The performance of the method is investigated by simulation data and observation data from the Neutron star Interior Composition Explorer (NICER).
1.Introduction
A pulsar, a rapid spinning neutron star, radiates particle beams outward from its two magnetic poles.When a beam sweeps over a spacecraft, the spacecraft receives a pulsed signal.1Pulsars can be employed as natural beacons to help a spacecraft determine its position and velocity in space.2Moreover, a high-precision time scale, pulsar timescale, can be constructed by pulsar timing.3
The key techniques of pulsar navigation are spin period estimation and pulse profile recovery.Currently,epoch folding is commonly employed to estimate the spin period of an X-ray pulsar.4Under epoch folding, data is firstly folded modulo a trial period and then binned, and Pearson’s χ2is used to test the recovered profile.5–6Nevertheless, the computational cost of epoch folding grows as the number of trial periods increases.7
For a radio pulsar signal,in order to accelerate epoch folding,the Fast Folding Algorithm(FFA),which works based on the light curve of the radio signal, was originally designed by Stealin.8This algorithm operates in the time domain and is particularly effective at finding long-period radio pulsars.9Lovelace et al.implemented the algorithm on radio data from the Arecibo, leading to the discovery of pulsar PSR B2016+28.10In 2004,this algorithm was successful at finding a pulsar with a period of 7.7 s.11Kondratiev et al.used the FFA to search for pulsed radio emission.12Scholz et al.attempted to find an underlying periodicity on the Arecibo and Green Bank Telescope (GBT) observations using the FFA.13Parent et al.’s work demonstrated that the FFA exceeded the performance of the Fast Fourier Transform(FFT)in the white-noise regime in the case of long-period pulsars.14Morello et al.developed an FFA pipeline to process radio observations.15
Although the FFA has been successfully applied to the radio pulsar astronomy, it cannot be directly applied to an X-ray pulsar, because the X-ray signal of a pulsar can only be recorded as a form of photon instead of a continuous signal.16In a study by Zhang et al., through photon counting,a photon event series was converted to a pulse intensity matrix which could be processed by the FFA.17However,this method is only applicable to cases where a high photon count rate is available.For detection of an X-ray pulsar, a high photon count rate can be achieved by employing an X-ray detector with a large effective area.However, the detection efficiency of an X-ray detector is always below 50%,18and it is impractical for an X-ray detector to have an area of about 1 m2.Thus,the pulse intensity matrix constructed by using Zhang’s method will be extremely sparse,17and it is difficult to estimate the period of an X-ray pulsar by using an individual output matrix (see Section 3).In this paper, we find a way to mix the output matrices of different data segments together to obtain an accumulated output matrix that can be used to estimate the spin period of an X-ray pulsar.
The organization of this paper proceeds as follows: Section 2 describes the principle of the FFA;Section 3 introduces the post-order traversal of a binary tree into the FFA and proposes an improved FFA useful to estimate the spin period of an X-ray pulsar;Section 4 verifies the performance of the proposed method by simulation data and real data from the Neutron star Interior Composition Explorer (NICER) mission.
2.Brief review of FFA
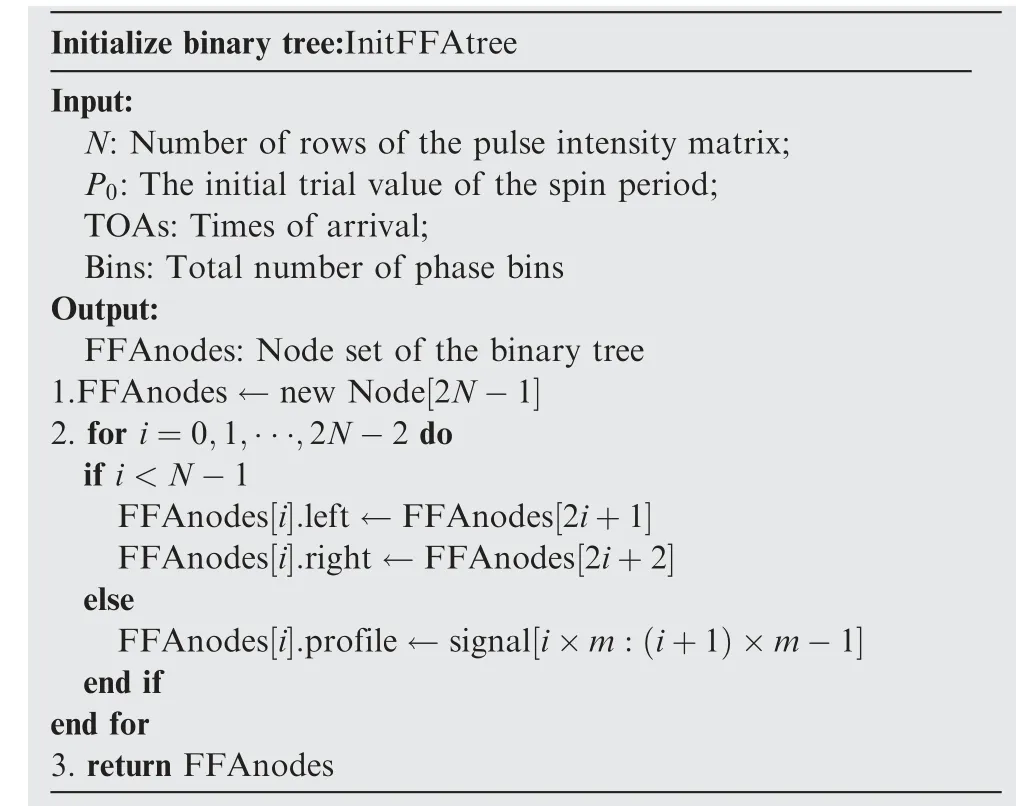
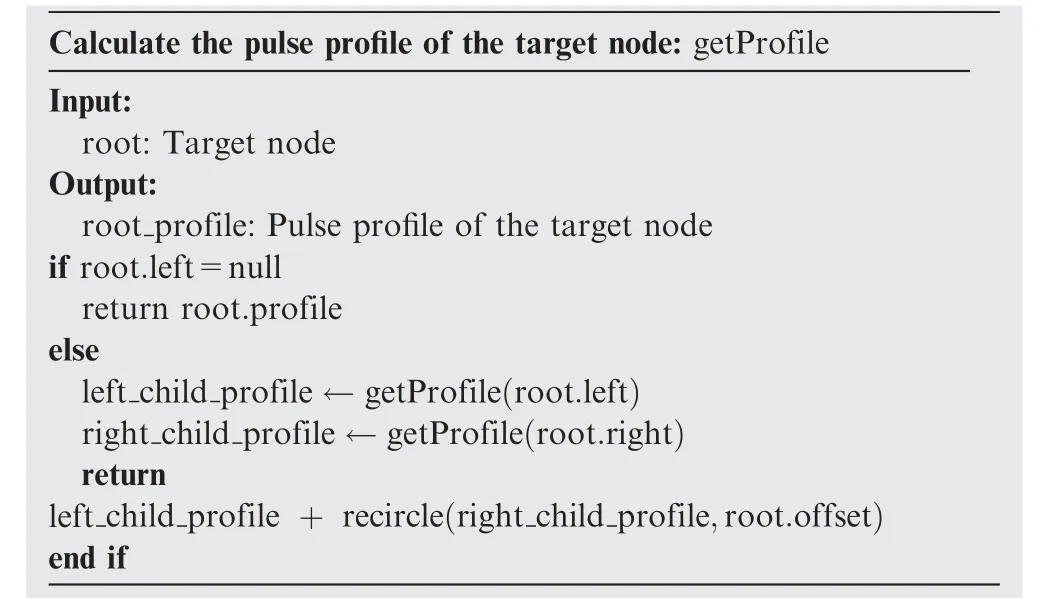
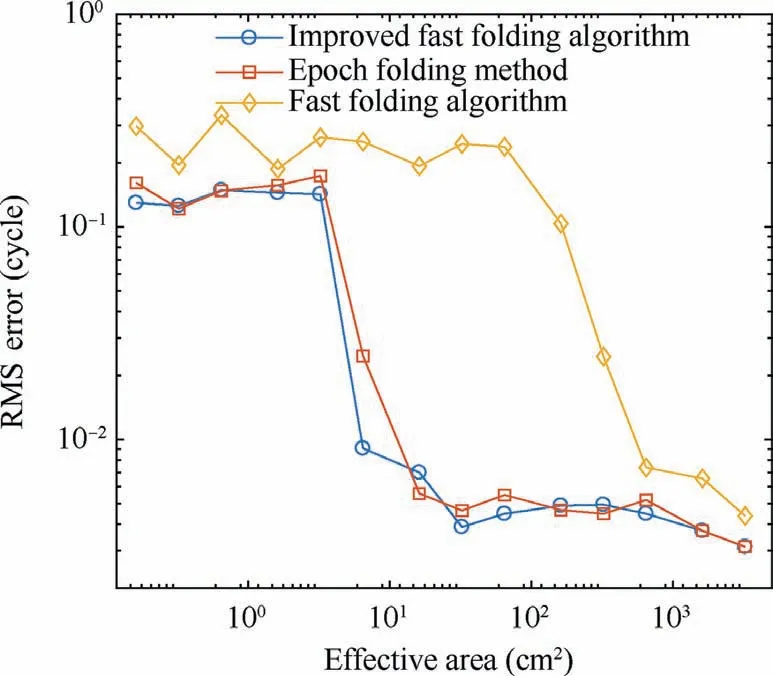
In the example shown in Fig.1, we generated an evenlysampled artificial periodic pulsed signal containing N=8 cycles with m=8 phase bins in each cycle, an initial phase of φ=2 bins and a pulse period P (8tbin Considering the range of a folding period([mtbin,(m+1)tbin]), for each subset, in fact, the pair can be integrated with the trial period of mtbinor (m+1)tbin.For example, the folding transforms of the first two rows are In the 1st output matrix,each subset contains 4 rows.After the folding transform of the first subset (see the first blocks highlighted in orange in the second panel from the left), we can obtain the first 4 matrix rows of the 2nd output matrix(see the upper half highlighted in red in the third panel from the left),as shown in Eq.(3).Each matrix row now represents an integrated profile with the folding periods of mtbin,(m+1/3)tbin,(m+2/3)tbin, and (m+1)tbin, respectively. Fig.1 An example of FFA. More generally, for each subset (highlighted in orange) of the ithoutput matrix,the kthrow of the lower half(highlighted in blue)needs to be cyclically shifted to the left by k phase bins and k+1 phase bins, respectively.Then, add them to the kthrow of the upper half (highlighted in red) respectively as the 2kthand (2k+1)throws of the corresponding block of the(i+1)thoutput matrix. It should be noted that, for the FFA, in order to avoid aliasing in calculation, N satisfies the following equation17: After fast folding, each row of the final output matrix represents a cumulative profile, and the folding period of the kthrow is In the example shown in Fig.1,the pulses drift in phase by S=4 bins over the total observation time.In the output matrix, a visible peak denotes a candidate periodic signal,and the row and column indices of the peak correspond to its period and initial phase,respectively.The peak’s row index is equal to S+1,indicating that the period of the pulsed signal is [m+S/(N-1)]tbin. The original FFA is stored and calculated in the unit of data block, which leads to a high CPU cache burden and a lack of flexibility when the calculation scale is large.If we are only interested in the profiles integrated by some certain folding periods, in addition to outputting the required information(i.e., the corresponding rows of the final output matrix), the original FFA also performs many useless calculations.For the example shown in Fig.2,supposing that we want to obtain the 5th row of the output matrix, then in the 3rd output matrix, only the 3rd row of the upper half and the 3rd row of the lower half are needed, and so on until we trace back to each row of the pulse intensity matrix.The tracing path of the above process is shown as the red lines in Fig.2.This is a typical recursive process, and all traversed nodes form a full binary tree.The cumulative profile (i.e., the 5th row of the output matrix) can be obtained through the post-order traversal of a binary tree.Thus, a node data structure is defined,which contains four attributes:profile is an array with m elements that stores the corresponding pulse profile; offset represents the number of phase bins that the profile of the right child node left circularly shifted when calculating the profile of this node;left is the left child node;right is the right child node. The process of integrating the cumulative profile of the root node can be divided into three steps: Step 1.Initialize the binary tree.It includes specifying the connection relationship of nodes according to the properties of the full binary tree and assigning the profile of each leaf node to the corresponding row of the pulse intensity matrix.The detailed process is shown as the pseudo code in Algorithm 1. Algorithm 1.Initialize binary tree. Initialize binary tree:InitFFAtree Input:N: Number of rows of the pulse intensity matrix;P0: The initial trial value of the spin period;TOAs: Times of arrival;Bins: Total number of phase bins Output:FFAnodes: Node set of the binary tree 1.FFAnodes ←new Node[2N-1]2.for i=0,1,∙∙∙,2N-2 do if i Step 2.Calculate the offset of each non-leaf node.For a trial period, there is a corresponding binary tree to integrate the cumulative profile.Binary trees of different trial periods have the same leaf nodes, and only the offset attributes of the non-leaf nodes are different.Therefore, when integrating the cumulative profile of a different trial period, it is not necessary to build a new binary tree,but to re-assign the offset of each non-leaf node.As shown in the pseudo code below, a breadth-first traversal of the binary tree is performed to calculate the offset of each non-leaf node (see Algorithm 2). Algorithm 2.Calculate offset attribute of each non-leaf node. Calculate offset attribute of each node: CalculateOffset Input:k: Row index of the pulse profile to be output;FFAnodes: Node set of the binary tree Output:root: Root node of the binary tree 1.N ← FFAnodes.Length+1) / 2 2.depth ←1 3.for i=0,1,...,N-2 do if k % 2=0 FFAnodes[i].offset ←k/2 else FFAnodes[i].offset ←(k+1)/2 end if if i+2=2depth k ←k/2 depth ←depth+1 end if end for 4.return FFAnodes[0]( Step 3.Calculate the profile of the root node.By a postorder traversal, the profile of each leaf node is integrated to the profile of the root node (see Algorithm 3). Algorithm 3.Calculate pulse profile of target node. Calculate the pulse profile of the target node: getProfile Input:root: Target node Output:root profile: Pulse profile of the target node if root.left=null return root.profile else leftchild profile ←getProfile(root.left)rightchild profile ←getProfile(root.right)return leftchild profile,root.offset)end if profile + recircle(rightchild By introducing the post-order traversal of the binary tree into the FFA, the data is no longer stored and calculated in blocks.Meanwhile, the algorithm can output cumulative profiles according to requirements, which reduces redundant calculations and makes the algorithm be able to be combined with an optimization algorithm to improve the calculation efficiency. X-ray pulsars are very faint, so a spacecraft can only record a series of X-ray photon events rather than a continuous pulsed signal.16Thus, as a preliminary step, the photon event series needs to be converted into a pulse intensity matrix.This procedure is performed as follows: select photon events within a time interval[t0,t0+NP0], where t0and P0represent the start time and the initial trial value of the spin period, respectively,and N is a power of 2.Then,each P0is further divided into m equal-length phase bins.Then, with the number of photon events in each phase bin being counted,we obtain an intensity sequence with a length ofNm.Finally,the intensity sequence is reshaped into a pulse intensity matrix with N rows and m columns. Since the photon flux of an X-ray pulsar is a constant,for the same type of detector, the average photon count rate is determined by the effective area of the detector.For the NICER, the source pulsed rate and the total non-pulsed rate of the Crab pulsar are 660 counts/s and 13860.2 counts/s,respectively.19Photon events are recorded by 56 concentrator-detector pairs, and each pair has a collection area of about 30 cm2.In order to analyze the performance of the FFA in the case of a small collection area, we select the observation data of 5 concentrator-detector pairs.The data is converted into a pulse intensity matrix following the steps above and then processed by the FFA(m=N=256), and Pearson’s χ2is used to test the cumulative profiles in the FFA output matrix.Results show that the curve of the χ2value with the folding period doesn’t have an obvious peak (see Fig.3), meaning that the spin period cannot be accurately estimated by the FFA in the case of a small effective area. The underlying cause leading to the failure of the FFA is that the integration time of the FFA is limited, over which there are not enough photons to integrate a cumulative profile with an acceptable Signal-to-Noise Ratio (SNR).Since the spin period cannot be accurately estimated by any individual output matrix, we contrive to prolong the integration time by mixing the output matrices of different data segments together. The phases of the FFA output matrix are referred to as the start times of the corresponding data segments.The start times of data segments are different from each other, so the FFA output matrices cannot be added directly.For example, there is a photon event seriesTOAs.Taking P0as the folding period,TOAs is epoch folded by start time t0and t1=t0+0.25P0,respectively.As shown in Fig.4, the red curve is circularly shifted to the right for 0.25 cycle, and it will coincide with the blue curve, indicating that the start time can be adjusted from t1to t0only by circularly shifting the pulse profile to the right for (t1-t0)/P0cycle. Let tibe the start time of the ithdata segment.The kthrow of the ithFFA output matrix, whose folding period is Pk={ 1 + (k-1)/[m(N-1)]} P0, needs to cyclically shift to the right by m{[(ti-t0)/Pk]%1} phase bins.We call this process phase calibration.The FFA output matrices after phase calibration can be added together to obtain an accumulated output matrix that can be used to estimate the pulse period of the X-ray pulsar.As shown in Fig.5, for the accumulated output matrix of the NICER’s observation data,the curve of the χ2value with the folding period has an obvious and narrow peak, indicating that the spin period can be accurately estimated by this method. In this section,we employ Monte Carlo simulations20and real data from the NICER to investigate the proposed algorithm. Fig.3 Processing results of NICER’s observation data by FFA. Fig.4 Phase shift of cumulative profile caused by different start times. In order to compare the performance of the improved FFA with those of traditional methods, assume that the flux of the Crab pulsar is 1.54 counts∙cm-2∙s-1and the non-pulsed rate is 10 times of the source pulsed rate21,set the effective area to be different values, and then perform Monte Carlo simulations respectively.For each simulation data, the improved FFA (m=N=512, and the number of mixed matrices is 5),epoch folding, and the original FFA (m=N=512) are used to estimate the period and the initial phase22,respectively.Note that the magnitude of the estimation error of the initial phase φ0, is calculated modulo one cycle, i.e., where ^φ0is an estimate of the initial phase. Fig.5 Processing results of NICER’s observation data through segment correlation and amplitude accumulation. In Fig.6,the Root Mean Square(RMS)of the initial-phase estimation errors for different methods is plotted.It shows that as the effective area of the detector increases,for the three different methods, the variance of estimation error demonstrates a decreasing trend.The curve with square markers is in strong agreement with the curve with circular markers, implying that the improved FFA can achieve a similar accuracy compared with that of epoch folding.However, for the original FFA,the initial phase can be accurately estimated only when the effective area is large. Fig.7 Computational costs of improved FFA, epoch folding,and original FFA. Fig.6 RMS errors of improved FFA, epoch folding, and original FFA. As Fig.7 shows, with an increase of the effective area, the computation cost of the epoch folding method rises rapidly,while the computational cost of the improved FFA is not affected by the effective area of the detector.This is because,under epoch folding,all the photon phases need to be recalculated when the folding period changes.To complete a search of N trial periods, the improved FFA only demands to calculate the photon phases for the initial folding period P0to generate q pulse intensity matrices, q(Nlog2N-N+1) cyclic shifts, and qmN(log2N+1) additions.However, under epoch folding,about qN2P0f multiplication and modulus operations are required, where f is the average photon count rate.Since the original FFA is only effective when the effective area is large,the speeds of the improved FFA and the original FFA are compared when the effective area is larger than 700 cm2.It can be seen that both of them are much faster than epoch folding, but the improved algorithm has a slight advantage. Fig.8 Performance analysis of improved FFA at different SNR conditions. Fig.9 Comparison between results of improved FFA and ephemeris published by Jodrell Bank observatory. In order to verify the performance of the algorithm at low-SNR conditions, the source pulsed rate is set as 50 counts/s,and different SNR cases are constructed by changing the total non-pulsed rate,generating 1000 s simulation data to estimate the period of each simulation data by the improved FFA.As shown in Fig.8, the improved FFA maintains high performance at low-SNR conditions. The effectiveness of the proposed algorithm is further investigated by the observation data of the Crab pulsar from the NICER.The NICER has an extremely high time resolution and has accumulated up to 4 years of observation data since its launch.The improved FFA (m=N=1024, and the number of mixed matrices is 5) is used to estimate the spin frequency of each data segment.Then, a quadratic polynomial function is used to fit the function of estimated spin frequency and time.As shown in Fig.9,results of the improved FFA are in strong agreement with the ephemeris published by the Jodrell Bank observatory.Since the Crab is a young pulsar with unstable rotation, glitches often occur.According to the report, a large glitch occurred at MJD 58064.555.From the results, we can see that the fitting residuals near MJD 58065 increase suddenly. In this work,we conduct a systematic study on the application of the FFA on the spin period estimation of an X-ray pulsar,and propose an improved algorithm which can be applied to detectors with a much smaller effective area.Simulation results indicate that the improved FFA has a lower computational cost and maintains a high performance at low-SNR conditions.In order to further elevate the computational efficiency of the algorithm, we introduce the post-order traversal of a binary tree into the FFA.In this variant algorithm, data is no longer stored and operated in blocks, and cumulative profiles can be integrated according to requirements, which reduces redundant calculations and gains more flexibility for the algorithm. Declaration of Competing Interest The authors declare that they have no known competing financial interests or personal relationships that could have appeared to influence the work reported in this paper. Acknowledgement This work was supported by the National Natural Science Foundation of China (No.61703413).
3.Improved FFA
3.1.A binary tree-based FFA

3.2.FFA for a photon event series
4.Performance analysis and discussion


4.1.Simulation data


4.2.Real data
5.Conclusions
 CHINESE JOURNAL OF AERONAUTICS2023年10期