
Exploring groundwater quality in semi-arid areas of Algeria: Impacts on potable water supply and agricultural sustainability
2024-02-26 09:11NouaALLAOUAHindaHAFIDHarounCHENCHOUNI
Journal of Arid Land 2024年2期
Noua ALLAOUA, Hinda HAFID, Haroun CHENCHOUNI
1 Laboratory of Natural Resources and Management of Sensitive Environments, Larbi Ben M'hidi University, Oum-El-Bouaghi 04000, Algeria;
2 Department of Nature and Life Sciences, Faculty of Exact Sciences and Nature and Life Sciences, Larbi Ben M'hidi University,Oum-El-Bouaghi 04000, Algeria;
3 Laboratory of Algerian Forests and Climate Change, Higher National School of Forests, Khenchela 40000, Algeria
Abstract: Groundwater quality assessment is important to assure safe and durable water use.In semi-arid areas of Algeria, groundwater represents the main water resource for drinking water supply of the rural population as well as for irrigation of agricultural lands.Groundwater samples from wells and springs were collected from the Gargaat Tarf and Annk Djemel sub-watersheds of the Oum El Bouaghi, Algeria,and were analyzed and compared with the World Health Organization (WHO) standards.Results showed that most of the measured physical and chemical parameters exceeded the quality limits according to the WHO standards.Groundwater had a slightly alkaline water pH (7.00-7.79), electrical conductivity>1500µS/cm, chloride>500 mg/L, calcium>250 mg/L, and magnesium>155 mg/L.Water quality index (WQI)results showed that 68% of the area had excellent water quality, 24% of the samples fell into good category, and only 8% were of poor quality and unsuitable for human consumption.Six wells in the area showed bacterial contamination.Total coliforms (453.9 (±180.3) CFU (colony-forming units)/100 mL),fecal coliforms (243.2 (±99.2) CFU/100 mL), and fecal streptococci (77.9 (±32.0) CFU/100 mL) loads were above the standard limits set by the WHO.These results confirmed that water resources in the study area were strongly influenced by anthropogenic activities and were not recommended for consumption as drinking water.
Keywords: bacteriological indicator; groundwater; watershed; physical-chemical parameter; water quality index
1 Introduction
Groundwater plays a crucial role in ensuring human survival, fostering industrial development,supporting agriculture, and protecting ecosystem.Due to their importance, 97% of continental water are in a liquid state (Yapo, 2010), and these hydrosystems form a real continental ocean(Ntona et al., 2022).The availability and quality of groundwater, which supplies about half of the world's drinking water and more than 40% of its agricultural use, is critical to industrial and agricultural development, and urbanization, as well as food and energy security, and environmental sustainability, also affects human health (Mukherjee et al., 2020; Misstear et al.,2023).
Groundwater plays a crucial role in the water cycle, establishing vital connections with surface environments, and significantly influencing the functioning of aquatic ecosystems (Chenchouni et al., 2022).Phreatic waters acquire various soluble chemical elements as they circulate underground and come into contact with different geological formations.Additionally, aquifers,such as karst systems, possess specific physical characteristics that can make them more susceptible to surface contamination or the infiltration of contaminants into the subsurface(Misstear et al., 2023).These elements, originating from geological or anthropogenic sources,have the potential to alter groundwater quality and consequently impact ecosystem characteristics(ElKashouty et al., 2022).The quality of groundwater relies not only on the geological composition of the originating soil but also on reactive substances encountered during its flow,ionic exchange, mineral alteration, and the dissolution of authigenic minerals (Etikala et al., 2019;Chenchouni et al., 2023).
Groundwater, sourced from both confined and surface aquifers, serves as a vital water resource utilized by humans for a multitude of purposes (Prasad and Narayana, 2004).Conversely, the substantial volume of groundwater and its replenishment contribute to the remarkable stability and the dynamics of subsurface ecosystems when compared with the surface systems (Tsujimura et al., 2007).Particularly in arid and semi-arid areas, communities heavily rely on groundwater as a potable water source (Li et al., 2018).
Among the most water-scarce areas globally, the semi-arid areas of Algeria face significant challenges in terms of water availability.These areas experience reduced precipitation, often below 500 mm and frequently less than 300 mm per year, coupled with high evapotranspiration rate, resulting in scarce surface water resources (Allaoua et al., 2015).In semi-arid aquifers, the quality of groundwater can deteriorate rapidly due to various factors, including over-pumping,posing additional threats (Lar and Gusikit, 2015; Heggy et al., 2022).
Intensive use of natural resources and increased human activity have created serious problems with groundwater quality (Lapworth et al., 2022).Groundwater is particularly sensitive to different sources of pollution such as uncontrolled wastewater discharges, solid waste disposal,fertilizer, and pesticide applications.These natural hydrosystems are likely to be contaminated by many pollutant sources (Lukubye et al., 2017), such as the results of extensive agro-industrial activities and urbanization in contaminating aquifers including agricultural fertilizers and pesticides, industrial and domestic wastes, dumping in landfills, and pit latrines (Fida et al., 2023).One of the most important types of pollution in rural areas is animal or human fecal contamination (Barnes and Gordon, 2004).Microbial indicators of fecal contamination are employed as markers to assess water quality.This is because fecal matter may harbor pathogenic organisms that can pose potential health risks or adverse effects on human health.Given the significance of scientific research in achieving effective and efficient groundwater quality management, this study aims to review the current state of groundwater quality in the two sub-watersheds: Annk Djemel and Gargaat Tarf, located in the Oum El Bouaghi in Northeast Algeria and understand its impact on drinking water supply and agriculture.Specific objectives include the detailed evaluation of the water physical-chemical characteristics, identification of sources of contamination, and study of the consequences on agriculture from a perspective of sustainability of water resources.The obtained results will be compared with World Health Organization (WHO) standards for drinking water, using the water quality index (WQI) as a means for reporting the data of water quality measurements and provide them in a consistent manner to authorities' management, decision makers, and the public (Qasemi et al., 2023).This comprehensive analysis seeks to provide valuable insights into the water quality status of the mentioned areas, which are primarily influenced by agricultural activities.In addition, the results of this study may inspire discussion about installation and the importance of installation.We will contribute to sustainable groundwater management by introducing a quality control system and establishing a monitoring network to evaluate aquifer degradation.
2 Materials and methods
2.1 Study area
The study area is located at the south of the Oum El Bouaghi, Northeast Algeria and two sub-watersheds (Gargaat Tarf and Annk Djemel) are selected (35°38′-36°00′N, 06°35′-07°20′E;Fig.1).They are separated by the massif of Djebel Tarf that exclusively constituted by sub-horizontal limestone banks of the Cretaceous Age (upper Aptian Stage).The rest of the surface of sub-watersheds is essentially made up of recent geological formations, i.e., Quaternary,formed by massive limestone crusts, polygenic glacis coating the reliefs, ancient silts, arable land,and recent alluvium.Gargaat Tarf is marked by the presence of dune formation or glass.The hydrographic network represented by a poorly developed hair, is of endoreic type.The main wadi,wadi Boulefreis is born in the Aures Area (Allaoua and Hafid, 2019).
The climate of the area is continental and belongs to the semi-arid bioclimatic stage, with cold winters and hot, dry summers, characterized by irregular precipitation.The prevailing winds are from the southwest, west, and northwest.The minimum precipitation is 107.7 mm and the maximum is 392.0 mm.Seasonal precipitation is 122.0 mm in winter, 108.0 mm in spring, 50.0 mm in summer, and 132.0 mm in autumn.Monthly average temperatures ranged from 6.1°C in December to 38.3°C in August.The average minimum temperature was 2.1°C in December,whereas the warmest month was August with an average of 22.1°C.

Fig.1 Location and sampling sites in the Annk Djemel and Gargaat Tarf sub-watersheds, Algeria
2.2 Water sampling and data collection
The assessment involved the determination and characterization the physical-chemical and bacteriological properties of 25 groundwater samples, collected from wells and springs (Fig.1;Table 1) in 2023.The physical-chemical analyses were carried out on water from private wells and natural springs (Table 1).Because the collection of a water sample is quite delicate, the greatest care must be brought.It conditions the analytical results and the interpretation that will be given.To ensure the samples' homogeneity and representativeness, we collected and stored the water samples following a strict protocol.Polyethylene bottles with a capacity of 500 mL were used for this purpose.Before filling the bottles with water, we thoroughly washed the bottles themselves with nitric acid and then rinsed with distilled water.Additionally, to further minimize any potential contamination, we washed the bottles three times with the same water that was going to be analyzed.Once the cleaning process was completed, the bottles were fully filled with the water samples to be collected.This meticulous procedure aims to maintain the integrity of the water samples and ensure accurate and reliable analyses for the study.
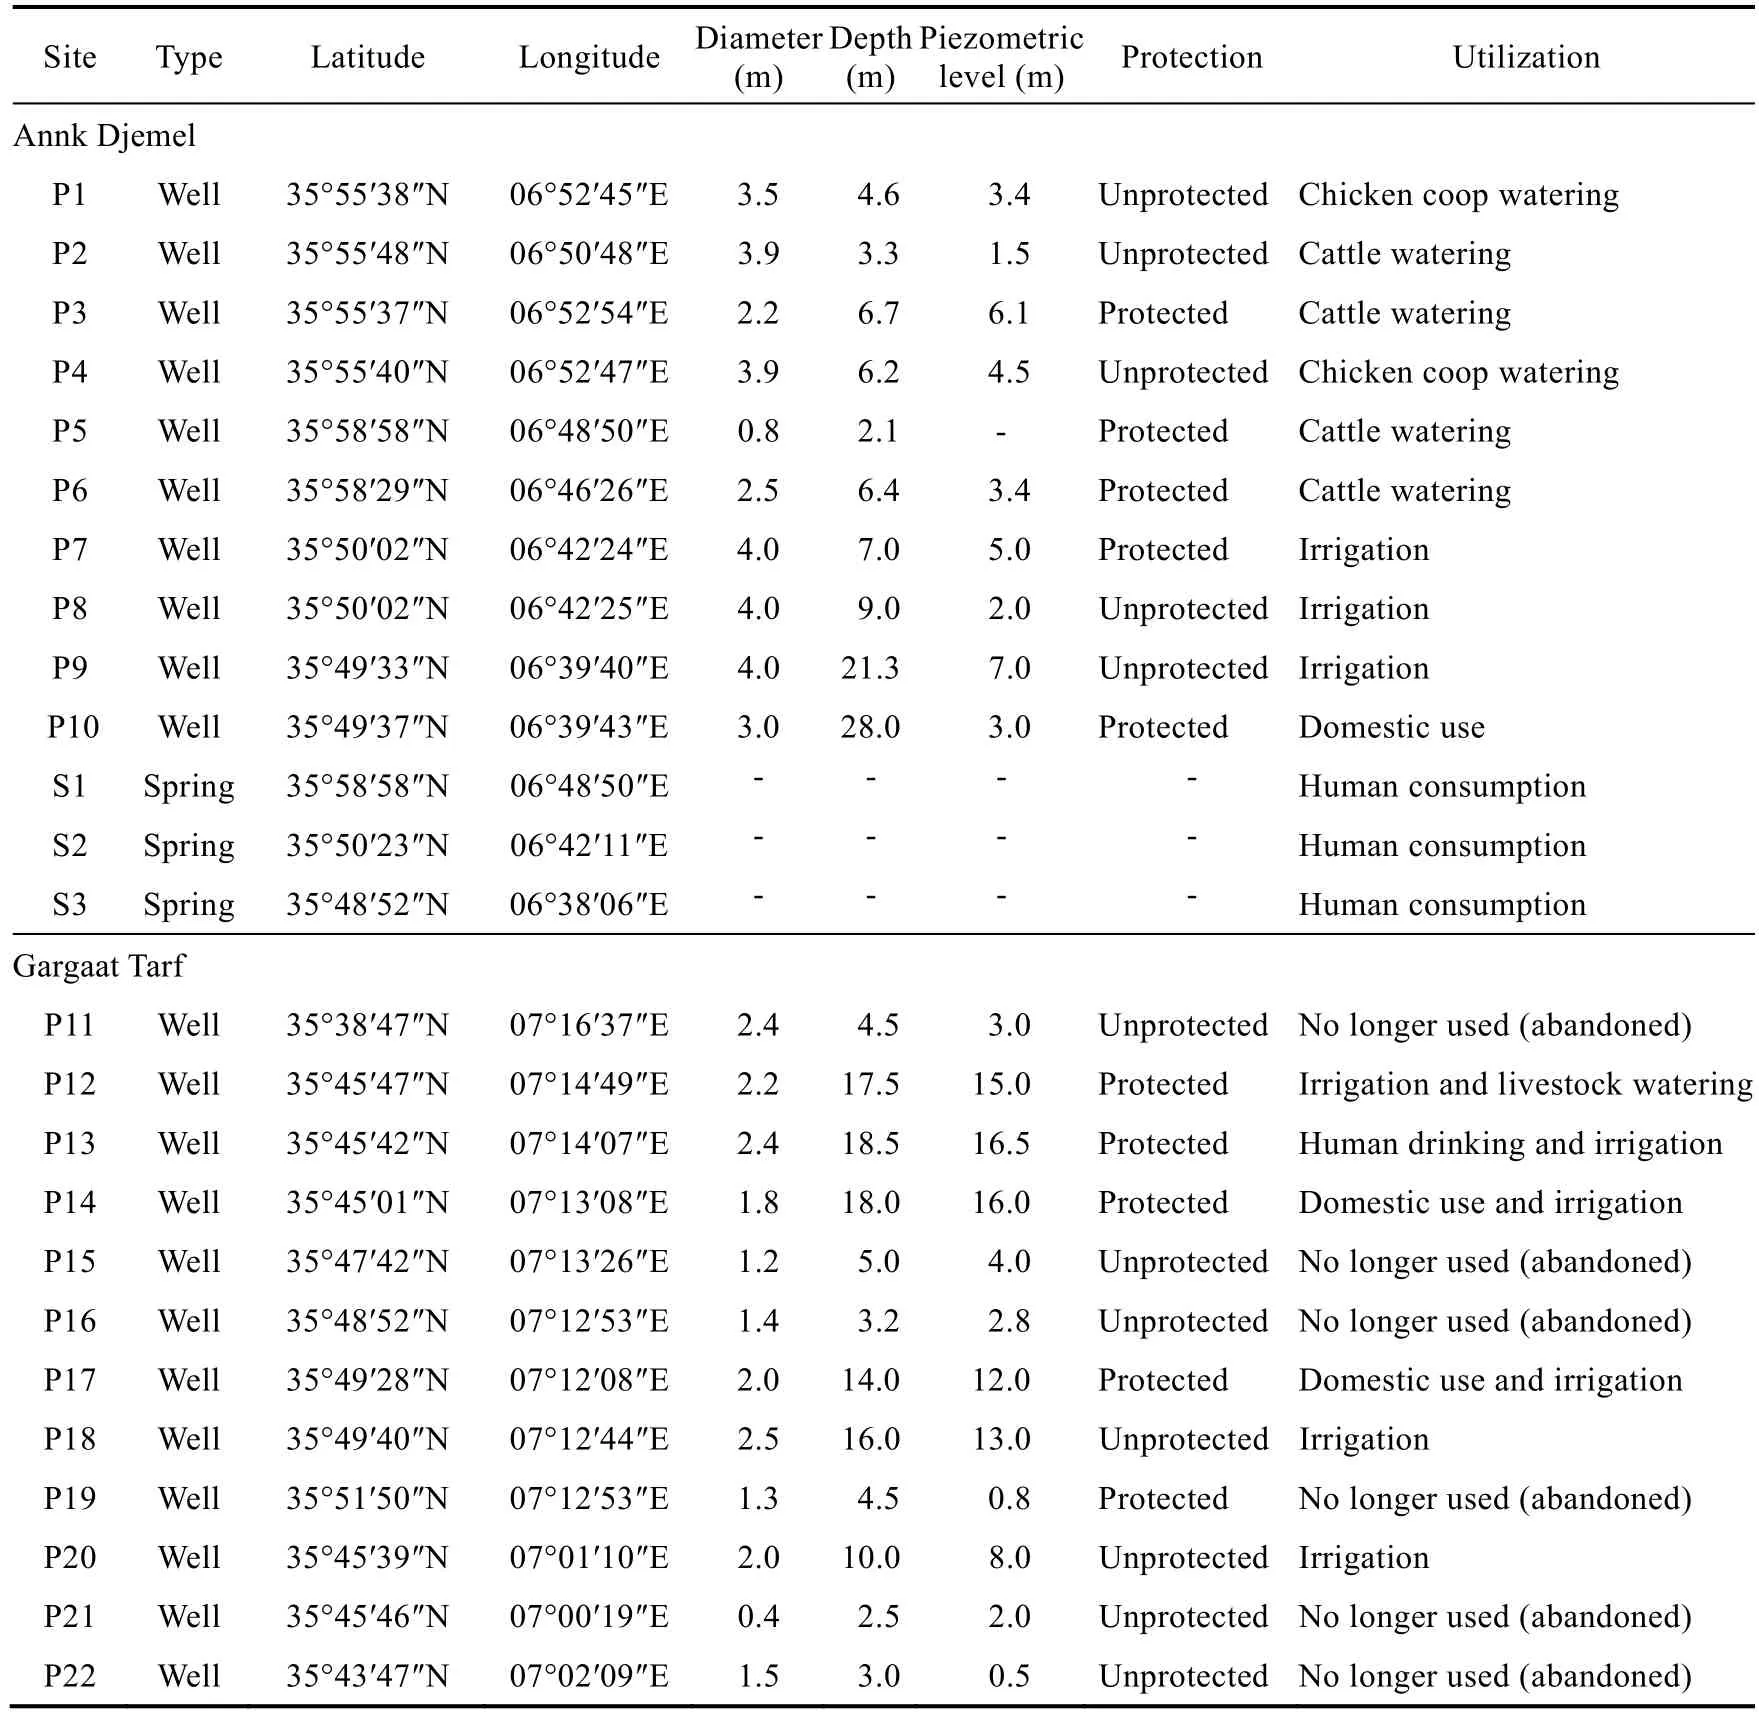
Table 1 Morphological characteristics of the sample sites in the Annk Djemel and Gargaat Tarf sub-watersheds,Algeria
2.3 Water physical-chemical analysis
After conductingin situmeasurements of electrical conductivity (EC), temperature, pH, and dissolved oxygen (DO) using an oximeter CellOX 325 (Xylem Analytics Germany Sales GmbH& Co.KG WTW, Weilheim, Germany) with a WTW multi-parameter device Multiline P3 PH/LF SET (Wissenschaftlich-Technische-Werkstätten GmbH, Weilheim, Germany), we collected and pre-filtered water samples.The pre-filtered samples were then placed in 1.5 L polyethylene bottles and stored at a temperature of 4°C to preserve their integrity.Chemical analyses were subsequently performed at the Laboratory of the Biology, Department of the Faculty of Exact and Nature Sciences at the Oum El Bouaghi University, Algeria.The determination of calcium was carried out through complexometry using ethylenediaminetetraacetic acid (EDTA) titration in the presence of a colored indicator (Murexide, also known as ammonium purpurate) and a 2-N sodium hydroxide solution.By calculating the difference between total hardness and calcium hardness,we directly obtained the magnesium hardness of the analyzed water.
This comprehensive analysis and accurate methodology ensure reliable and precise data for the assessment of water quality in the study area (Rodier, 2009).The determination of bicarbonates is carried out by titrimetry, a solution of known concentration of H2SO4was made to act on a precise volume of samples (100 mL) in the presence of methyl orange as an indicator; the reaction that occurs is due to the neutralization of bicarbonate ions by the H+ions of H2SO4.Chlorides are determined volumetrically by Mohr's method, precipitating silver chloride by reaction of chloride ions with silver nitrates and in the presence of 10% K2CrO4as an indicator.SO42-is determined by nephelometry, using a UV-visible spectrophotometer (WTW) set at a wavelength of 420 nm and calibrated prior to any determination of SO42-concentration that is related to the turbidity of the suspension (BaSO4).Nitrates, nitrites, and ammonium were determined by colorimetry.
2.4 Water bacteriological analysis
Water samples from wells and springs were carefully collected in sterile bottles to maintain their purity.After collection, we stored and transported these samples to the laboratory in cooler boxes to preserve their integrity and prevent any degradation of water quality during transportation.The laboratory analysis was promptly carried out within the next 4 h to ensure the freshness and reliability of the results.This strict protocol helps to minimize any potential contamination and provides accurate data for the study.Analyzes were performed at the laboratory.
Bromocresol purple lactose broth (BCP) tubes fitted with a Durham bell were used to count totalEscherichia coliafter a 24-48 h incubation period at 37°C.For confirmatory testing on Schubert's medium fitted with a Durham bell, aliquot positive tubes (lactose fermentation and gas production) and incubate at 44°C for 24-48 h.Addition of 2-3 drops of Kovacs reagent results in the formation of a red ring on the surface, indicating the formation of indole and thus the presence of faecal coliforms.The search for faecal streptococci is carried out on Rothe medium at 37°C for 24 h.From the positive Rothe tubes, a subculture is performed on Litsky medium for 24 h at 37°C.We calculated the results in number of germs per 100 mL according to the Mac-Grady table.
2.6 WQI
WQI is a valuable and efficient tool used to evaluate the overall quality of groundwater (Khan and Jhariya, 2017; Adimalla et al., 2018).It is derived from a comprehensive dataset and is presented in a manner that is easily comprehensible for water resource managers and decision-makers (Rana and Ganguly, 2020).WQI offers a consolidated and user-friendly approach to assess groundwater quality, making it a key component in informed decision-making and effective management of water resources.
WQI is commonly utilized to assess the suitability of groundwater for drinking purposes in various regions worldwide (Khan and Jhariya, 2017; Wu et al., 2017; Adimalla and Venkatayogi,2018; Verma et al., 2018).Five water classes are listed by the WQI value, i.e., excellent (WQI range: 0-25), good (WQI range: 26-50), moderate (WQI range: 51-75), poor (WQI range:76-100), and very poor (WQI>100).To determine if the groundwater is potable, we calculated the WQI using the weighted arithmetic index method:
whereqnis the quality rating of thenthwater quality parameter;wnis the unit weight for thenthparameter; andnis the total number of parameters included in the WQI calculation.
The quality index/sub-index (qnth) is a number that reflects the relative value of a certain parameter in polluted waters compared with its standard admissible value:
wherevnis the estimated value of thenthparameter;snis the standard permissible value of thenthparameter in most cases; andviois the ideal value of thenthparameter.vio=0.0 except for pH and DO.For pH,vio=7.0 andsn=8.5; for DO,vio=14.6 andsn=5.0 mg/L.According to Adimalla and Venkatayogi (2018), we used WQI to determine whether groundwater is suitable for drinking purposes in different parts of the world.Initially, we considered the maximum values for the physical-chemical parameters studied based on the Algerian standards for surface waters (Table 2).These values were utilized to establish the relative importance of each parameter in the overall assessment of water quality.WQI calculation takes into account these weights and constants to provide a comprehensive and standardized evaluation of the water quality, aligning with the established standards for surface waters in Algeria.
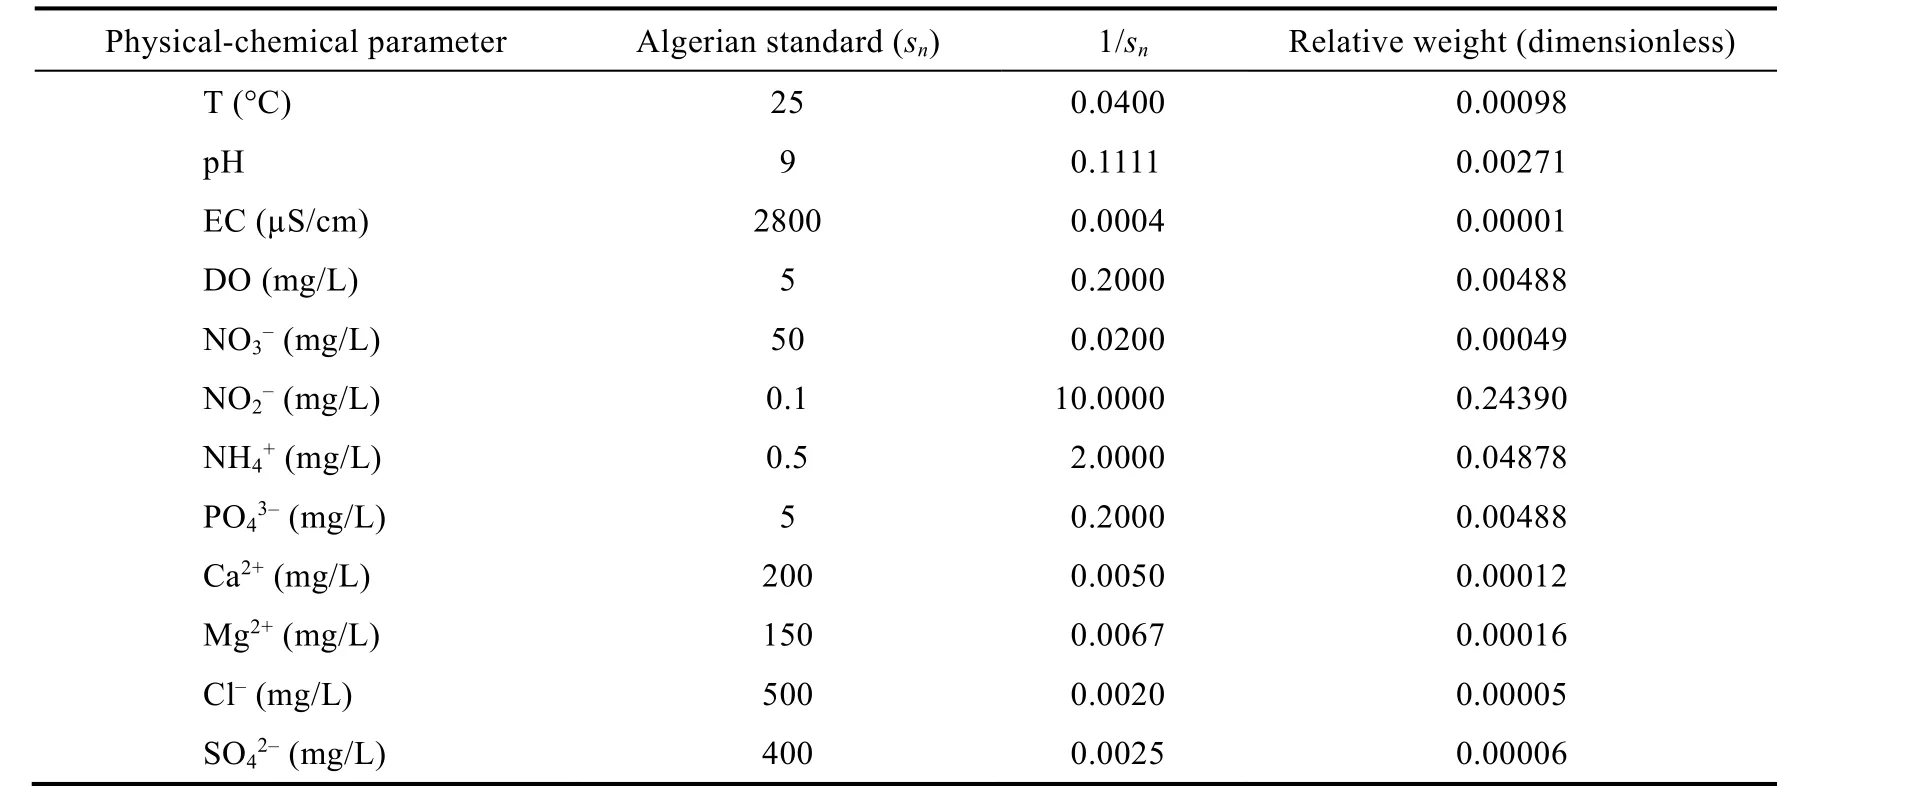
Table 2 Weights of physical-chemical parameters and Algerian standard of surface water quality (OJRA, 2006)
2.6 Statistical analysis
In order to compare the values of different physical-chemical parameters in groundwater across the examined sub-watersheds, we computed the means±standard deviations (SD) and the range(minimum-maximum) based on observed data from wells and springs, considering them as replicates within each sub-watershed.To analyze the variation of physical-chemical parameters between the two sub-watersheds, we conducted Welch's two-samplet-test after confirming the normal distribution of data (using the Shapiro-Wilk test) and unequal variances (using theF-test).
Using Pearson's correlation, the connections between physical and chemical properties of water were examined.The generated correlation matrix was then displayed in a single plot together with the correspondingP-value and correlation coefficient (r).This visualization was accomplished using the Corrplot package (Wei and Simko, 2021).As changes in water characteristics resulting from the growth of one bacterial group may impact the growth of other bacteria either positively or negatively (Loucif et al., 2020), linear regressions and correlation tests were conducted to investigate the interrelationships between the densities of bacterial group.
To explore the relationships between previously mentioned water parameters and considered bacterial groups, we conducted redundancy analysis (RDA) using the Vegan package in the R software (Oksanen et al., 2022).The RDA biplot was generated using a correlative scaling method.Furthermore, Pearson's correlation tests were performed between the water parameter values observed at each water sample and RDA site scores (weighted sums of response variable scores) on the one hand, and the actual values of meteorological parameters and RDA constraints(linear combinations of climate variables) on the other hand.
To assess the impact of measured water physical-chemical parameters, represented by the WQI value, on the variation of bacterial loads for each of the three bacteria groups, we employed a generalized linear model (GLM).Bacterial load data were fitted to a Poisson distribution error with a log link function.All statistical analyses in this study were conducted using the R software(R Core Team, 2023).
3 Results
3.1 Water physical-chemical property
The well water's parameters exhibit minimal seasonal variations throughout the year, making it appropriate to characterize each site by calculating the average of measured values during the entire study period for each considered parameter.By taking the average, the data provides a representative and stable representation of the water quality for each site, which enables a comprehensive assessment of the well water conditions without being influenced by short-term fluctuations or seasonal changes.This approach allows for a more reliable and meaningful characterization of water quality at each site for the duration of the study.The values of the physical-chemical parameters of the sampled water are presented in Table 3.The Annk Djemel sub-watershed was characterized by groundwater with a temperature of 16.8°C (±0.3°C).The pH of the water varied between 7.00 and 7.80 with an average of 7.30; as for EC, it varied between 254 and 4160 μS/cm with an average of 2239 μS/cm.DO averaged 6.76 (±0.45) mg/L, regarding calcium carbonates (CaCO3), their concentrations varied between 200 and 1060 mg/L with an average of 531 mg/L, while bicarbonates (HCO3) were 217 (±52) mg/L.The average values of Ca2+were between 109 and 835 mg/L with an average of 383 mg/L, while Mg2+had an average of 147 (±19) mg/L.
Sulfates ranged from 80 to 472 mg/L and averaged 252 mg/L, chlorides were 591 (±101) mg/L.As for the four nutrients, the average NO3-was 10.49 (±5.13) mg/L, NO2-averaged 0.08 (±0.03)mg/L, as for NH4+was 0.18 (±0.06) mg/L with a range of 0.02-0.70 mg/L and finally for PO43-the values recorded varied between 0.00 and 0.25 mg/L and an average of 0.15 mg/L.
The water of the Gargaat-Taref sub-watershed marked the following characteristics: the temperature was 16.9°C (±0.26°C) and the pH varied between 6.68 and 8.04 with an average of 7.38.The EC was 3153 (±608) μS/cm, the DO content was 6.79 (±0.32) mg/L.Calcium carbonates averaged 508 (±56) mg/L and bicarbonates ranged from 210 to 833 mg/L with an average of 478 mg/L.Ca2+averaged 446 (±87) mg/L.Mg2+ranged from 32 to 481 with a mean of 163 mg/L.NO3-averaged 4.81 (±1.12) mg/L, NO2-averaged 0.25 (±0.06) mg/L, and NH4+ranged from 0.01 to 0.14 mg/L with an average of 0.25 mg/L.PO43-ranged from 0.00 to 0.29 mg/L and an average of 0.11 mg/L, Cl-averaged 725 (±188) mg/L and SO42-ranged from 74 to 756 mg/ and an average of 452 (±76) mg/L.Despite the spatial variations observed in the physical-chemical parameters of the sub-watersheds, the difference was statistically insignificant(P>0.050), except for bicarbonates (P<0.003), sulfates (P=0.028), and nitrites (P=0.035) (Table 3).
3.2 Relationships between water parameters
Correlation tests between the groundwater physical-chemical parameters of the two subwatersheds are summarized in Figure 2.Correlation analysis in the Annk Djemel and Garrat Taref sub-watersheds resulted in significant correlation in 19 of 98 pairs of water attributes.For the Annk Djemel sub-watershed, the highest negative correlations were obtained between the following pairs: DO and temperature (r= -0.94,P<0.001), HCO3and temperature (r= -0.79,P=0.001), HCO3-and EC (r= -0.63,P=0.031), NH4+and DO (r= -0.79,P=0.003), NO2and temperature (r= -0.66,P=0.014), and NO2-and EC (r= -0.63,P=0.008).The highest positive correlations were obtained for Ca2+and CaCO3(r=0.97,P<0.001), and HCO3-and NO2-(r=0.92,P<0.001).Other positive correlations were recorded between the following pairs: HCO3-and DO(r=0.83,P=0.000), CaCO3and EC (r=0.77,P=0.002), Ca2+and EC (r=0.77,P=0.004), Mg2+and CaCO3(r=0.77,P=0.002), Mg2+and EC (r=0.60,P=0.030), Cl-and CaCO3(r=0.78,P=0.002),Cl-and Ca2+(r=0.77,P=0.002) and NH4+and T (r=0.69,P=0.009).On the other hand, a significant correlation in 25 of 98 pairs of water attributes was found in the Gargaat Taref sub-watershed.There was a strong correlation between EC, CaCO3(r=0.91,P<0.001), sulfates(r=0.89,P<0.001), and Cl-(r=0.85,P=0.001).Other significant correlations were noted between EC and CaCO3(r=0.71,P=0.010).A significant correlation was also found between SO42-and HCO3-(r=0.80,P=0.002), SO42-and NO2-(r=0.76,P=0.004), SO42-and NO3-(r=0.73,P=0.007),SO42-and Cl-(r=0.72,P=0.008), NO3-and NO2-(r=0.86,P<0.001), NO3-and HCO3-(r=0.83,P=0.001), NO2-and HCO3-(r=0.81,P=0.002), and PO43-and NO3-(r=0.60,P=0.041).On the other hand, negative correlations included the following pairs: OD and T (r= -0.91,P<0.001), OD and NH4+(r= -0.71,P=0.010), pH and HCO3-(r= -0.71,P=0.009), pH and NO3-(r= -0.61,P=0.035), pH and PO43-(r=071,P=0.010), and pH and Cl-(r=0.59,P=0.044).

Table 3 Physical-chemical characteristics of groundwater in the Gargaat Tarf and Annk Djemel sub-watersheds,Algeria
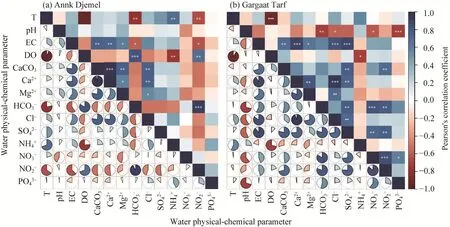
Fig.2 Correlation between water physical-chemical parameters from wells and groundwater in the Annk Djemel (a) and Gargaat Tarf (b) sub-watersheds, Algeria.***, P<0.001 level; **, P<0.010 level; *, P<0.050 level.T,temperature; EC, electrical conductivity; DO, dissolved oxygen.
3.3 Bacteriological quality of groundwater
Variations of bacterial load in the groundwater of the Annk Djemel sub-watershed are depicted in Figure 3.Bacteriological examination of the water revealed that, out of the 13 wells analyzed, 6 wells contain a total heterotrophic bacterial load.The average concentration of total coliforms for all wells during the study period was approximately 453.9 (±180.3) CFU/100 mL, with a maximum value of 1900.0 CFU (colony-forming units)/100 mL observed in the well P9.As for fecal coliforms, their average concentration in all wells was approximately 243.2 (±99.2)CFU/100 mL, with a maximum of 1000.0 CFU/100 mL found in the well P3.As for fecal streptococci, we noted that the average concentration in well water was 77.9 (±32.0) CFU/100 mL with a maximum of 324.0 CFU/100 mL in the well P3.On the relative variation, the result of the coefficient of variation (CV) showed that all the concentrations of bacterial load of the examined surface waters were heterogeneous (CV=143% in total coliforms, CV=147% in fecal coliforms,and CV=151% in fecal streptococci).

Fig.3 Chord diagram displaying the distribution of densities (CFU/100 mL) of main bacterial groups.TC, total coliforms; FC, fecal coliforms; FS, fecal streptococci.P1-P3 and P7-P9 are sampling sites where bacterial groups are positively detected.
3.4 Interrelationships between bacterial groups
Interrelationship between bacterial groups is shown in Figure 4.All bacterial densities are correlated with each other.Positive significant correlations (P<0.001) were revealed between FC and fecal coliforms (r=0.96), fecal coliforms and total coliforms (r=0.92), fecal streptococci and total coliforms (r=0.89).The slopes of linear of regression equations for the correlations ranged from 0.161 to 2.927 being the largest for fecal coliforms.

Fig.4 Correlative scatter plot among bacterial groups detected at groundwater in semi-arid areas of Algeria.Red lines represent linear regressions with the equations given at top of plots above the diagonal.Blue ellipses represent 50% and 95% concentration levels of observations with the center in solid red circle.(a1 and a2),correlations between FS (fecal streptococci) and FC (fecal coliforms), and between TC (total coliforms) and FS;(b1 and b2), correlations between FC and FS, and between TC and FS; (c1 and c2), correlations between FC and TC, and between FS and TC.
3.5 Effects of water characteristics on bacterial loads
RDA was employed to examine the relationships between groundwater physical-chemical parameters and bacterial load.The results indicated that the first and second axes explained 96.9% and 2.9% of the eigenvalues, respectively.According to the first axis of RDA, which represents the majority of information, we found that most of the water parameters exhibited negative correlations with pH, DO, HCO3-, and NO2-.These parameters were positioned on the positive side of the axis.Moreover, the distribution of bacterial groups was also plotted on the positive side of the axis (Fig.5; Table 4).This analysis suggests a clear association between the physical-chemical parameters of groundwater and the presence of bacterial groups, indicating potential inter-relationships between these variables.
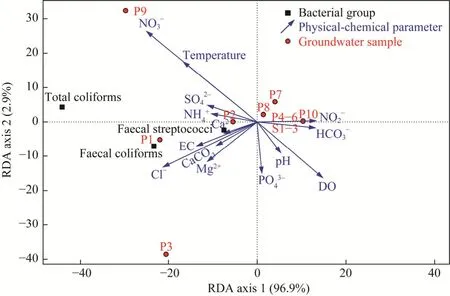
Fig.5 Tri-plot of the RDA (redundancy analysis) examining relationships concentrations of water physical-chemical parameters and loads of bacterial groups in groundwater in semi-arid areas of Algeria.EC, electrical conductivity;DO, dissolved oxygen.
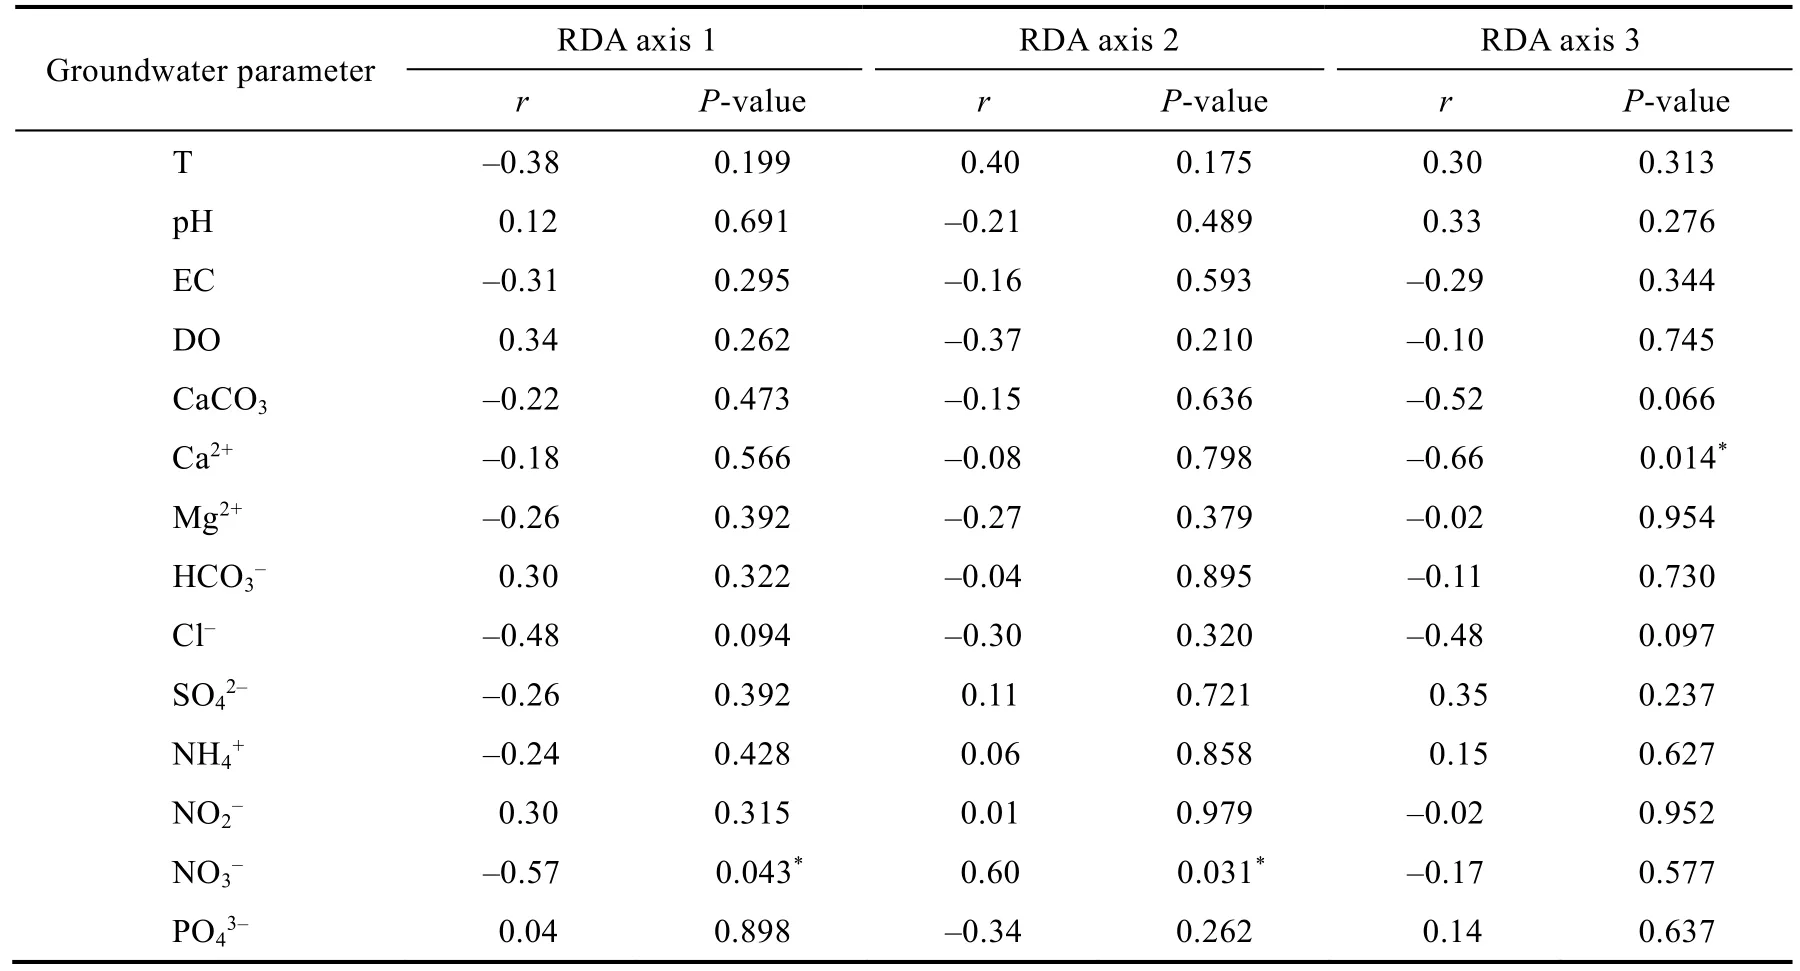
Table 4 Correlations of groundwater physical-chemical parameters within the first three axes of RDA(redundancy analysis)
On the second axis of RDA that presents only 2.9% of the variation, the bacterial load of total coliforms was positively associated with the concentrations of NO3-, NH4+, SO42-, and the temperature in the water, but negatively with the pH of the water.DO, Mg2+, HCO3-, Cl-, and EC all along the axis were positively correlated with fecal coliforms and to a lesser degree with fecal streptococci.RDA triplot indicated that all the abiotic parameters and the bacterial load were negatively correlated on the first axis, indicating that bacterial load increased according to the increase of a few parameters such as NO3-, temperature, and NH4+; but were not statistically significant (P>0.050).According to the parameters of water and bacterial abundance, there was a clear spatial separation, which allowed us to classify our sample sites into two groups according to the physical-chemical quality and bacterial load: the first group formed of the wells P9, P1, and P3.The water of these wells showed significant mineralization and pollution by NH4+and NO3-as well as a high bacterial load.The first group was opposed to the second group, which included the rest of the wells (P2, P4, P5, P6, P7, P10, S1, S2, and S3), and the three sources characterized by a relatively average mineralization compared with the other sites and almost zero pathogen contamination.
3.6 Effect of WQI on bacterial loads of contamination-indicators
WQI of the Gargaat Tarf varied from 17% to 50%, indicating that the water quality varies from excellent to very poor, while WQI of the Annk Djemel indicated that 85% of all samples analyzed were of excellent quality, 15% were good.For the entire study area, we found that 68% of samples fell into the excellent category and 24% of samples fell into good categories and only 8%of poor quality and unfit for human consumption (Fig.6).
Throughout the study period, there was a significant difference between average value of WQI(P=0.032) in the two sub-watersheds.On the relative variation, the result of CV observed for the two sub-watersheds was largely higher, indicating that WQI was heterogeneous.In comparison,the basin of the Ank Djemel with the CV of 139% had a more heterogeneous water quality than the Gargaat Tarf (CV=87%).Regarding the results of GLM, the effect of WQI on bacterial load showed a negative effect on the three groups of bacteria indicators: fecal coliforms (t= -0.97),fecal streptococci (t= -0.93), and total coliforms (t= -1.00).Although these relationships were negative (Fig.7), GLM analysis revealed that there were no significant effects observed for the bacterial groups.Similarly, when testing the effects of water physical-chemical parameters on the variation of bacterial group loads, GLM also demonstrated no significant effects (Table 5).These results suggest that the variations in bacterial loads were not significantly influenced by the physical-chemical parameters of the water, indicating a lack of significant correlation between these factors.
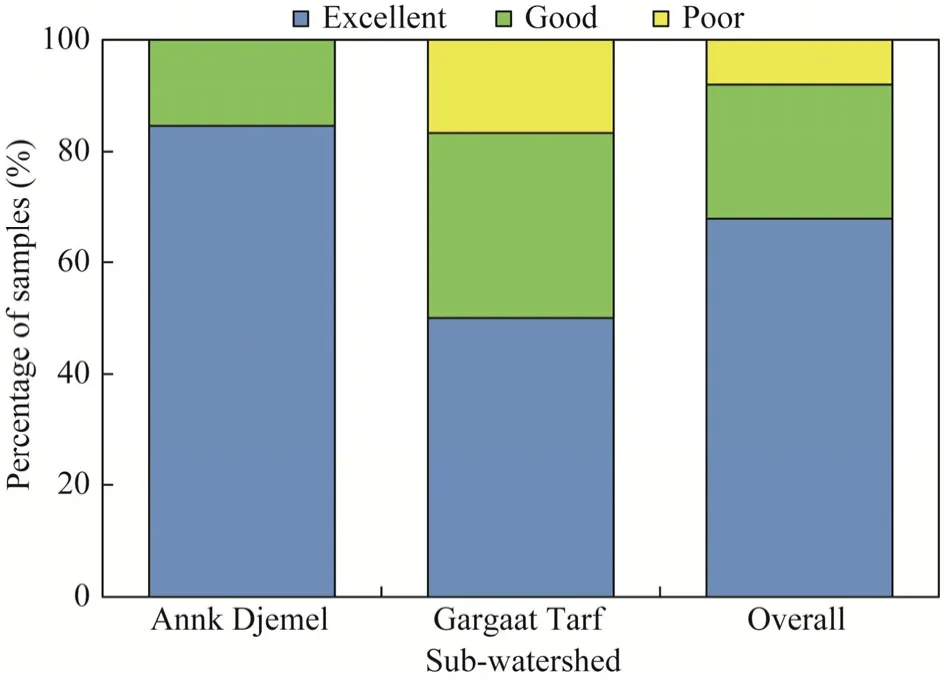
Fig.6 Classes of water quality index of groundwater in the Annk Djemel and Gargaat Tarf sub-watersheds, Algeria
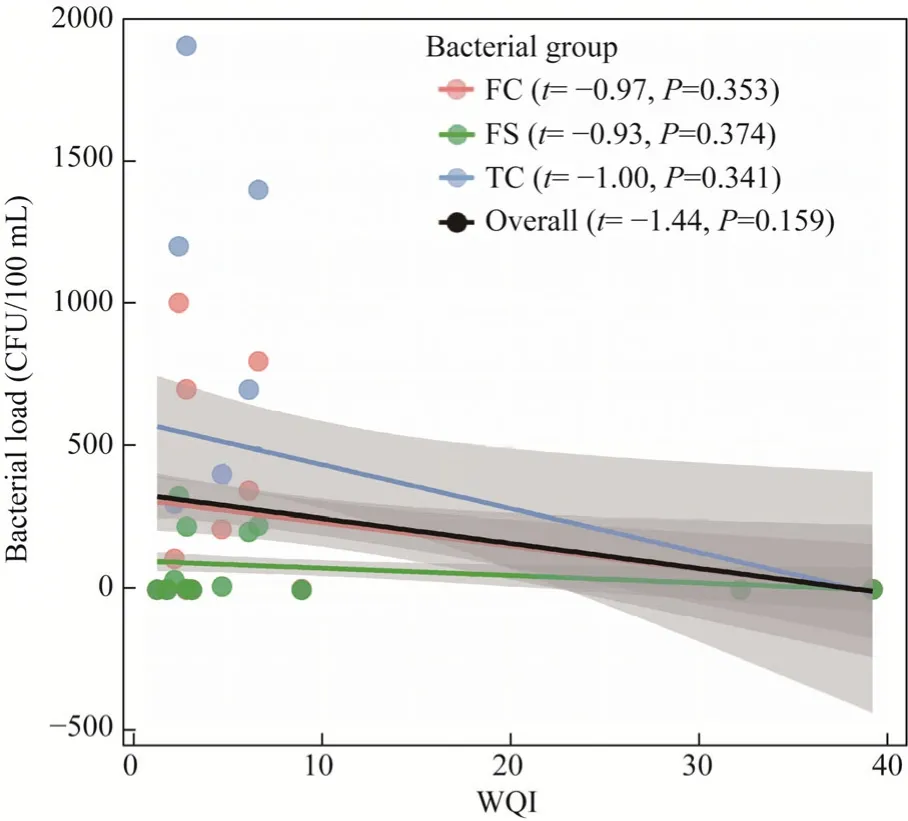
Fig.7 GLM (generalized linear model) plot showing the effect of WQI (water quality index) on the variation of water bacterial groups for groundwater at the Annk Djemel sub-watershed, Algeria.FC, fecal coliforms; FS, fecal streptococci; TC, total coliforms.Solid lines represent linear regressions obtained by a GLM fit with 95%confidence level in light grey.

Table 5 GLM (generalized linear model) testing the effects of water physical-chemical parameters on the variation of bacterial groups
4 Discussion
The assessment of water quality is generally based on the monitoring of microbial elements, in particular the presence of fecal coliform bacteria, as well as on the analysis of physical-chemical characteristics (Guemmaz et al., 2020; Loucif et al., 2020).Water parameters and quality are influenced by a complex interaction between external and internal factors.External factors include weather conditions, substrate characteristics (such as soil and sediment), and pollution sources, while internal factors are the result of biochemical reactions occurring in the water itself(Hacioglu and Dulger, 2009).
4.1 Water physical-chemical property
The results of physical and chemical parameters of groundwater were compared with the standard guideline values recommended by the WHO (WHO, 2017).Temperature is one of the physical-chemical parameters used to assess the quality of drinking water.It plays a role in many phenomena, such as the speed of chemical reactions in the body of water, the decrease in the solubility of gases, as well as the accentuation of the tastes and colors of water (Daghara et al.,2019; Calero Preciado et al., 2021; Moussaoui et al., 2024).
The average temperature of the water in all seasons was between 15°C and 19°C; the thermal variation of the water is about 0.2°C.Groundwater temperature can vary depending on the depth of aquifer and seasons.For example, the European Parliament has established an indicative value for the temperature of water for human consumption at 25°C, considering this temperature as a limit not to be exceeded (Rodier, 2009).
In the study area, pH values ranged from 6.68 to 8.04, with an average of 7.36.Most groundwater samples were between weakly alkaline and moderately alkaline levels, this phenomenon being attributed to the flow of water through the surface and subsurface carbonate layers (Rao et al., 2012).Slightly alkaline water has the ability to inhibit heavy metal toxicity in the form of precipitated carbonate or bicarbonate, rendering these heavy metals unavailable(Ahipathy and Puttaiah, 2006).The conductivity of water is an essential parameter because it evaluates the capacity of an aqueous medium to allow the passage of an electric current (Sui et al.,2018).Groundwater EC generally ranges from 254 to 7160 μS/cm, and this is closely related to the concentrations of ions present in these waters.These higher values are likely attributable to a high concentration of ions.Therefore, they indicate higher levels of total dissolved solids in groundwater, which contributes to increased salinity (Abboud, 2018).Furthermore, the large variations in EC values reflect significant differences in the predominant geochemical approaches in the study area.
DO concentration ranged from 3.99 to 9.53 mg/L, with an average of 6.77 mg/L.According to the standards, the maximum allowable limit for DO in drinking water is 8.00 mg/L (WHO, 2017).Concentration of DO plays a pivotal role in groundwater quality as it regulates the valence state of trace metals and restricts the bacterial metabolism of dissolved organic species.Due to these factors, measuring the DO concentration is considered vital in the majority of water quality studies (Bouaroudj et al., 2019; Cheng et al., 2019; Zhang et al., 2022).
Bicarbonates trigger the groundwater alkalinity (Adams et al., 2001), these elements are found naturally in waters, and their presence is attributed to the dissolution of carbonate formations such as limestone and dolomites (Drever, 2001).Bicarbonate is the most common anion in groundwater and comes mainly from CO2present in the soil (Ahuja et al., 2008).Its concentration varied from 55 to 833 mg/L in water, and its origin can be attributed to the leaching of carbonate formations.Singh et al.(2012) reported that during irrigation, rainfall infiltration, and groundwater movement, carbonates existing in carbonate rocks may have been dissolved and hence supplied to the groundwater system along with recharge water.These processes could account for the low alkalinity levels seen in some of the examined wells, possibly reflecting the hydrochemical immaturity of the groundwater or the shallowness of aquifer (Demetriades, 2011).
Cl-is found naturally in all types of water, but their main contributing sources are runoff,inorganic fertilizers used in agricultural fields, and wastewater discharges (Çadraku, 2021).In the present study, Cl-varied between 64 and 2482 mg/L, with an average of 655 mg/L, which exceeds the permissible limit (250 mg/L).The presence of high levels of Cl-in groundwater makes it potentially hazardous to human health (Pius et al., 2012; Noori et al., 2014).SO42-come from the dissolution and leaching of rocks containing gypsum, iron sulphides, and other sulfur compounds (Arjum et al., 2021).In 75% of groundwater samples, the concentration of SO42-exceeds the WHO recommended limit, which is set at 200 mg/L for direct drinking and domestic use.
Based on WHO guidelines (WHO, 2017), the concentration of Ca2+in drinking water should not exceed 200 mg/L.However, this limit is often exceeded in groundwater in many parts of the world, including Europe, Asia, and Africa.Ca2+concentrations varied between 109 and 1239 mg/L, with an average value of 250 mg/L.Ca2+originates from the dissolution of carbonate and evaporitic minerals such as calcite, dolomite, aragonite, gypsum, and anhydrite, as well as from the carbonate cement present in geological formations (Bozdağ and Göçmez, 2013).Mg2+varied between 32 and 481 mg/L, with an average of 155 mg/L.It is very likely that the presence of Ca2+and Mg2+in groundwater comes from the leaching of carbonate minerals such as calcite and dolomite (Magesh et al., 2013).Geospatial distribution of cations showed that concentrations are higher in the Gagraat Taref than the Annk Djemel.It is very likely that the major source of Mg2+in groundwater is from magnesium-containing minerals such as dolomite and sulfate minerals present in the study area (Şener et al., 2017).
The presence of NO3-in groundwater can be attributed to fertilizer application, human and animal sewage, plant deposits, and other nitrate-rich wastes (Chukwura et al., 2015; Vincy et al.,2015).The concentration of NO3-in the analyzed water samples ranged from 0.01 to 68.22 mg/L,which was below the WHO permissible consumption limits (50.00 mg/L).NH4+, NO2-, and PO43-were well below the maximum desirable limits of the WHO.Their mean values are 0.22, 0.16,and 0.13 mg/L, respectively.The low concentrations of the three elements are attributed to the low contamination of these waters with pollution sources.
The use of Pearson's correlation matrix analysis is a valuable tool that can reveal the links and associations between hydrogeochemical parameters, allowing their origins and interrelationships to be identified (Guey-Shin et al., 2011; Mgbenu and Egbueri, 2019).According to their report,when the correlation coefficient (r) is greater than 0.70, it indicates a strong correlation between the two parameters, while if the value ofris between 0.50 and 0.70, it suggests a moderate correlation.A good correlation was observed between EC and HCO3-(r=0.63), EC and CaCO3(r=0.77), Ca2+and CaCO3(r=0.77), Mg2+and CaCO3(r=0.78), Ca2+and SO42-(r=0.91), Ca2+and Cl-(r=0.85), and SO42-and HCO3-(r=0.80) indicating that all of these elements could have the same origin.According to Singh and Mukherjee (2015), the increased presence of these ions can be attributed to the dissolution of evaporitic minerals.In addition, the ionic strength of water increases due to the dissolution of these evaporitic minerals, which also promotes the dissolution of sulphate salts, thus leading to an increase in the concentration of Mg2+and Ca2+in groundwater(Alaya et al., 2014).Negative correlations were observed between temperature and DO (r= -0.94)as well as between DO and ammonium (r= -0.71), illustrating the negative interactions between these parameters.Indeed, temperature influences both the solubility of oxygen in water and biological activities such as photosynthesis and respiration, which impacts the short-term oxygen concentration balance (Butcher and Covington, 1995; Daghara et al., 2019; Calero Preciado et al.,2021).
4.2 Bacteriological quality of groundwater
Analyzing the abundance and diversity of microorganisms is a useful approach for assessing the quality of drinking water (Favere et al., 2021).However, it is difficult to test the water for all of these organisms, as the isolation and identification of them is extremely complex (Soni et al.,2023).A commonly used indirect method to assess fecal contamination is to analyze coliform bacteria, which are widely considered reliable indicators of such contamination (Kistemann et al.,2002; Nola et al., 2002; Barnes and Gordon, 2004).The coliform bacteria concentrations were 453.9 CFU/100 mL for TC, 243.2 CFU/100 mL for FC, and 77.9 CFU/100 mL for FS in the wells P9, P1, and P3, respectively, due to the application of animal manure or dung.The coliform bacteria concentration was lower in the deepest wells, thus confirming that an artesian well is safer than a surface well or an outcropping spring.Several studies around the world have corroborated these observations, confirming that runoff and short residence times in permeable soils play a crucial role in the direct infiltration of manure into groundwater (Richardson et al.,2009; Masoud et al., 2016).Thus, the practice of open defecation and the use of private septic tanks lead to sewage entering groundwater sources in rural areas around the world (Schijven et al.,2010; Masoud et al., 2016).In the same context, Joseph et al.(2021) also reported that livestock grazing activity elevated bacteria numbers.Whereas Chadwick and Chen (2002) reported that the highest number of fecal coliforms and fecal streptococci were still present in manure.
The lack of protection of most wells is also a factor that contributes to the enrichment of water in organic matter due to windblown inputs of leaves and other plant debris that will decompose on site.All indicator bacteria were highly correlated with each other, the correlation coefficientrvaries from 0.89 to 0.96 (P<0.001), these positive correlations that were recorded show that these indicators probably have the same source of contamination.Atherholt et al.(2003) suggest that many total coliforms in the environment can only come from fecal sources.According to Francy et al.(2000), a strong correlation between two indicators may indicate that these two indicators come from identical or similar sources of contamination.Atherholt et al.(2003) reported that the existence of both fecal coliforms and fecal streptococci indicators provide strong evidence of fecal contamination.
4.3 Effects of water characteristics on bacterial loads
The growth of microorganisms in water is closely influenced by environmental factors (Fister,2016), which establishes a relationship between physical-chemical properties and the amount of bacteria in this study, bacteriological analysis revealed different groups of bacteria with similar tendencies.Similar results were reported by Guemmaz et al.(2020), showing the influence of environmental factors on fecal bacterial loads measured in urban effluents discharged into the arid wadis of Algeria.Variations in environmental factors such as pH, salinity, metal concentrations,and energy exert selective and direct effects on the composition, abundance, and spatial distribution of microbial communities (Dell'Anno et al., 2003; Franklin et al., 2007; Guo et al.,2015; Jordaan et al., 2016; Liu et al., 2018).RDA analysis shows that NO3-, NH4+, SO42-,temperature, Ca2+, EC, Cl-, CaCO3, and Mg2+are the environmental variables that statistically best explain the variations in bacterial distribution.Total coliforms include fecal coliforms and all bacteria in this group have similar biochemical characteristics and are found in soil or water(Rodier et al., 2009).
In the present study, total coliforms responded positively to increased nitrate.Vandenberg et al.(2005) reported that coliform bacteria use ammonia and nitrate as nutrients.Fecal coliforms are specifically associated with feces (Rodier et al., 2009), and nitrate ions can be produced by the oxidation of ammonium ions present in feces (Bou Saab et al., 2007).Nitrate ions and fecal coliforms therefore share a common origin.Indeed, water temperature is one of the most significant environmental parameters that influence the concentrations of fecal indicator bacteria.Indeed, some studies have reported an inverse relationship between fecal coliforms and water temperature, while other researchers have found a direct relationship between fecal coliforms and water temperature (Loucif et al., 2020; Valenca et al., 2022).In our study, we found that increasing temperature promotes the development of bacterial load of total coliforms, fecal coliforms, and fecal streptococci.These results are consistent with that reported by Chigbu et al.(2005), who also found a correlation between temperature and fecal coliforms.However, our results differ from those reported by Tek et al.(2001), who did not observe a relationship between temperature and these bacterial indicators.
Variable responses of bacterial populations were also observed in relation to other physical-chemical parameters of groundwater.For example, high values of EC, Mg2+, Ca2+, and CaCO3have also been associated with an increase in the abundance of these bacteria (Nola et al.,2002).In a bacteriological and chemical investigation of groundwater in Cameroon, Nola et al.(2002) discovered that higher EC and concentrations of oxygen, Cl-, Na+, K+, Ca2+, and Mg2+promoted the abundance of fecal coliforms and fecal streptococci.Although Ondieki et al.(2021)claim that total coliforms rise at acidic pH, Loucif et al.(2020) assert that alkaline pH obviously impairs the survival of fecal coliforms.Depending on the environmental parameters available,such as the ideal pH, temperature, amount of nutrients, and suspended particles, the coliform bacteria's survival can always be prolonged, in some cases, and can even be expanded (Juhna et al.,2007).
4.4 WQI
A total of 68% of groundwater samples taken during the research period classed as excellent water,with good water about 24%, whereas poor water was 8%.The latter, which exhibits poor quality,may be a result of agricultural influence, effective ion leaching, excessive groundwater use, direct effluent discharge, and other factors (Sahu and Sikdar, 2008).Indeed, WQI is an essential parameter for evaluating the quality of groundwater and determining its suitability for consumption.In reality, WQI is an essential indicator for determining groundwater's quality and establishing whether it is fit for human use (Mishra and Patel, 2001; Naik and Purohit, 2001;Avvannavar and Shrihari, 2008; Rana and Ganguly, 2020; Ram et al., 2021).
WQI was tested with bacterial load values, which are chosen as indicators of pollution with the GLM test.Thet-test shows negative correlations between WQI and bacterial load.Thus, low values of WQI were found to be closely related to high load values of total coliforms, fecal coliforms, and fecal streptococci, which indicates poor quality for some groundwater samples in the study area; on the other hand, GLM indicated a non-significant effect of this correlation.On the relative variation, the results of CV showed that all the values of WQI were heterogeneous,thus signifying the spatial diversity of study area as well as various pollutants that threaten the groundwater quality.
This study offers a robust assessment of groundwater quality in semi-arid areas of Algeria,providing valuable insights into the suitability of water for both drinking and agricultural purposes.The comprehensive analysis includes a range of physical-chemical parameters, and the application of WQI enhances the clarity of the findings.However, it is essential to acknowledge the limitations of this study.The sample size is relatively small, potentially limiting the generalizability of the findings.Furthermore, the focus on specific parameters and the absence of consideration for seasonal variations might not fully encapsulate the dynamic nature of groundwater quality.Future research endeavors with larger and more diverse datasets, along with an exploration of temporal variations, would strengthen the overall reliability and applicability of the results.
4.5 Implementation and perspective
In the larger context, this study prompts a reevaluation of water management practices,advocating for policies that prioritize the preservation and enhancement of groundwater quality.The result emphasizes the urgency of collaborative efforts involving stakeholders, policymakers,and local communities to ensure access to safe and potable water-a fundamental right for the present and a necessity for future generation.In the face of bacterial contamination and water-related health risks, diverse solutions can be considered.Firstly, improving sanitation infrastructure is crucial to prevent contaminant spills into groundwater sources.Additionally,reinforcing water point protection through filters and physical barriers can mitigate direct contamination.Raising community awareness about proper hygiene practices and preserving water sources is equally imperative.Implementing regular water quality monitoring is essential to swiftly respond to bacterial contamination.Simultaneously, strict adherence to water quality standards and tailored regulation is necessary to oversee potentially contaminating activities.Lastly, fostering multi-stakeholder collaboration among local authorities, government organizations, communities, and water management experts is paramount to coordinate efforts aimed at sustainably restoring and preserving water quality and this concerted action ensures a safe supply of potable water for local populations.
5 Conclusions
The assessment of groundwater quality emerges as a very important aspect in ensuring the safety and sustainability of water usage.In semi-arid areas like Algeria, where groundwater serves as the primary water source for rural communities and agricultural activities, its quality holds immense significance.Our study extensively analyzed various parameters in groundwater samples from the Gargaat Tarf and Annk Djemel sub-watersheds of Algeria.The findings showed that physical and chemical parameters surpassed the recommended limits by the WHO.Notably, pH ranged slightly alkaline (7.00-7.79), with elevated levels of EC, Cl-, Ca2+, Mg2+, and other substances, signaling compromised water quality.Despite these concerns, WQI offered a nuanced perspective.A significant portion of the area, approximately 68%, exhibited excellent water quality, while 24%fell under the good category.However, alarmingly, 8% indicated poor quality, rendering them unsuitable for human consumption, emphasizing the imperative need for remediation and management strategies.The presence of bacterial contamination, particularly in six wells, further underscores the influence of human activities on the water resources.Elevated levels of coliforms and streptococci above the WHO standards reflect the anthropogenic impact on water quality,posing health risks, and deeming certain water points unsuitable for drinking.These revelations call for immediate attention and strategic interventions.The significance of this research extends beyond mere observation; it demands actionable steps to rectify the deteriorating quality of groundwater.Efforts must focus on targeted measures to mitigate anthropogenic influences,implement rigorous monitoring frameworks, and devise interventions that safeguard water resources.
Conflicts of interestsThe authors declare that they have no known competing financial interests or personal relationships that could have appeared to influence the work reported in this paper.
Acknowledgements
Haroun CHENCHOUNI received funding from the European Union's Horizon 2020 Research & Innovation Programme (2211) under the Partnership for Research and Innovation in the Mediterranean Area (PRIMA) Project''SHARInG-MeD'' and from the Directorate-General for Scientific Research and Technological Development(DGRSDT) under the Projets de Recherche Formation-Universitaire (PRFU) Projects (D00L02UN120120230002,D01N01UN120120230005).We express our gratitude to Dr.Haythem DINAR (University of Oum El Bouaghi,Algeria) for his invaluable assistance in plotting the Figure 1.
Author contributions
Conceptualization, methodology, investigation, data curation, resources, and writing - original draft preparation:Noua ALLAOUA; writing - original draft and writing - reviewing and editing: Hinda HAFID; Formal analysis,visualization, writing - original draft, and writing - reviewing and editing: Haroun CHENCHOUNI.All authors approved the manuscript.
- Journal of Arid Land的其它文章
- Runoff change in the Yellow River Basin of China from 1960 to 2020 and its driving factors
- A CMIP6-based assessment of regional climate change in the Chinese Tianshan Mountains
- Influence of varied drought types on soil conservation service within the framework of climate change:insights from the Jinghe River Basin, China
- Land use and cover change and influencing factor analysis in the Shiyang River Basin, China
- Effects of landscape fragmentation of plantation forests on carbon storage in the Loess Plateau, China
- Effects of drip and flood irrigation on carbon dioxide exchange and crop growth in the maize ecosystem in the Hetao Irrigation District, China