
Runoff change in the Yellow River Basin of China from 1960 to 2020 and its driving factors
2024-02-26 09:11WANGBaoliangWANGHongxiangJIAOXuyangHUANGLintongCHENHaoGUOWenxian
Journal of Arid Land 2024年2期
WANG Baoliang, WANG Hongxiang, JIAO Xuyang, HUANG Lintong, CHEN Hao,GUO Wenxian
1 School of Water Conservancy, North China University of Water Resources and Electric Power, Zhengzhou 450046, China;
2 College of Water Resources, North China University of Water Resources and Electric Power, Zhengzhou 450046, China
Abstract: Analysing runoff changes and how these are affected by climate change and human activities is deemed crucial to elucidate the ecological and hydrological response mechanisms of rivers.The Indicators of Hydrologic Alteration and the Range of Variability Approach (IHA-RVA) method, as well as the ecological indicator method, were employed to quantitatively assess the degree of hydrologic change and ecological response processes in the Yellow River Basin from 1960 to 2020.Using Budyko's water heat coupling balance theory, the relative contributions of various driving factors (such as precipitation, potential evapotranspiration, and underlying surface) to runoff changes in the Yellow River Basin were quantitatively evaluated.The results show that the annual average runoff and precipitation in the Yellow River Basin had a downwards trend, whereas the potential evapotranspiration exhibited an upwards trend from 1960 to 2020.In approximately 1985, it was reported that the hydrological regime of the main stream underwent an abrupt change.The degree of hydrological change was observed to gradually increase from upstream to downstream, with a range of 34.00%-54.00%, all of which are moderate changes.However, significant differences have been noted among different ecological indicators, with a fluctuation index of 90.00% at the outlet of downstream hydrological stations, reaching a high level of change.After the mutation, the biodiversity index of flow in the middle and lower reaches of the Yellow River was generally lower than that in the base period.The research results also indicate that the driving factor for runoff changes in the upper reach of the Yellow River Basin is mainly precipitation, with a contribution rate of 39.31%-54.70%.Moreover, the driving factor for runoff changes in the middle and lower reaches is mainly human activities, having a contribution rate of 63.70%-84.37%.These results can serve as a basis to strengthen the protection and restoration efforts in the Yellow River Basin and further promote the rational development and use of water resources in the Yellow River.
Keywords: Budyko theory; hydrological regime; attribution analysis; ecological responses; Yellow River; climate change; human activity; runoff
1 Introduction
The ecological-hydrological processes of rivers have been determined to be critical in preserving the balance and integrity of river basin ecosystems.In fact, these processes are crucial for the sustainable development and usage of water resources as well as the survival of many creatures (Sofi et al., 2020; Gao et al., 2022).In recent years, the impact of climate change, such as precipitation and potential evapotranspiration, as well as the intensification of human activities, such as reservoir construction and land use changes, have contributed to the changes in the water resource circulation pattern within basin, affecting the development and use of water resources within basin and gradually leading to corresponding changes in the ecological environment within basin.Especially in arid areas, the degree of impact has been observed to increase (Wang et al., 2021; Liu et al., 2022; Wang et al., 2023).Therefore,analysing the evolution and attribution of river hydrological regimes is particularly important for evaluating the hydrological health of river.
At present, many researchers have conducted quantitative analyses to examine the changes in the hydrological conditions of rivers both domestically and internationally.Taye et al.(2011)employed hydrological models for evaluating the effects of climate change on the Nile River's hydrological regime and anticipated that the long-term impacts of rainfall and potential evapotranspiration would result in a decrease in the Nile River's future discharge.Sorribas et al.(2016) used hydrological models to assess the influence of climate change and human activities on Amazon River's hydrological changes and projected that the change in rainfall will lead to a drop in river flow in the eastern Amazon River Basin in the future.Moreover, Cheng et al.(2019) have verified the hydrological changes in the Yangtze River Basin as results of climate change and human activities using a variety of hydrological indicators.They discovered that during the 1970s, variations in precipitation and the construction of major reservoirs have resulted in a decline in river runoff, with human activities accounting for 63.00%-77.00% of this phenomenon.
The Yellow River, which is known as China's second largest river, has also undergone several changes at varied degrees in recent years.In past decade, several scholars conducted comprehensive studies on its hydrological conditions (Cuo et al., 2013; Gao et al., 2016; Li et al., 2016; Zhang et al., 2018).Shi et al.(2017) examined the long-term changes of runoff in the Yellow River and discovered that the runoff in the Yellow River has shown a declining trend and that the influence of climate change on runoff is waning.Human activities are increasingly growing, and in fact, these activities have now been identified as the primary contributing factor to decreased river runoff.The regulation and storage functions of reservoirs and changes in rainfall are considered as the most important factors directly affecting the runoff in the Yellow River.Moreover, the changes in hydrological processes in the Yellow River Basin are not only reflected on a single time scale or direction, but these are more three-dimensional and complex.Water resource management in the basin is deemed to be more challenging.Thus, a comprehensive ecological and hydrological evaluation of the Yellow River Basin from multiple perspectives is required to quantify the impact of different driving factors on hydrological processes, which are deemed critical in studying the Yellow River Basin's hydrological response processes in complex changing environments.
At present, there are more than 170 evaluation methods for hydrological indicators, but the most widely used method is the Indicators of Hydrologic Alteration (IHA) method proposed by Richter (1996).This approach may be used to assess the extent of hydrological change in rivers.This technique has been widely employed in the evaluation of hydrological change and ecological consequences after continuous improvement by various academics (Gao et al., 2009;Kim et al., 2011; Zhou et al., 2021).Changes in river hydrological regimes have comparable effects on ecosystems; hence, quantitative examination of the impact of river hydrological regime changes on biodiversity is an essential way of assessing ecosystem changes (Rolls et al.,2018; Cui et al., 2020).Pettersson (1998) found that Shannon Index (a diversity index) is a simple and reliable tool for identifying changes in biodiversity.Yang et al.(2008) applied Shannon Index to the river ecological evaluation and achieved good research results.
To quantitatively study the effects of the different driving forces on river runoff variations,local and international scholars have used various methodologies; they often employ hydrological models and elastic coefficient methods.Hydrological models are known as easily and precisely measure the influence of driving forces on runoff variations and have achieved rather strong research findings at various scales.However, the use of hydrological models requires data integrity (i.e., data cannot be missing or omitted), which is very scarce for longterm series statistical data.Moreover, there exist many uncertainties in parameter testing.Although Schaake (1990) first used the elastic coefficient method to analyse the relationship between precipitation and runoff changes, he failed to consider the effects of other climate change factors, such as potential evapotranspiration, temperature, and wind speed (Dooge et al.,1999; Fu et al., 2007; Yang and Yang, 2011; Liu et al., 2013), making the research results less accurate.To address this problem and make the research results more comprehensive and reasonable, Choudhury (1999) and Yang et al.(2008) proposed a basin water heat coupling equilibrium equation based on Budyko theory and refined the impact of climate change on rainfall and potential evapotranspiration, allowing for a more accurate and convenient study on the contribution rates of different driving factors to basin runoff changes over time.At present,this method has been widely used.In fact, Wang et al.(2012) investigated the contribution rates of climate change and human activities to runoff changes in the Yellow River using Budyko theory and differential equations.The aforementioned authors attributed variations in runoff mostly to human activities such as reservoir building and land use changes, with human activities becoming the most influential factor impacting runoff and accounting for 57.29%-83.61% of the total.Although other researchers have quantified the contribution rates of various driving factors to different river runoff changes, they have rarely considered the effects of river evapotranspiration and temperature, as well as the response relationships between various factors.Moreover, such scholars have failed to quantify the impact of these changes on ecology by combining them with ecological-hydrological indicators.
Based on this, this study further refines the two major driving causes of climate change and human activities into various influencing components to examine the changes in the Yellow River's hydrological process thoroughly.The objectives of this study are: (1) examining the changes in hydrological parameters such as precipitation, runoff, and potential evapotranspiration in the Yellow River Basin from 1960 to 2020; (2) calculating the degree of hydrological changes in the Yellow River Basin's upper, middle, and lower reaches, completely analyzing the overall hydrological change in the Yellow River Basin, and ascertaining the amount of danger faced by the Yellow River Basin's ecosystem; (3) quantitatively assessing the influence of hydrological regime changes on biodiversity in the Yellow River Basin; and (4)quantitatively investigating the contribution rates of different driving forces to the variations in runoff in the main stream of the Yellow River.This study can statistically examine the influence of runoff variations on the Yellow River's hydrological process and provide a basis for water resource management departments to develop and utilize water resources more wisely.
2 Materials and methods
2.1 Study area
The Yellow River is the world's fifth-largest river, with a total length of around 5464 km and a basin area of 7.95×10⁵km2(32°10′-41°50′N, 95°53′-119°05′E).It runs through nine Chinese provinces before joining the Bohai Sea (Xu et al., 2005; Zhu et al., 2016).The main river channel of the Yellow River Basin can be categorized into 11 river sections based on distinct sections and hydrological circumstances (Jin et al., 2020), comprising the upper, middle, and lower reaches.In recent years, the hydrological regime in different sections of the watershed has undergone varying degrees of change, due to the combined influence of various factors such as precipitation, reservoir construction and use, and land use changes, resulting in many negative impacts on the ecological environment.This article picks typical hydrological stations in the main stream of the Yellow River (Lanzhou Station and Toudaoguai Station in the upstream of the Yellow River Basin, Longmen Station and Xiaolangdi Station in the midstream, and Huayuankou Station and Lijin Station in the downstream) to measure the degree of hydrological changes in different sections and the influence of driving factors on the ecological environment within the basin (Fig.1).
2.2 Data
We got the daily runoff data of the Yellow River Basin from 1960 to 2020 from the "Yellow River Basin Hydrological Yearbook" (Yellow River Conservancy Commission of the Ministry of Water Resources, 1961-2021) and the selected six hydrological stations' records.The daily meteorological data were obtained from the China Meteorological Data website(http://data.cma.cn/) and the selected 33 meteorological stations' records shown in Figure 1.And the land use data at the level of 30 m resolution were acquired from the Resource and Environmental Science and Data Center, Institute of Geographic Sciences and Natural Resources Research, Chinese Academy of Sciences (http://www.resdc.cn).
2.3 Methods
2.3.1 Trend-Free Pre-Whitening-Mann-Kendall (TFPW-MK) test
The Trend-Free Pre-Whitening (TFPW) test is usually used to detect the trend of hydrological sequences without interference from other factors (Desa and Jemain, 2013; Blain, 2015;Emamgholizadeh, 2015).
For time series data,Xt(t=1, 2,...,t';t'is the sequence length), the calculation steps are as follows:
whereηis the slope of the sequence to be detected;aandbare the variables to be detected;xaandxbare the corresponding values of variableaandbin the natural sequence, respectively;Ytis the residual series after subtracting the trend;Yt-1is the next time period ofYt;Yt′ is the independent white noise sequence after removing the autocorrelation term;tY′′ is a new sequence obtained after TFPW processing; andεis the first order autocorrelation coefficient ofYt.
The Mann-Kendall (MK) significance test is performed on the new sequences:
whereUis the statistic value of MK test; andmis the number of nodes.Whenm≥10,Uapproximately complies with normal distribution, and its mean valueE(U) and variance(var(U)) can be calculated by Equation 6.
The standardized test statisticZMKis:
At theα-significant level, there is a tendency for sequence values to increase, if |ZMK|>Z(1-α/2)and vice versa, where theαcan be 0.10, 0.05 and 0.01, and the significance levelα=0.05 is generally taken, that is, the critical line ±ZMK(1-α/2)= ±1.96.
2.3.2 MK mutation test and Pettitt mutation test
The MK test is used for mutation testing on data such as precipitation, potential evapotranspiration, runoff, and temperature, with a wide range of testing and simple calculation(Hamed and Rao, 1998; Hamed, 2008).The specific inspection steps are as follows:
(1) For time series (x1,x2,...,xj,...,xi,...,xn), wherejandiare the corresponding sampling time, andj<i; andnis the number of data; we constructed a sequencesk:
whereskis the sum of times that the value at timeiis greater than the value at timej.
The valueηiis represented as follows:
(2) Set the data in time series as random and independent data, and define the statisticUFk,the equations are as follows:
whereUFkis the standard normal distribution andUF1=0 whenk=1;E(sk) is the average value ofsk; andvar(sk) is the variance ofsk.
(3) Arrange the time seriesZin reverse order and another statisticUBkis calculated using the Equations 8-13.
LikeUFk,UB1=0 whenk=1.If there is an intersection between theUBkandUFkcurves, and the intersection is between two critical straight lines, then the corresponding moment of the intersection is the moment when the mutation begins.
The Pettitt mutation test is a method based on the Mann-Whitney non-parametric test.This method can obtain abrupt change points through abrupt change analysis on the sequence of hydrometeorological factors and quantify the statistically significant level of abrupt change points (Rybski and Neumann, 2011; Conte et al., 2019).The Mann-Whitney non-parametric statistic is:
whereUf,Nis the test statistic at the possible mutation pointf;Uf-1,Nis the test statistic at the possible mutation pointf-1;xfis thefthobservation of the sequence;xhis thehthobservation of the sequence; andNis the number of observations in the time series, i.e., the sample size.
whereKf,Nis the mutation statistic; andPis the value of significance statistic.In general, whenP≤0.05, it is considered that there are mutation points in the data.
2.3.3 Indicators of Hydrologic Alteration-Range of Variability Approach (IHA-RVA) method
Richter et al.(1996) proposed the Range of Variability Approach (RVA), which includes five aspects: flow rate, event, frequency, duration, and rate of change.It is refined into 32 ecological indicators, all of which have certain ecological significance and can effectively reflect changes in river hydrological conditions.The degree of change (DC) of a single hydrological indicator is calculated using the following formula:
whereDcis the change degree of thecthindicator (%);P0andPeare the actual number of years and the predicted number of years when thecthindicator falls within the RVA threshold,respectively;ris the proportional coefficient, usually 50%; andPtis the total number of years after being affected.
whereD0is the overall degree of change.Hydrological parameters are considered to be highly altered when |D0|≥67.00%, moderately altered when 34.00%≤|D0|<67.00%, and lowly altered when |D0|<34.00%.
2.3.4 Ecological response analysis
Yang et al.(2008) quoted Shannon Index.Specifically, Shannon Index established the closest fitting relationship based on IHA hydrological index and regression equation of genetic programming method, and the formula is as follows:
whereSIis the Shannon Index used to reflect the species diversity;Dminis the Julian day with the minimum water level;Q3andQ5are the average flows in March and May, respectively;Min3and Min7are the 3- and 7-d minimum flows, respectively; Max3is the 3-d maximum flow;andRrateis the rate of water rise.
2.3.5 Penman-Monteith formula
Potential evapotranspiration is an important parameter for expressing evapotranspiration within a watershed.The Penman-Monteith formula calculates potential evapotranspiration based on daily meteorological data.For specific principles, please refer to previous studies (McVicar et al., 2012; Wang and Dickinson, 2012).
where PET is the potential evapotranspiration (mm);Rnis the net radiation on crop surface(MJ/(m2·d));Gis the soil heat flux (MJ/(m2·d));T2is the mean daily air temperature at a height of 2 m (°C);U2is the wind speed at a height of 2 m (m/s);exis the saturated water vapour pressure (kPa);eais the actual vapour pressure (kPa);Δis the slope of the saturated water vapour pressure curve; andλis the hygrometric constant (kPa/°C).
2.3.6 Budyko theory
According to Budyko's coupled hydrothermal balance theory, the water balance of the basin can be expressed as:
whereRis the average runoff depth (mm); PRE is the average precipitation (mm);Eis the average actual evaporation (mm); andΔSis the change in water storage (mm).In the long-term runoff change, ΔSis 0.
The water balance equation is expressed on an average annual scale as follows:
whereyis the characteristic parameter of the underlying surface of watershed, and givenR,PRE, and PET,ycan be derived.Because PRE, PET, andyare independent variables, the fully differential form of annual runoff is:
The expression of the water balance equation on the annual average scale is:
wherewcan be expressed as PRE, PET, ory.Assumingγ=PET/PRE, the elasticity coefficient can be calculated as follows:
whereεPREis the elasticity coefficient of precipitation;εPETis the elasticity coefficient of potential evapotranspiration; andεyis the elasticity coefficient of underlying surface.
The variation in runoff depth induced by each influencing factor can be determined using the elasticity coefficient of runoff for each factor:
whereΔRwis the change in runoff by each parameter;wrepresents each parameter, i.e., PRE,PET, andy;εwis the sensitivity of runoff volume to each parameterw; andΔwis the amount of changes in each parameter.
Each change quantity is superimposed as the total change quantity of runoff, which is denoted as ΔR′:
whereΔRPREis the amount of changes in runoff depth due to precipitation;ΔRPETis the amount of changes in runoff depth due to potential evapotranspiration; andΔRHAis the amount of changes in runoff depth due to human activities.In this study, the amount changes of underlying surface represent the influence of human activities, soΔRHAalso can be treated asΔRy(ΔRHA=ΔRy).
The contribution rates of precipitation, potential evapotranspiration, and underlying surface changes can be calculated using the following formula:
whereηPREis the precipitation contribution (%);ηPETis the potential evapotranspiration contribution (%); andηHArepresents the contribution of human activities (%).
3 Results
3.1 Characterization of changes in hydrometeorological factors
3.1.1 Trend test for precipitation
Owing to global climate change, the geographical distribution of precipitation in China has been noted to be shifting (Gu et al., 2020); changes in runoff and evapotranspiration in the basin will be affected, which, in turn, will have a detrimental impact on social and economic progress.Extreme climatic and hydrological phenomena, such as severe rain and flooding, will result in the shift in precipitation in time and place.The inter-annual precipitation pattern in the Yellow River Basin from 1960 to 2020 is depicted in Figure 2 with negative trend.The TRPW-MK test statistics were all less than the relevant critical values at the 0.05 significance level(|ZMK|<1.96), indicating that the test is not significant.The precipitation in the Yellow River Basin steadily increased from upstream to downstream from 1960 to 2020, indicating that the risk of rainstorms, floods, and other hydrological disasters rise in the Yellow River's middle and lower reaches than its upper.
Table 1 shows the typical precipitation characteristic values in the Yellow River Basin from 1960 to 2020.The annual average precipitation from the upper basin to the lower basin ranges from 352.3 to 564.2 mm.The annual maximum precipitation of the upper basin, middle basin,and lower basin were 511.2, 602.3, and 1019.1 mm, respectively, all of which occurred around the year of 1965.The largest variation coefficient is found in the downstream (0.24).The average annual precipitation values in the middle and lower reaches demonstrate geographical and temporal non-uniformity of precipitation, which may be attributed to the recent rise in the number of extreme weather events and human activities.
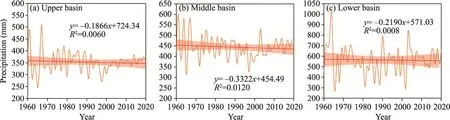
Fig.2 Inter-annual variation trend of precipitation in the Yellow River Basin from 1960 to 2020.(a), upper basin; (b), middle basin; (c), lower basin.The yellow line represents the value of precipitation; the red line represents the change trend of precipitation; the shadow represents the 95% confidence interval.

Table 1 Characteristic values of precipitation in the Yellow River Basin from 1960 to 2020
3.1.2 Trend test for potential evapotranspiration
In recent years, climate change has had a significant effect on the potential evapotranspiration changes in the Yellow River Basin while also having many negative consequences (Liu and Yang, 2010).The TRPW-MK test technique was used to investigate the trend and significance of potential evapotranspiration in the Yellow River Basin from 1960 to 2020 (Fig.3).The interannual potential evapotranspiration was noted to trend upwards.The TRPW-MK test statistics in the upstream and intermediate reaches were less than the 95% significance level(|ZMK|<1.96),indicating that the test is not significant.The downstream TRPW-MK test statistics exceeded the 95% significance level (|ZMK|≥1.96) and passed the 0.05 significance test.The Yellow River Basin's potential evapotranspiration increased gradually from upstream to downstream, which resulted in hydrological and meteorological drought to occur frequently in the Yellow River's middle and lower reaches, making it more vulnerable to extreme drought disasters such as high temperatures.
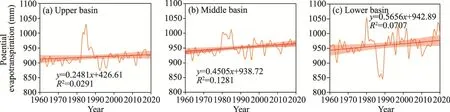
Fig.3 Inter-annual variation trend of potential evapotranspiration in the Yellow River Basin from 1960 to 2020.(a), upper basin; (b), middle basin; (c), lower basin.The yellow line represents the value of potential evapotranspiration; the red line represents the change trend of potential evapotranspiration; the shadow represents the 95% confidence interval.
The characteristic values of potential evapotranspiration in the Yellow River Basin from 1960 to 2020 are shown in Table 2.The average annual evapotranspiration from upstream to downstream were 920.3, 952.7, and 960.4 mm, respectively.The annual maximum potential evapotranspiration of upstream, midstream, and downstream were 1029.2, 1011.4, and 1054.3 mm, respectively, and the maximum values all appeared around 1985.Among them, the downstream variation coefficient was the largest, reaching 0.04, which may be related to extreme weather, greenhouse effect, climate warming, and other climate change factors in the post-mutation period.
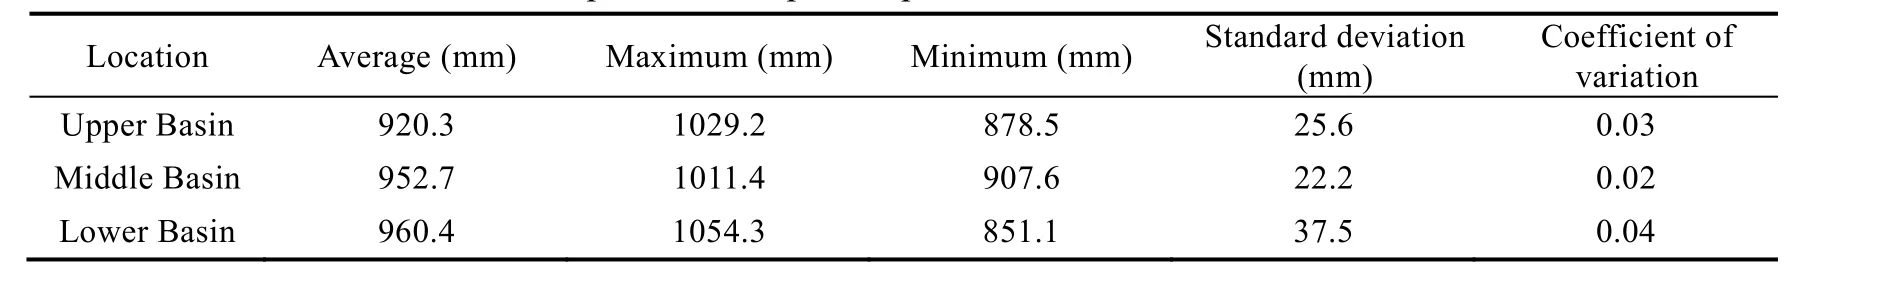
Table 2 Characteristic values of potential evapotranspiration in the Yellow River Basin from 1960 to 2020
3.1.3 Trend test for runoff
The annual runoff trend for the six hydrological stations in the main stream of the Yellow River is shown in Figure 4, demonstrating that the fluctuation of inter-annual changes of the six hydrological stations is basically similar, i.e., all of them exhibit a decreasing trend of change.The calculated results showed that the MK test statistics of Lanzhou Station and Toudaoguai Station wereZMK= -1.92 and -1.81 (|ZMK|<Z(0.05)=1.96), respectively, all of which failed to pass the significance level (95%) test, indicating that the runoff decline trends at Lanzhou Station and Toudaoguai Station were deemed insignificant.The MK test statistics of Longmen Station,Xiaolangdi Station, Huayuankou Station, and Lijin Station wereZMK= -2.12, -3.22, -4.43, and-5.51 (|ZMK|>Z(0.05/2)=1.96), respectively, and all passed the significance level (95%) test,indicating that the runoff at Longmen Station, Xiaolangdi Station, Huayuankou Station, and Lijin Station had significant downwards trends.As per the change results, the trend of decreasing annual runoff from upstream to downstream is becoming more and more significant.

Fig.4 Inter-annual variation trend of runoff at the six stations in the Yellow River Basin from 1960 to 2020.(a), Lanzhou Station; (b), Toudaoguai Station; (c), Longmen Station; (d), Xiaolangdi Station; (e), Huayuankou Station; (f), Lijin Station.The yellow line represents the value of runoff; the red line represents the change trend of runoff; the shadow represents the 95% confidence interval.
The runoff volumes from 1960 to 2020 at the six hydrological stations in the main stream of the Yellow River Basin are shown in Table 3.The average annual runoff volumes at Lanzhou Station, Xiaolangdi Station, Huayuankou Station, and Lijin Station were 315.9×10⁸, 350.9×108,322.2×108, and 264.4×10⁸m3, respectively, and the maximum annual runoff occurred in 1964.The average annual runoff volumes of Toudaoguai Station and Longmen Station were 211.3×10⁸and 252.7×10⁸m3, respectively, and the maximum annual runoff was noted in 1967.Among them, Lijin Station, as the downstream outlet of the main stream, was found to have the largest coefficient of variation, reaching 0.70.The fluctuation in Yellow River runoff volume reflects the non-uniform regional and temporal distribution of runoff volume in the Yellow River Basin.
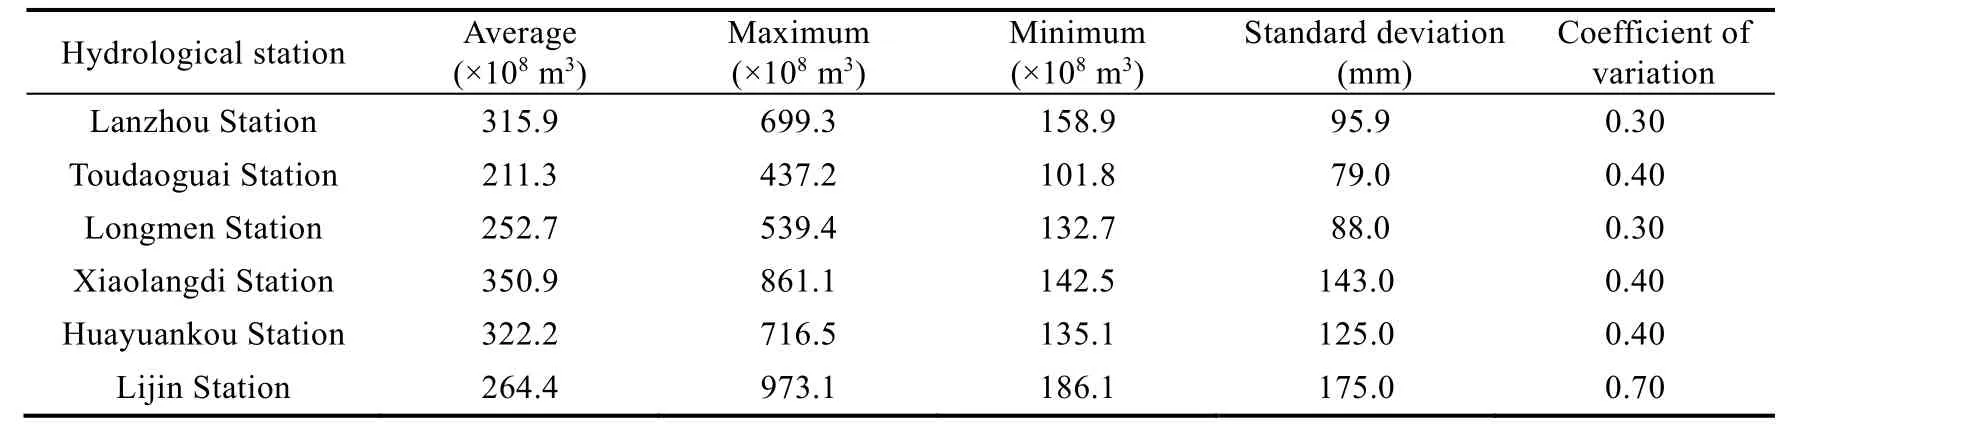
Table 3 Characteristic values of runoff at the six stations in the Yellow River Basin from 1960 to 2020
3.2 Tests for mutability of runoff
According to MK test results (Fig.5), theUF(test statistic) andUB(the reverse sequence of test statistic) intersection points of the six hydrographic stations of Lanzhou Station,Toudaoguai Station, Longmen Station, Xiaolangdi Station, Huayuankou Station, and Lijin Station were in 1984, 1985, 1987/1989, 1984, 1986, and 1985, respectively.Under the significance level of 0.05, the statistics |ZMK| are 3.29, 3.93, 4.93, 5.34, 5.41, and 6.07(|ZMK|>1.96), respectively, indicating that they passed the 95% significance test.
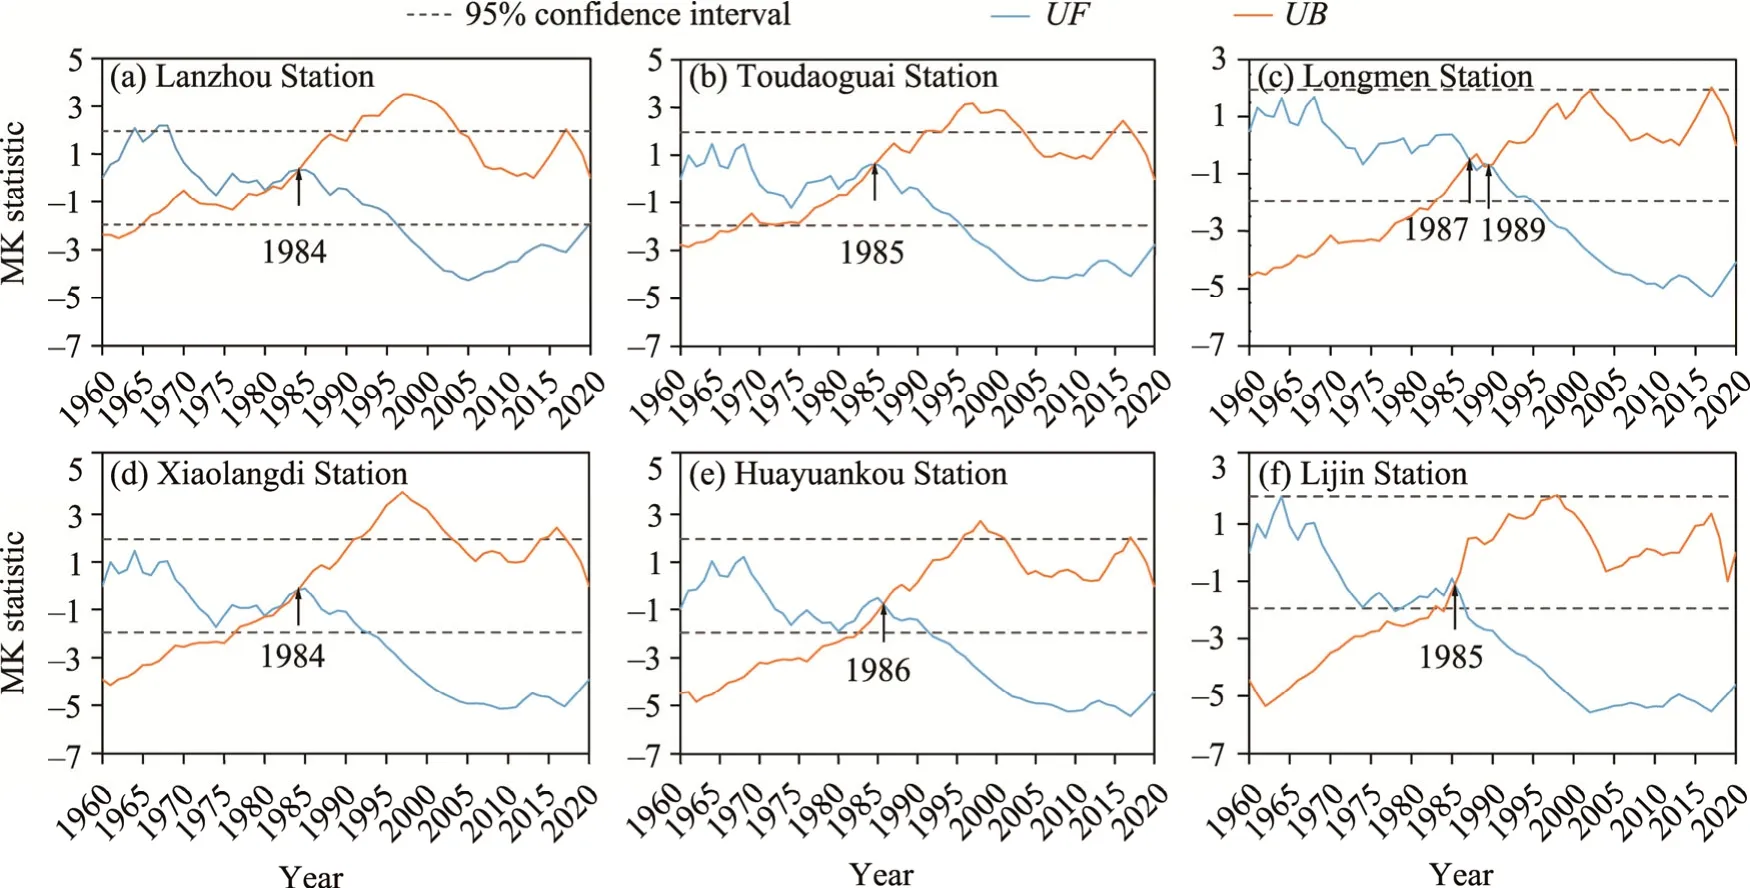
Fig.5 Results of Mann-Kendall (MK) mutation test at the six stations in the Yellow River Basin during 1960-2020.(a), Lanzhou Station; (b), Taodaoguai Station; (c), Longmen Station; (d), Xiaolangdi Station; (e),Huayuankou Station; (f), Lijin Station.UF represents test statistic; UB represents the reverse sequence of test statistic.
According to the Pettitt mutation test results (Fig.6), the mutation years of the six hydrographic stations of Lanzhou Station, Toudaoguai Station, Longmen Station, Xiaolangdi Station, Huayuankou Station, and Lijin Station were 1984, 1985, 1987, 1984, 1986, and 1985,respectively and the significance levels were 0.03, 0.04, 0.02, 0.03, 0.03, and 0.02, respectively(all less than 0.05), indicating that there is an obvious mutation in the runoff of the Yellow River during 1960-2020.
The year of the sudden shift in annual average runoff can be calculated more precisely by combining the two approaches of MK test and Pettitt test (Table 4).Finally, the mutation years(i.e., the years that occurred abrupt changes in the annual average runoff) of the hydrological stations of Lanzhou Station, Toudaoguai Station, Longmen Station, Xiaolangdi Station,Huayuankou Station, and Lijin Station were finally determined to be 1984, 1985, 1987, 1984,1986, and 1985, respectively, and it is obvious that these abrupt changes all occurred around 1985.
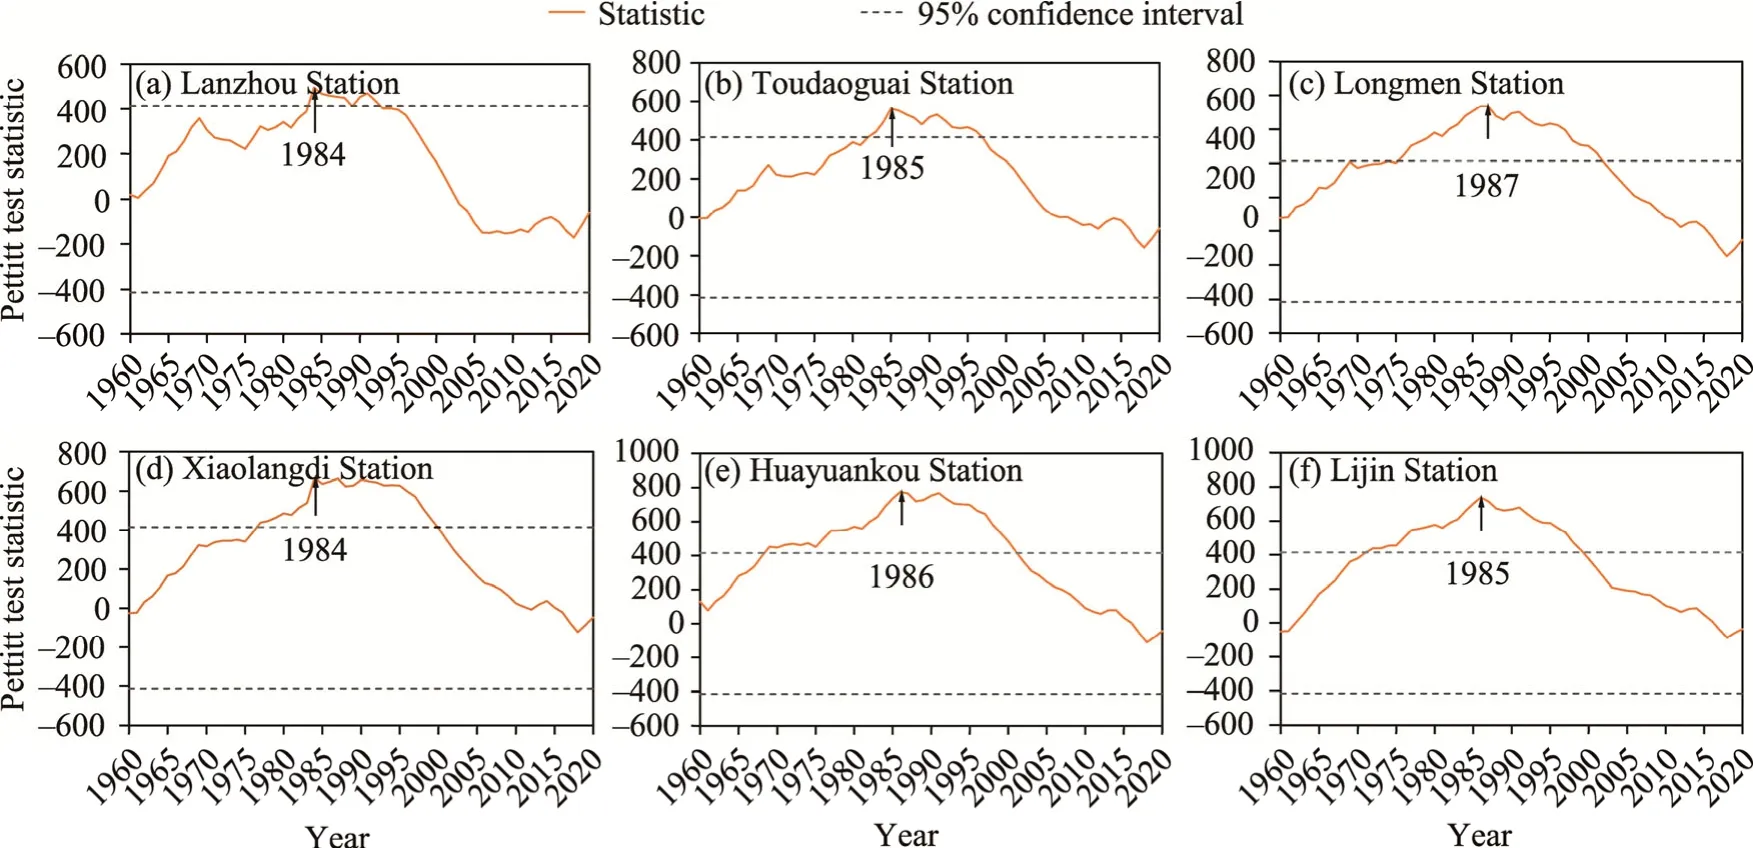
Fig.6 Results of Pettitt mutation test at the six stations in the Yellow River Basin during 1960-2020.(a),Lanzhou Station; (b), Taodaoguai Station; (c), Longmen Station; (d), Xiaolangdi Station; (e), Huayuankou Station; (f), Lijin Station.

Table 4 Annual average runoff mutation year in the Yellow River Basin during 1960-2020
3.3 Analysis of hydrological variability
In this study, the IHA-RVA method was used to quantitatively assess the degree of change in runoff, and the change results of 32 hydrological indicators at the 6 hydrological stations in the Yellow River Basin were obtained (Fig.7).The minimum flow of Lanzhou Station on 90 d was discovered to have the highest degree of change (83.00%), and the average monthly flow changes were generally small, belonging to the low degree of change.Moreover, Toudaoguai Station was found to have the highest degree of change in the annual minimum flow time(80.00%) and the lowest degree of change in average flow was found in June (3.00%).The average flow rate of Longmen Station in April changed the most (100.00%), while the duration of high-flow pulses changed the least (2.00%).The average flow and the number of reversals at Xiaolangdi Station were observed to change most in October (100.00%), while the average flow and 1-d minimum flow changed least in February (3.00%).At Huayuankou Station, the average increase or decrease rate of traffic underwent the most change (92.00%), and the average flow rate changed the least (8.00%) in June.At Lijin Station, the average increase or decrease rate of traffic had the largest change degree (93.00%), and the 3-d minimum flow rate of this station had the smallest change degree (6.00%).

Fig.7 Change degree of the hydrological indicators of the Range of Variability Approach (RVA) at the six stations in the Yellow River Basin from 1960 to 2020.January-December represent the average flow of January-December; 1-d minimum flow-90-d minimum flow represent the average annual 1-d minimum flow-90-d minimum flow; 1-d maximum flow-90-d maximum flow represent the average annual 1-d maximum flow-90-d maximum flow; base flow represents the ratio of base flow to total flow; date minimum represents the occurrence time of minimum flow; date maximum represents the occurrence time of maximum flow; low pulse count represents low flow pulse count; low pulse duration represents low flow pulse duration; high pulse count represents high flow pulse count; high pulse duration represents high flow pulse duration; increase rate represents the average annual increase rate of flow; decrease rate represents the average annual decrease rate of flow; reversal represents the times of flow reversal in one year.
The variations in each group of hydrological indicators for the six hydrological stations can be calculated using the Equations 17-19 (Table 5).The hydrological indicators in Group I(including the average flow of January-December) of Lanzhou Station and Toudaoguai Station lied at a low level, whereas the last four groups changed to a moderate level.The hydrological indicators in Group IV (including low pulse count, low pulse duration, high pulse count, and high pulse duration) of Toudaoguai Station was also at a low level, while the remaining groups were at a moderate level.The hydrological indicators in Group III (including date minimum and date maximum) of the Longmen Station was at a low level, while the other groups were at a moderate level.The first four sets of hydrological indicators (i.e., the hydrological indicators in Group I-IV, where the indicators in Group II include 1-d minimum flow, 3-d minimum flow, 7-d minimum flow , 30-d minimum flow, 90-d minimum flow, 1-d maximum flow, 3-d maximum flow, 7-d maximum flow, 30-d maximum flow, 90-d maximum flow, and the ratio of base flow to total flow) of Xiaolangdi Station, Huayuankou Station, and Lijin Station were altered mildly,whereas the hydrological indicators of Group V (including increase rate, decrease rate, and reversal times) changed significantly.Although the overall hydrological indicators of the six hydrological stations were moderately changed, the degree of change was found to increase from upper to lower reaches, indicating that the ecosystem of the Yellow River Basin's middle and lower reaches is at a higher risk of damage.
The changes in hydrological indicators will inevitably lead to a change in hydrological regime, in which the change in runoff will affect the natural hydrological process of river, thus resulting in some adverse effects on the reproduction of aquatic organisms (Guo et al., 2022).Changes in the annual extreme flow rate will cause some aquatic organisms to be unable to adapt to the current flow change rate, resulting in a decline in biodiversity.Moreover, changes in the high and low pulse duration can lead to changes in the ecological structure of river; this will affect not only aquatic organisms but also the soil water content on both sides of the river,leading to changes in vegetation cover.Changes in flow and frequency can also impact the rise and fall of a river, which, in turn, affects the distribution of aquatic communities.Although natural habitats can withstand disturbance from external events to a certain extent, if the disturbance exceeds the tolerance of the habitat itself, the extent of the damage will be very difficult to recover.

Table 5 Change degree of hydrological indicator group at the six stations in the Yellow River Basin from 1960 to 2020
3.4 Ecological response analysis
Indeed, change in hydrological regime will bring about many impacts on river ecology.Therefore, aiming at the ecological response process of the Yellow River Basin under a change in hydrological regime, this study further examined the biodiversity index of flow of the six hydrological stations.The inter-annual changes in biodiversity in the Yellow River Basin from 1960 to 2020 are summarised in Figure 8.The biodiversity index of flow of the Yellow River's main stream at Toudaoguai Station, Longmen Station, Huayuankou Station, and Lijin Station all declined with different degrees.The standardised test statistics(Zmk) of Lanzhou Station,Xiaolangdi Station, Huayuankou Station, and Lijin Station were 0.09, -1.16, -1.26, and -1.41(|ZMK|<1.96), respectively, indicating that the biodiversity index of the flow at the four stations increased from 1960 to 2020, but the rising trend was deemed insignificant.The standardised test statistics (ZMK) of Toudaoguai Station and Longmen Station were -3.62 and -4.75(|ZMK|>1.96), respectively, indicating a significant decline in biodiversity.
In summary, the biodiversity index of the middle and lower reaches of the Yellow River Basin was determined to be generally low in the post-mutation period.Toudaoguai Station,Longmen Station, and Xiaolangdi Station were close to the Qingtongxia Hydropower Station,Tianqiao Reservoir, and Sanmenxia Hydropower Station.Human activities had a greater impact
on the biodiversity index, resulting in a more significant decline trend of biodiversity index.Lanzhou Station and Lijin Station are relatively far from these hubs; thus, because of their own regulating effects, the ecological environment near these two stations was less affected.It can be seen that the construction and use of reservoirs significantly changed the amount of local runoff and indirectly had an adverse impact on local biodiversity.
3.5 Attribution analysis of runoff changes based on Budyko theory
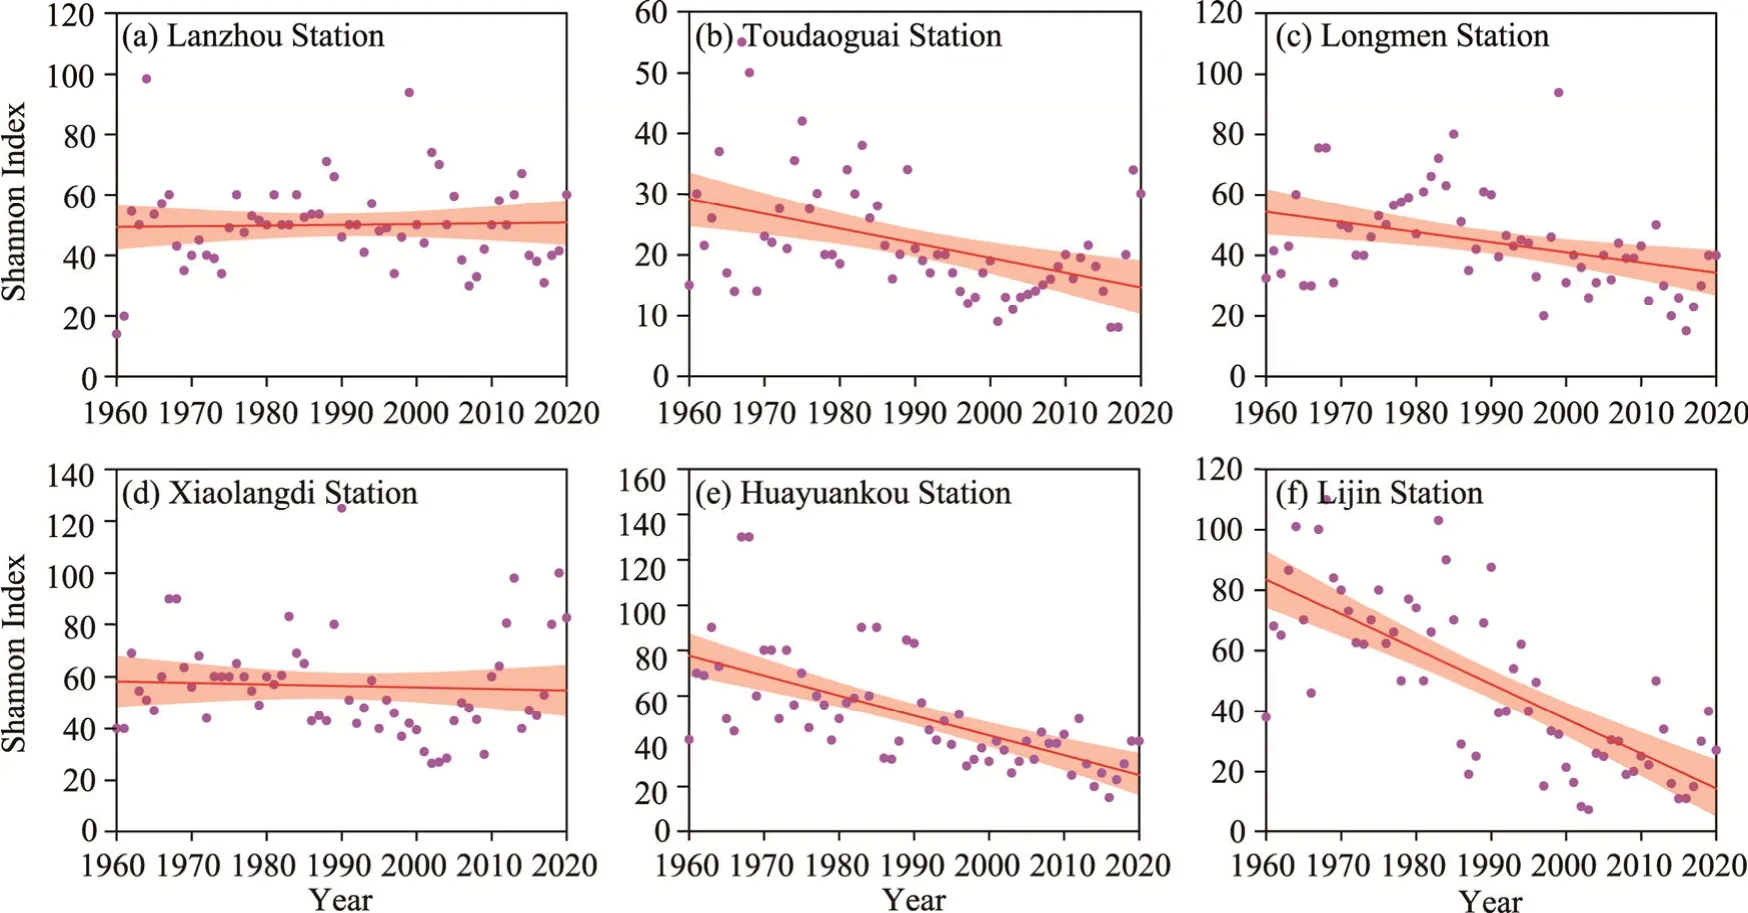
Fig.8 Inter-annual variation of biodiversity index (Shannon Index) of flow at the six stations in the Yellow River Basin from 1960 to 2020.(a), Lanzhou Station; (b), Toudaoguai Station; (c), Longmen Station; (d),Xiaolangdi Station; (e), Huayuankou Station; (f), Lijin Station.The dot represents the Shannon Index; the red line represents the change trend of the Shannon Index; the shadow represents the 95% confidence interval.
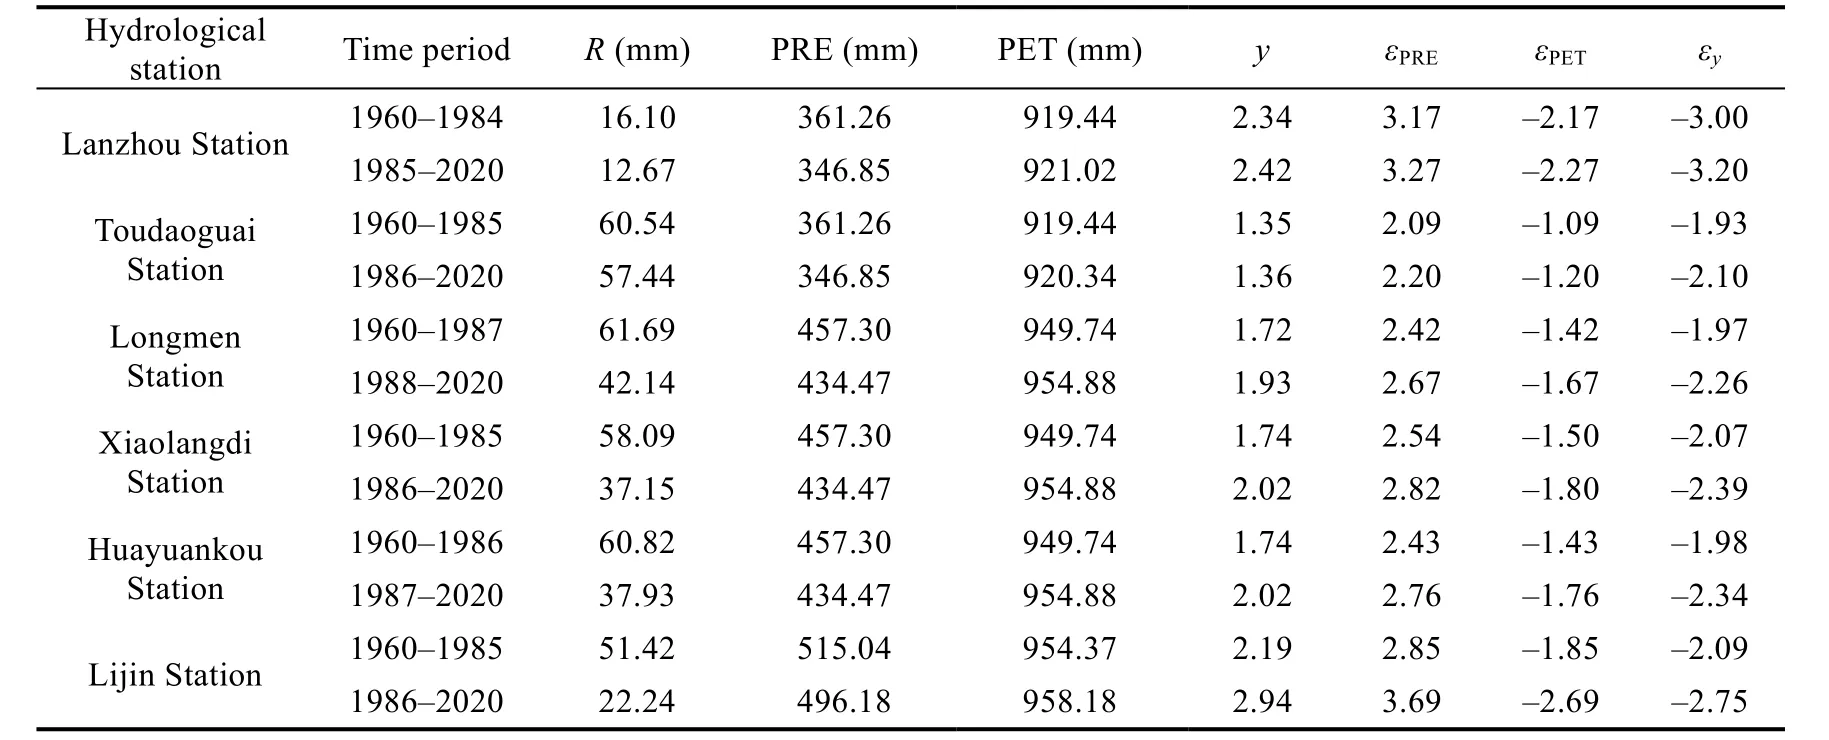
Table 6 Hydrometeorological characteristics of the six stations in the Yellow River Basin from 1960 to 2020
The hydrometeorological characteristics and elasticity coefficients of the six hydrological stations in the Yellow River Basin for the reference period and the mutation period are shown in Table 6.The precipitation and annual runoff depth of Lanzhou Station, Toudaoguai Station,Longmen Station, Xiaolangdi Station, Huayuankou Station, and Lijin Station during the mutation period were reduced as compared with those of the reference period.Furthermore, the potential evapotranspiration increased as compared with that of the reference period.The elasticity coefficients of the influencing factors of runoff in mutation period showed that when average precipitation, potential evapotranspiration, and underlying surface increased by 1.00%, the runoff at Lanzhou Station increased by 3.27%, decreased by 2.17%, and decreased by 3.00%,respectively; the runoff at Toudaoguai Station has also increased by 2.20%, decreased by 1.20%, and decreased by 2.10%, respectively; the runoff at Longmen Station increased by 2.67%, decreased by 1.67%, and decreased by 2.26%, respectively; the runoff at Xiaolangdi Station increased by 2.82%, decreased by 1.80%, and decreased by 2.39%, respectively; the runoff at Huayuankou Station increased by 2.76%, decreased by 1.76%, and decreased by 2.34%; and the runoff at Lijin Station increased by 3.69%, decreased by 2.69%, and decreased by 2.75%, respectively.Runoff changes at the six hydrological stations in the main stream of the Yellow River were also found to be inversely correlated with the changes in potential evapotranspiration and underlying surface, but favourably correlated with precipitation.The absolute value of the elasticity coefficient reflects the degree of sensitivity of runoff to each influencing factor, such that runoff changes at the six hydrological stations in the main stream of the Yellow River Basin are most sensitive to precipitation parameter, second most sensitive to underlying surface parameter, and least sensitive to potential evapotranspiration.
During the base period (1960-1985), the six hydrological stations showed positive correlations between runoff changes and precipitation, and the Toudaoguai Station, Longmen Station, Xiaolangdi Station, and Lijin Station passed the 0.01 significance level test.In determining the relationship of runoff changes with potential evapotranspiration and temperature, Lanzhou Station, Longmen Station, and Xiaolangdi Station all exhibited negative correlations, while Toudaoguai Station showed positive correlations.
The calculation results of the contribution rates of each influencing factor to runoff changes in the Yellow River Basin are summarised in Table 7.During the mutation period (1986-2020),the six hydrological stations showed a positive correlation between runoff changes and precipitation, with Lanzhou Station and Xiaolangdi Station passing the 0.01 significance level test, and Toudaoguai Station and Lijin Station passing the 0.05 significance level test.In determining the relationship of runoff changes with potential evapotranspiration and temperature, Lanzhou Station, Toudaoguai Station, Longmen Station, and Xiaolangdi Station all showed a negative correlation.Huayuankou Station and Lijin Station were found to be negatively correlated with potential evapotranspiration and positively correlated with air temperature.
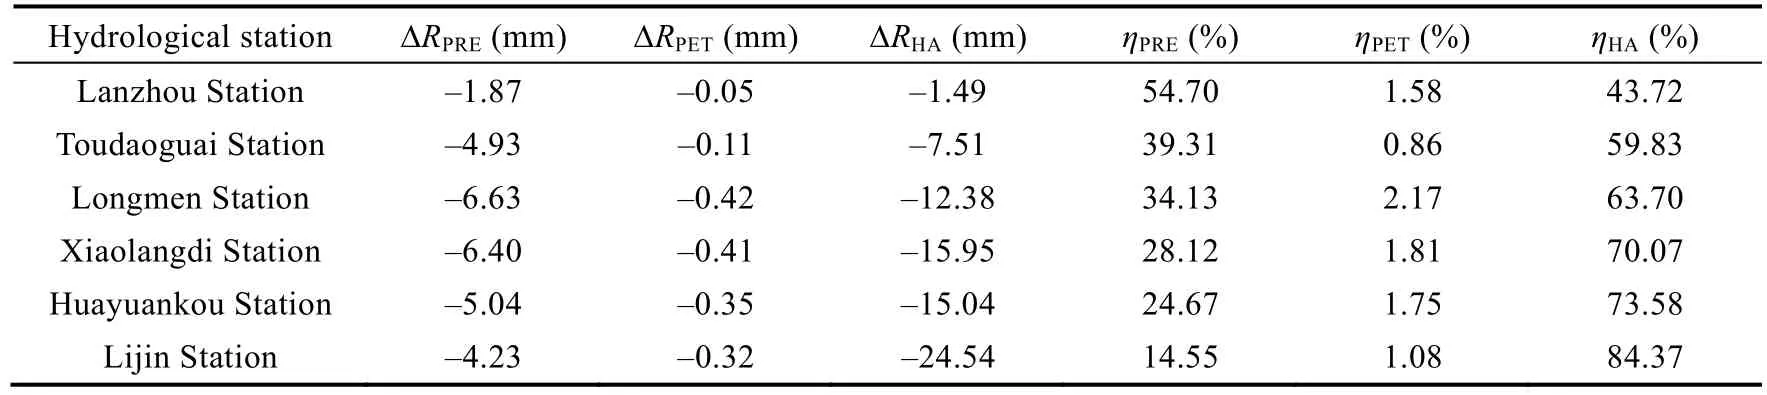
Table 7 Attribution analysis of runoff changes in the Yellow River Basin from 1960 to 2020
Changes in runoff due to precipitation and potential evapotranspiration have been attributed to climate change, while the impact of human activities has been correlated to changes in the underlying surface.The contribution of precipitation to runoff changes in the Yellow River Basin decreased gradually from upstream to downstream, reaching a maximum of 54.70% at the upstream Lanzhou Station and a minimum of 14.55% at the downstream Lijin Station,indicating that the influence of precipitation on runoff changes gradually decreased from upstream to downstream.The contribution of potential evapotranspiration to runoff changes from upstream to downstream showed an initial increasing and then decreasing trend, with the highest contribution of 2.17% at the midstream Longmen Station and the lowest contribution of 0.86% at the upstream Toudaoguai Station, implying that the influence of potential evapotranspiration on runoff was not very large.The decrease of precipitation and the increase of potential evapotranspiration in the watershed may jointly lead to the decrease of runoff.The contribution rate of underlying surface to runoff changes gradually increased from upstream to downstream, with the lowest contribution rate of 43.72% at the upstream Lanzhou Station and the highest contribution rate of 84.37% at the downstream Lijin Station.The change in the underlying surface was becoming the dominant factor of runoff changes in recent years.For the Yellow River Basin, human activities have been identified as the main cause of runoff changes in the middle and lower reaches, while precipitation change was the main cause of runoff changes in the upper reaches.Changes in potential evapotranspiration had a relatively low degree of influence on runoff changes.
4 Discussion
There are several variables (including climate change and human activities) that might impact river runoff.Investigating the causes of the shift in the Yellow River hydrology has revealed that the building of reservoirs and hydropower plants in the Yellow River Basin before the sudden transition was limited and sluggish due to the majority being small- and medium-sized reservoirs.Many water conservation projects have been implemented in the Yellow River Basin since 1980, including the Bapanxia Hydropower Station, the Liujiaxia Hydropower Station, the Xiaolangdi Water Conservancy Project, the Wanjiazhai Water Conservancy Hub, and the Sanmenxia Water Conservancy Project.As a result, the average storage capacity far exceeded the sum of previous periods, and this has resulted in a series operation mode of reservoirs and power stations and significant changes in the hydrological sequence of hydrology stations in the Yellow River Basin, bringing about abrupt changes in the basin's annual discharge.Many researchers and scholars have analysed the runoff changes of the Yellow River.Zhang et al.(2023) showed that after the operation of Xiaolangdi Reservoir, the intra-annual runoff variations flattened out and the monthly runoff cycle was significantly reduced.Shao et al.(2023) stated that the Shiyang River Basin and its six upstream tributaries showed a decreasing trend from the 1950s to 2019, and most of them will continue to decrease until 2050.This is consistent with the analysis results of the Yellow River runoff evolution pattern in this study.Moreover, for the analysis of the attribution to the runoff changes of the Yellow River, the results of Huang et al.(2023) showed that the runoff of the Yellow River tributary—Kuye River Basin underwent an abrupt change in 1997, and the complex anthropogenic activities were the main reason for the drastic reduction of runoff.The results of Dai et al.(2023) also evidenced that the runoff of the nine sub-basins in the middle reaches of the Yellow River decreased significantly.Moreover, precipitation increased from the northwestern to the southeastern part of the Yellow River, and the anthropogenic activities contributed more to runoff than climate change, especially in the Huangfuchuan River and Kuye River basins.These findings are consistent with the results of this paper, which demonstrates that the changes in the runoff of the Yellow River are more influenced by human activities.
4.1 Climate change factor analysis
4.1.1 Impact of precipitation on runoff Precipitation is an important part in the basin's water cycle (Li et al., 2018).Thus, to investigate the influence of precipitation on runoff changes in the Yellow River Basin, a twofold accumulation curve of annual precipitation and runoff depth was developed (Fig.9).When the runoff is not impacted by human activities, the cumulative curve will be a straight line;however, when the runoff is affected by human activities, the cumulative curve will vary.The change slope of the double accumulation curve of annual precipitation and runoff depth at each station has been found to be greater than the change slope of the base period during the mutation period, indicating that the curve had a slight upwards shift after the abrupt change.The slope of the double accumulation curve of annual precipitation and runoff depth changed at all the six hydrological stations, with a larger change amplitude at Huayuankou Station and Lijin Station and a comparatively modest change amplitude at the other hydrological stations.Moreover,each hydrological station's cumulative precipitation and cumulative runoff depth were well matched, withR2greater than 0.99, thus identifying precipitation as one of the key influencing variables of runoff changes.
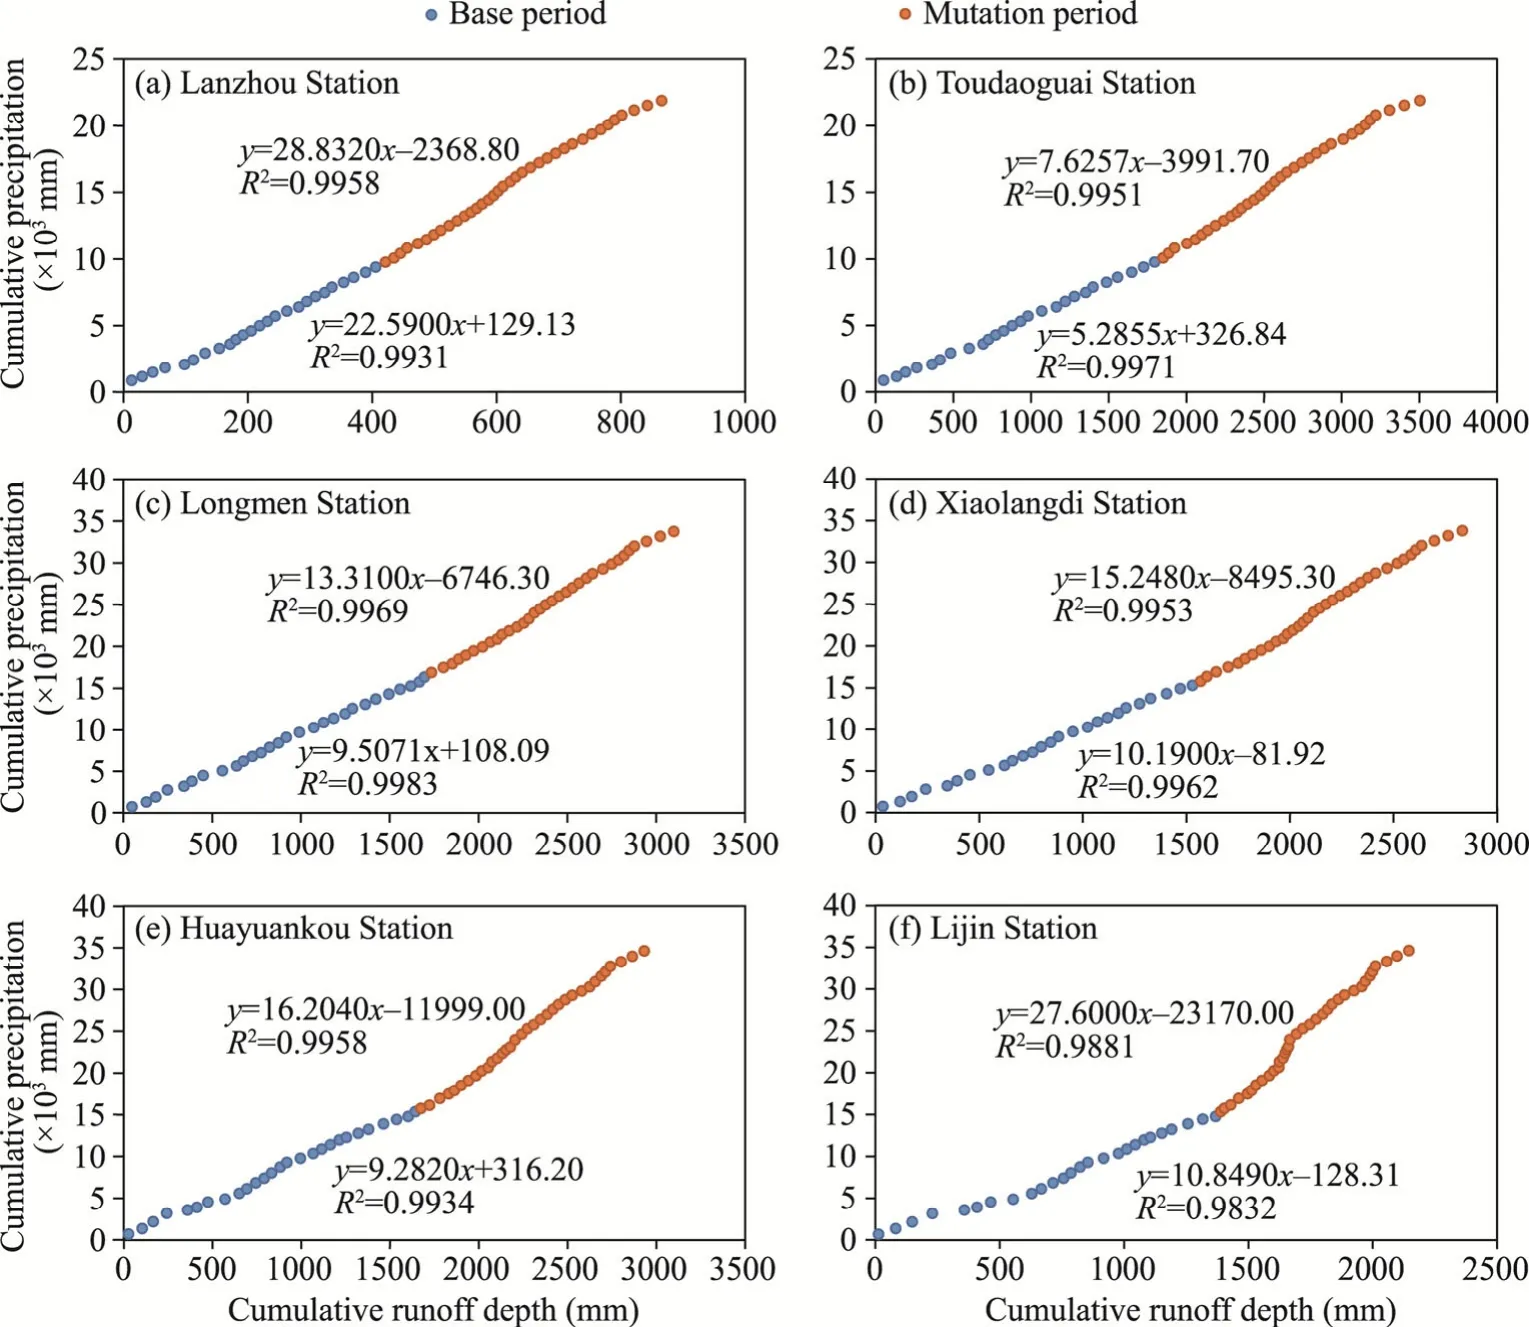
Fig.9 Twofold cumulative curve of annual precipitation-runoff depth at the six stations in the Yellow River.(a), Lanzhou Station; (b), Toudaoguai Station; (c), Longmen Station; (d), Xiaolangdi Station; (e), Huayuankou Station; (f), Lijin Station.
4.1.2 Impact of potential evapotranspiration on runoff
Among the climate change factors, runoff is not only affected by precipitation but also influenced by temperature, sunshine duration, etc.(Liu et al., 2022).In this study, we used three types of meteorological data (temperature, wind speed, and sunshine duration) to calculate potential evapotranspiration by Penman-Monteith formula.As a result, this study created a double accumulation curve of potential evapotranspiration and runoff depth (Fig.10) to examine the impact of potential evapotranspiration on runoff changes within the watershed.
The change slope of the double accumulation curve of annual potential evapotranspiration and runoff depth at each station in the mutation period was greater than the change slope of the base period, indicating that the curve has a slight upwards shift after the abrupt change.The slope of change of potential evapotranspiration was greater than that of precipitation.Each station's cumulative potential evapotranspiration matched well with the cumulative runoff depth,and it can be observed that theR2is larger than 0.99.Potential evapotranspiration is a significant factor that affects runoff changes, while climatic conditions such as temperature and sunshine duration also impact runoff changes.
4.1.3 Attribution analysis of the influence of climate factors on runoff changes
Precipitation, potential evapotranspiration, temperature, and other climatic factors all impact the change in the river's hydrological regime.Precipitation is both the principal source of flow production and the primary cause of fluctuations in flow production and confluence flow in the watershed.When precipitation from the atmosphere removes vegetation transpiration and natural evapotranspiration from the water surface, runoff is then formed.Climatic factors, such as air temperature, can have an indirect effect on runoff by affecting evapotranspiration, which could result in a shift in the hydrological regime.Three climatic factors in the Yellow River Basin were used for this study, namely, precipitation, potential evapotranspiration, and air temperature.Pearson correlation analysis was used to investigate the link between runoff changes and climatic factors in the base and mutation periods, whilet-test was used to assess the significance of the association.Figure 11 and Table 8 illustrate the findings of this analysis.
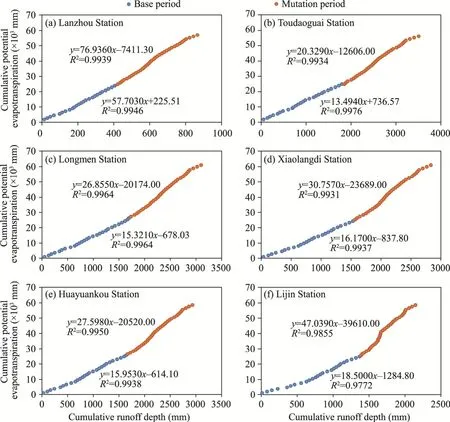
Fig.10 Twofold cumulative curve of annual potential evapotranspiration-runoff depth at the six stations in the Yellow River.(a), Lanzhou Station; (b), Toudaoguai Station; (c), Longmen Station; (d), Xiaolangdi Station; (e),Huayuankou Station; (f), Lijin Station.
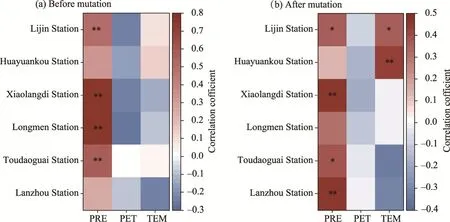
Fig.11 Correlation between climatic factors and runoff before (a) and after (b) abrupt change at the six stations in the Yellow River Basin.PRE, precipitation; PET, potential evapotranspiration; TEM, temperature.
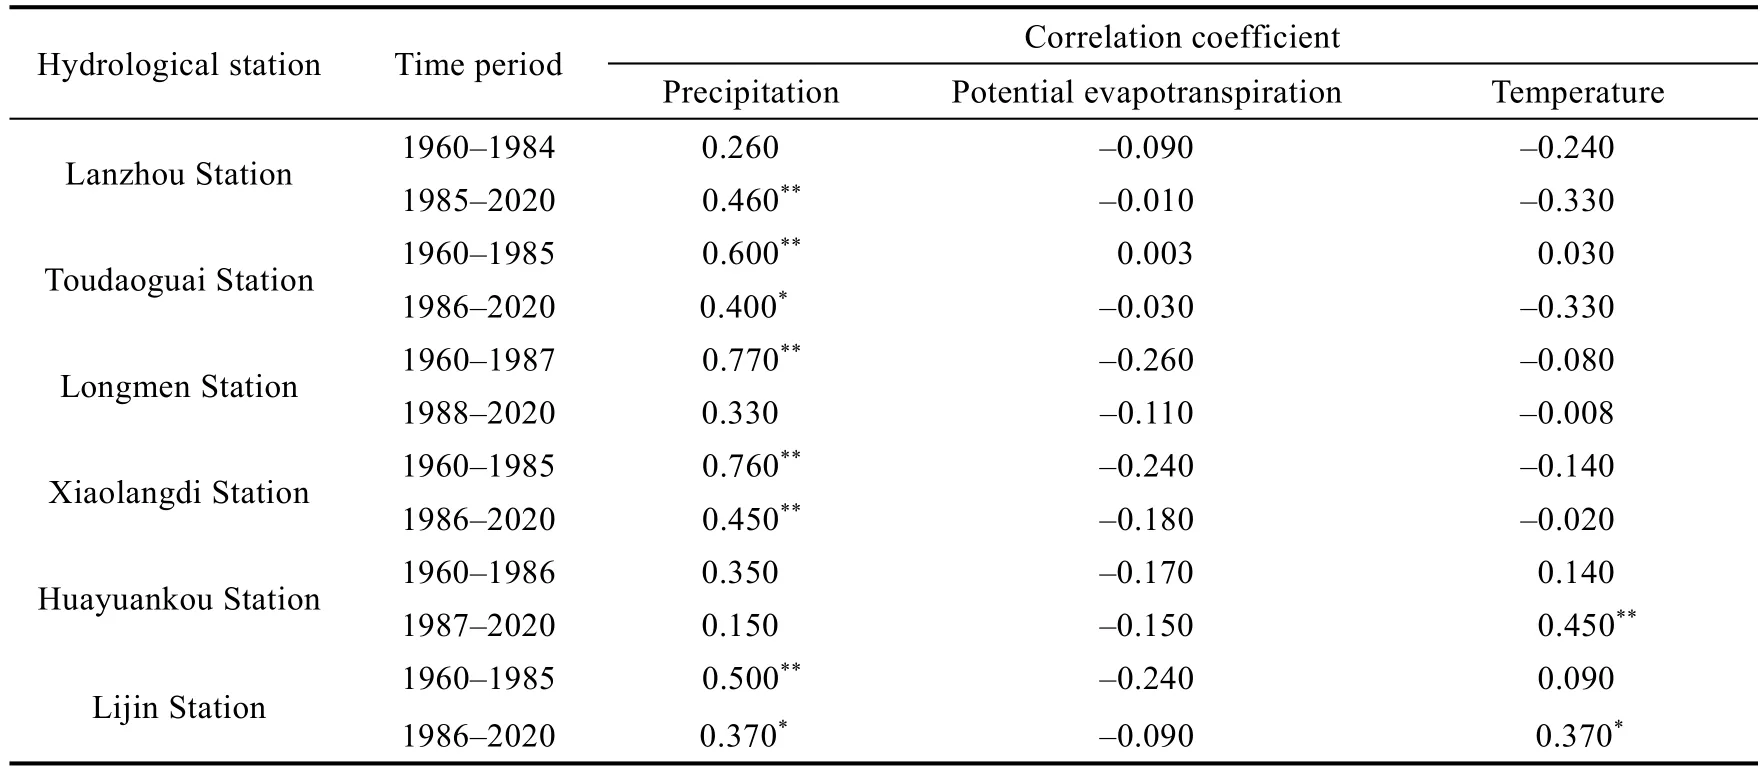
Table 8 Correlation coefficient between climatic factors and runoff at the six stations in the Yellow River Basin from 1960 to 2020
In the base and mutation periods, runoff was found to be inversely linked with potential evapotranspiration and air temperature but positively correlated with precipitation and passed the 0.01 significance threshold at Lanzhou Station during the mutation period.For Toudaoguai Station, a positive association was also noted between runoff and precipitation, potential evapotranspiration, and air temperature, and the correlation between runoff and precipitation was able to pass the 0.01 significance level in the base period; while during the mutation period,runoff was positively correlated with precipitation at the 0.05 significance level and inversely correlated with temperature and potential evapotranspiration.At Longmen Station, runoff was positively linked with precipitation in both the base and mutation periods, having a 0.01 significance level in the base period; while in both the base and mutation periods, runoff was negatively linked to potential evapotranspiration and air temperature.At Xiaolangdi Station,runoff was determined to be positively linked with precipitation during both the base and mutation periods, and both exceeded the significance level of 0.01; while the runoff during the base and mutation periods was inversely correlated with potential evapotranspiration and temperature.Runoff in the base period at Huayuankou Station was positively associated with precipitation and air temperature but negatively correlated with potential evapotranspiration;and during the mutation period, runoff was positively linked with air temperature, reaching the 0.01 significance level.The runoff both in the base and mutation periods was positively associated with precipitation and air temperature at Lijin Station and negatively associated with potential evapotranspiration.
Runoff was negatively correlated with potential evapotranspiration as a whole, and the correlation coefficient was smaller than those of precipitation and air temperature.The overall correlation between runoff and potential evapotranspiration was deemed insignificant, while the overall correlation with precipitation was significant.Moreover, the change in runoff caused by changes in potential evapotranspiration was much smaller than that caused by other climatic factors, suggesting that runoff is less sensitive to potential evapotranspiration and most sensitive to precipitation.
4.2 Analysis of human activities
4.2.1 Construction of water conservancy project
In recent decades, the construction of water conservation projects in the Yellow River Basin has profoundly changed the natural hydrological regime of the whole basin.At present, there are more than 20 large reservoirs in the upper basin, including Longyang Gorge and Liujiaxia Hydropower Station, with a total regulated storage capacity of approximately 23.8×10¹⁰m3.The reservoirs of Longkou and Wanjiazhai are located in the Yellow River's middle reaches, and the Guxian Water Conservancy Project is known to be a key control backbone project.In addition to water supply and electricity generation, it considers flood control, ecological environment,and other aspects.The reservoir's construction is critical for downstream flood management and water and sand transfer, and the Guxian Water Conservancy Project collaborates with the Wanjiazhai and Xiaolangdi reservoirs on water and sand transfer.These reservoirs are capable of successfully regulating floods, reducing catastrophic flood peaks in the middle reaches, and ensuring downstream water consumption.Sanmenxia, Xiaolangdi, and other water conservation projects are located in the lower reaches of the Yellow River, with Sanmenxia Reservoir being the first large-scale water conservation project along the Yellow River.It is responsible for flood control in the Yellow River's lower reaches, as it manages 89.00% of the Yellow River's water flow and 98.00% of the Yellow River's silt; thus, Sanmenxia Reservoir plays an important role in the entire Yellow River control project.The Xiaolangdi Reservoir also has a significant impact on runoff, water conservation, riparian vegetation cover, biodiversity, land use, and habitat quality in the lower Yellow River Basin (Wang and Wang, 2022).The development of reservoir groups in the Yellow River Basin has followed a series pattern, with the total reservoir capacity much exceeding that of the pre-mutation period.It has also significantly affected the natural hydrological regime of the Yellow River's main stream.The current distribution map of hydropower stations in the main stream of the Yellow River is shown in Figure 12.
4.2.2 Land use change
Many scientists, both local and international, have examined the changes in terms of hydrological processes in river basins caused by land use change.Most of the research findings indicate that changes in land use will affect the underlying surface and runoff confluence mechanism in the basin.Diverse land use types can have different effects on hydrological cycle process and evapotranspiration; in fact, changes in hydrological regime have been strongly tied to multiple land use types rather than a single land use type.
Chen et al.(2022) has examined the impact of land use change on runoff in Zhanghe Reservoir in the Yangtze River Basin of China from two perspectives: land use area and structure change.As per their findings, increasing forest area slightly increased runoff, while expanding human construction land increased the time frequency of extreme hydrology in Zhanghe Reservoir.Moreover, diverse reactions to runoff change under various land use scenarios were also demonstrated.The Variable Infiltration Capacity model was used to analyse the consequences of land use change and climate change on surface runoff, streamflow, and evapotranspiration in the Qingyi River Basin, China and the results showed that land use change increased both surface runoff and baseflow (Liu et al., 2013).As significant population and economic expansion in the Yellow River Basin in recent years have resulted in changes in vegetation cover (Fig.13), it is critical to address the changes in the ecohydrological condition caused by land use change.

Fig.12 Schematic diagram of reservoirs in the Yellow River Basin
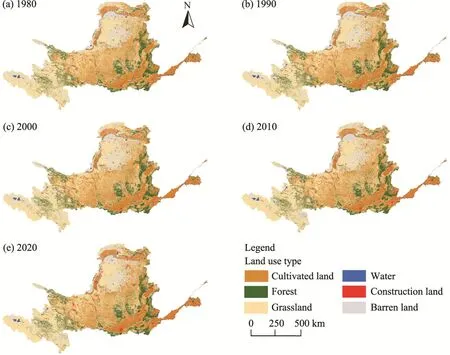
Fig.13 Spatial distribution of land use types in the Yellow River Basin in 1980 (a), 1990 (b), 2000 (c), 2010(d), and 2020 (e)
The areas of the main land use types in the Yellow River Basin in 1980, 1990, 2000, 2010,and 2020 are shown in Figure 14.The main land use types in the Yellow River Basin were cultivated land and grassland, with grassland accounting for 47.82%-48.41% of the region's total land area and cultivated land accounting for 25.40%-26.64% of the total.Moreover, the lowest proportions were occupied by water body and construction land.Between 1980 and 2020, the Yellow River Basin's land cover was altered dramatically.The area of land use types and the area change rate of the Yellow River Basin in different periods are shown in Table 9.The cultivated land area demonstrated an increasing trend from 1980 to 2000 (with an increase of approximately 3050.00 km2) and a decreasing trend from 2000 to 2020 (with a decrease of 11,720.00 km2), with an overall change rate of -0.90%.From 1980 to 2020, with the continuous development induced by industrialisation and urbanisation, the construction land area gradually increased with time and the increase was deemed more significant from 2000 to 2020, with an overall change rate of 1.66% and an increase area of approximately 14,540.00 km2.The water body area has also decreased to a certain extent, and the overall change rate of barren land was -1.37%, reducing approximately 12,320.00 km2.
The areas of the main land use types in the Yellow River Basin in 1980, 1990, 2000, 2010,and 2020 are shown in Figure 14.The main land use types in the Yellow River Basin were cultivated land and grassland, with grassland accounting for 47.82%-48.41% of the region's total land area and cultivated land accounting for 25.40%-26.64% of the total.Moreover, the lowest proportions were occupied by water body and construction land.Between 1980 and 2020, the Yellow River Basin's land cover was altered dramatically.The area of land use types and the area change rate of the Yellow River Basin in different periods are shown in Table 9.The cultivated land area demonstrated an increasing trend from 1980 to 2000 (with an increase of approximately 3050.00 km2) and a decreasing trend from 2000 to 2020 (with a decrease of 11,720.00 km2), with an overall change rate of -0.90%.From 1980 to 2020, with the continuous development induced by industrialisation and urbanisation, the construction land area gradually increased with time and the increase was deemed more significant from 2000 to 2020, with an overall change rate of 1.66% and an increase area of approximately 14,540.00 km2.The water body area has also decreased to a certain extent, and the overall change rate of barren land was -1.37%, reducing approximately 12,320.00 km2.
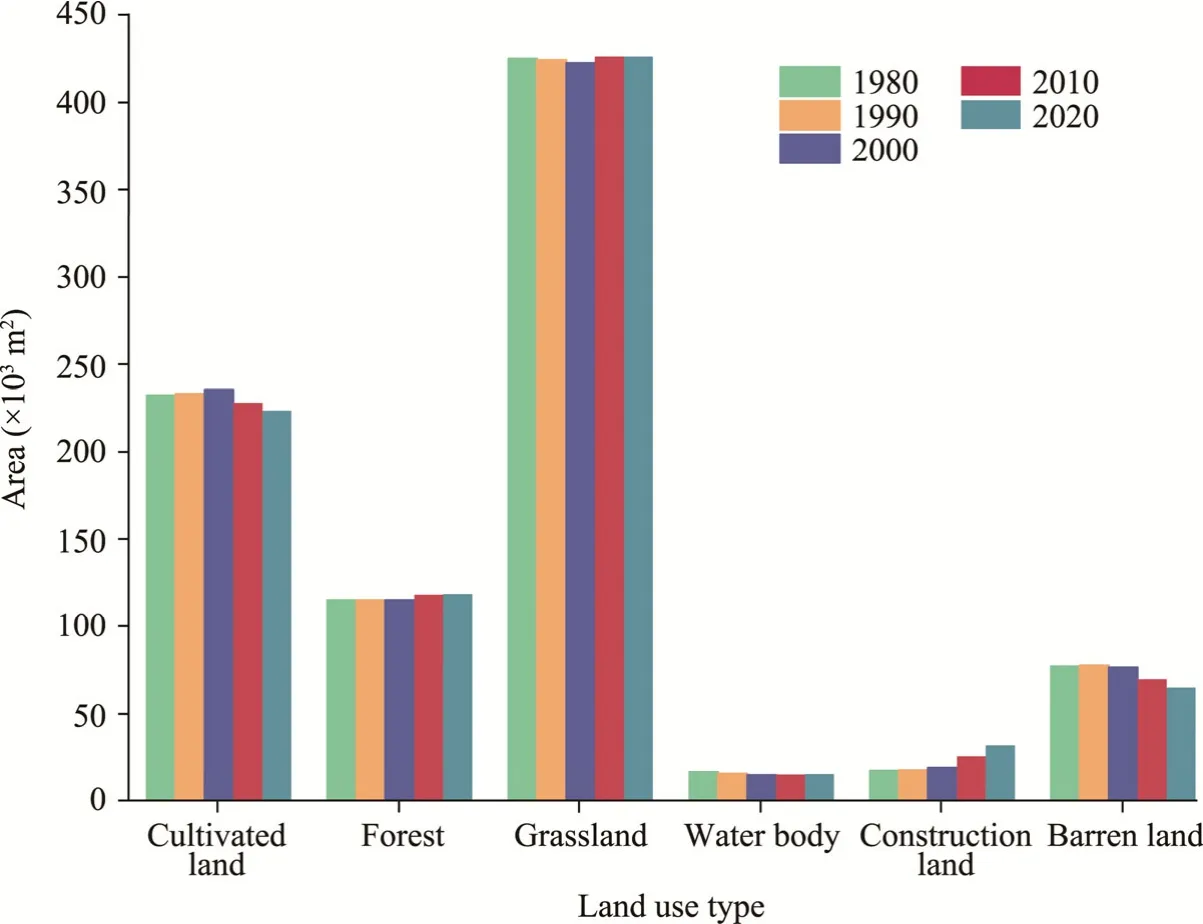
Fig.14 Area of different land use types in the Yellow River Basin in 1980, 1990, 2000, 2010, and 2020
Change in land use types can indirectly alter the flow process within a basin and thus have an impact on the ecological and hydrological situation within the basin.Moreover, it can be concluded that the change of land structure will also alter the underlying surface of basin,leading to the change of runoff generation and confluence mechanism in the basin, which will lead to the variation of ecological and hydrological conditions (Blöschl et al., 2007; Erol and Randhir, 2012).The change in land structure in the Yellow River Basin over the past 40 years is shown in Figure 15.Cultivated land and grassland are crucial sources of water, exhibiting the significant triumphs for the soil and water conservation projects in the Yellow River Basin and improving the phenomenon of lake reclamation in the lake basins' middle and lower reaches.As per the abovementioned research, land use change in the lower reaches of the Yellow River is a major driver of runoff changes, although its effect is smaller than that of water conservation project development.

Table 9 Area change of different land use types in the Yellow River Basin from 1980 to 2020
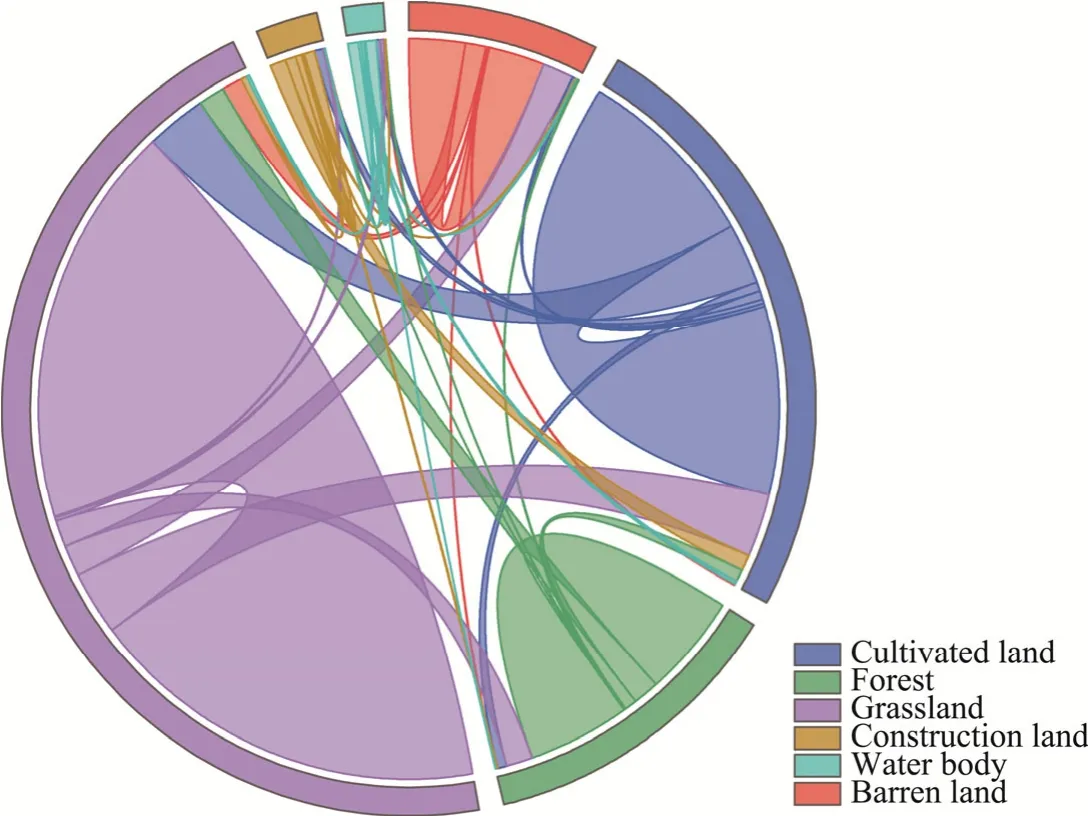
Fig.15 Land use transfer in the Yellow River Basin from 1980 to 2020.The line represents the conversion between two different land use types; the cusp represents the direction of land use transfer; the width of line represents the area of land use transfer.
5 Conclusions
The Yellow River, commonly referred to as the mother river of China, is a significant water supply source for north-west and north-central of China.However, as a result of climate change and increased human activities, the Yellow River's runoff has decreased recently, which in turn,resulted in negative impact on ecology.This study systematically analysed the changes in hydrological regime and the driving factors in the Yellow River Basin over the past 60 years and found that the years with abrupt changes in runoff were mainly concentrated in the mid-1980s.The degree of hydrological alteration of Lanzhou, Toudaoguai, Longmen, Xiaolangdi,Huayuankou, and Lijin stations was 34.00%, 35.00%, 37.00%, 45.00%, 51.00%, and 54.00%,respectively; all of them belong to moderate alteration.Moreover, the degree of hydrological alteration of the Yellow River Basin increased from the upstream to the downstream, indicating that ecological environmental protection and the health of the river downstream are facing serious challenges.The hydrological regime change has also caused a trend of decreasing biodiversity in the Yellow River Basin.Climate change and human activities led to the reduction of runoff in the Yellow River; the reduction of runoff in the upper reach has been primarily due to precipitation, with a contribution of 39.31%-54.70%, while the reduction of runoff in the middle and lower reaches was mainly due to the influence of human activities,with a contribution of 63.70%-84.37%.Over time, the influence of climatic factors on runoff changes gradually decreased, whereas the effect of human activities gradually became larger and more dominant.The link among human activities, climate change, and river biological responses is a long-term and complicated topic.Thus, future research should establish a hydrological model framework to distinguish the changes in watershed runoff caused by various types of human activities to comprehensively analyse the evolution of river hydrological system and better deal with the adverse effects of hydrological regime changes on ecosystem.
Conflict of interest
The authors declare that they have no known competing financial interests or personal relationships that could have appeared to influence the work reported in this paper.
AcknowledgementsThis research was supported by the Basic Research Project of Key Scientific Research Projects of Colleges and Universities of Henan Province, China (23ZX012).
Author contributionsConceptualization: WANG Baoliang; Data curation: WANG Baoliang; Formal analysis: WANG Baoliang, JIAO Xuyang, HUANG Lintong, CHEN Hao; Investigation: WANG Baoliang, WANG Hongxiang, JIAO Xuyang,HUANG Lintong, CHEN Hao; Methodology: WANG Baoliang, JIAO Xuyang, HUANG Lintong, CHEN Hao;Resources: WANG Baoliang, WANG Hongxiang; Software: WANG Baoliang; Validation: WANG Baoliang,JIAO Xuyang, HUANG Lintong, CHEN Hao; Visualization: WANG Baoliang, JIAO Xuyang, HUANG Lintong, CHEN Hao; Writing - original draft: WANG Baoliang; Writing - review and editing: WANG Baoliang;Funding acquisition: WANG Hongxiang, GUO Wenxian; Project administration: WANG Hongxiang, GUO Wenxian; Supervision: WANG Hongxiang.All authors approved the manuscript.
- Journal of Arid Land的其它文章
- Exploring groundwater quality in semi-arid areas of Algeria: Impacts on potable water supply and agricultural sustainability
- A CMIP6-based assessment of regional climate change in the Chinese Tianshan Mountains
- Influence of varied drought types on soil conservation service within the framework of climate change:insights from the Jinghe River Basin, China
- Land use and cover change and influencing factor analysis in the Shiyang River Basin, China
- Effects of landscape fragmentation of plantation forests on carbon storage in the Loess Plateau, China
- Effects of drip and flood irrigation on carbon dioxide exchange and crop growth in the maize ecosystem in the Hetao Irrigation District, China