
A CMIP6-based assessment of regional climate change in the Chinese Tianshan Mountains
2024-02-26 09:11LIUXinyuLIXuemeiZHANGZhengrongZHAOKaixinLILanhai
Journal of Arid Land 2024年2期
关键词:贫民
LIU Xinyu, LI Xuemei*, ZHANG Zhengrong, ZHAO Kaixin, LI Lanhai
1 Faculty of Geomatics, Lanzhou Jiaotong University, Lanzhou 730070, China;
2 National-Local Joint Engineering Research Center of Technologies and Applications for National Geographic State Monitoring, Lanzhou 730070, China;
3 Gansu Provincial Engineering Laboratory for National Geographic State Monitoring, Lanzhou 730070, China;
4 State Key Laboratory of Desert and Oasis Ecology, Xinjiang Institute of Ecology and Geography, Chinese Academy of Sciences, Urumqi 830011, China;
5 Research Center for Ecology and Environment of Central Asia, Chinese Academy of Sciences, Urumqi 830011, China
Abstract: Climate warming profoundly affects hydrological changes, agricultural production, and human society.Arid and semi-arid areas of China are currently displaying a marked trend of warming and wetting.The Chinese Tianshan Mountains (CTM) have a high climate sensitivity, rendering the region particularly vulnerable to the effects of climate warming.In this study, we used monthly average temperature and monthly precipitation data from the CN05.1 gridded dataset (1961-2014) and 24 global climate models(GCMs) of the Coupled Model Intercomparison Project Phase 6 (CMIP6) to assess the applicability of the CMIP6 GCMs in the CTM at the regional scale.Based on this, we conducted a systematic review of the interannual trends, dry-wet transitions (based on the standardized precipitation index (SPI)), and spatial distribution patterns of climate change in the CTM during 1961-2014.We further projected future temperature and precipitation changes over three terms (near-term (2021-2040), mid-term (2041-2060),and long-term (2081-2100)) relative to the historical period (1961-2014) under four shared socio-economic pathway (SSP) scenarios (i.e., SSP1-2.6, SSP2-4.5, SSP3-7.0, and SSP5-8.5).It was found that the CTM had experienced significant warming and wetting from 1961 to 2014, and will also experience warming in the future (2021-2100).Substantial warming in 1997 was captured by both the CN05.1 derived from interpolating meteorological station data and the multi-model ensemble (MME)from the CMIP6 GCMs.The MME simulation results indicated an apparent wetting in 2008, which occurred later than the wetting observed from the CN05.1 in 1989.The GCMs generally underestimated spring temperature and overestimated both winter temperature and spring precipitation in the CTM.Warming and wetting are more rapid in the northern part of the CTM.By the end of the 21st century, all the four SSP scenarios project warmer and wetter conditions in the CTM with multiple dry-wet transitions.However, the rise in precipitation fails to counterbalance the drought induced by escalating temperature in the future, so the nature of the drought in the CTM will not change at all.Additionally, the projected summer precipitation shows negative correlation with the radiative forcing.This study holds practical implications for the awareness of climate change and subsequent research in the CTM.Keywords: climate change; Coupled Model Intercomparison Project Phase 6 (CMIP6); global climate models(GCMs); shared socio-economic pathway (SSP) scenarios; standardized precipitation index (SPI); Chinese Tianshan Mountains
1 Introduction
Climate change reflects the equilibrium of natural systems (Ghil and Lucarini, 2020).Greenhouse gas-induced warming has become the dominant force in global warming since the mid-20thcentury (Tokarska et al., 2020).Human activities are responsible for increasing the amounts of atmospheric greenhouse gases (such as carbon dioxide), which are also a significant cause of runoff changes (Dey and Mishra, 2017; Sun et al., 2022b).The Sixth Assessment Report of the Intergovernmental Panel on Climate Change (IPCC) provides a systematic assessment and reasonable projection of the likely changes in several climate components and cycles (Zhou et al.,2021).Warming increases heat and water vapor in the atmosphere, accelerates the hydrological cycle, and increases the uneven distribution of water resources within regions (Shi et al., 2020;Zhang et al., 2021b).The rational perception and evaluation of regional climate change is the basis for determining its influence on regional ecology, production, living, etc.(Christensen et al.,2013).
The complexity of climate determines its temporal and spatial diversity (Jiang et al., 2016).Numerous studies have recognized and agreed on the occurrence of large-scale climate change in Northwest China, with unique regional characteristics from "warm and dry" to "warm and wet"(Shi et al., 2007; Wang and Qin, 2017; Wang et al., 2020; Li et al., 2022b; Chen et al., 2023).Global warming and high-intensity human activities not only intuitively lead to higher temperatures but also disrupt precipitation patterns, resulting in more obvious regional and seasonal diversities in precipitation (Luo et al., 2019).These changes have led to an increase in regional drought events and extreme weather occurrences, posing a significant threat to agricultural production and severely disrupting the ecological balance (Li et al., 2018; Jiang et al.,2022).For example, as the climate warms, the frequency and intensity of extreme precipitation are increasing at high altitudes (Xu et al., 2021).This phenomenon contributes to the retreat of glaciers, the reduction of available water resources, and the escalation of the disparity between water supply and demand (Yu et al., 2019; Javadinejad et al., 2020).Coupled with the detrimental impact of human activities, this has resulted in the soil degradation, salinization, desertification,and even the disturbances of the ecological equilibrium (Zheng and Wang, 2014; Li et al., 2018;Chen et al., 2019; Liu et al., 2020; Xu et al., 2021; Jiang et al., 2022; Yu et al., 2022).The warmer climate influenced by monsoons and atmospheric circulation has not only accelerated the rate of glacial ablation in most mountainous regions but also influenced the contribution of glaciers to stream discharge (Wang et al., 2011; Shen et al., 2020; Li et al., 2022b; Tang et al., 2022).The temperature and precipitation in the Chinese Tianshan Mountains (CTM) have unique spatiotemporal characteristics (Wang et al., 2011; Li et al., 2022b), understanding these is essential to determine the applicability of global climate models (GCMs) in this region.
The CN05.1 gridded dataset offers a valuable data source for regional climate analysis in China, and has been widely used in the analysis of conventional meteorological factors and extreme climate events (Yang et al., 2017a; Zhu et al., 2019; Ge et al., 2023).The GCMs in the Coupled Model Intercomparison Project Phase 6 (CMIP6) provide universally accepted models and frameworks that are applicable across multiple activities (Kim et al., 2020; Lei et al., 2023).To some extent, the CMIP6 has an optimized framework structure and physical parameters, with higher effective radiation intensity, higher resolution, greater climate sensitivity, and a more comprehensive range of warming response than the Coupled Model Intercomparison Project Phase 5 (CMIP5) (Zhou et al., 2021).Shared socio-economic pathways (SSPs), as the primary scenarios for Scenario Model Intercomparison Project (ScenarioMIP) activities in the CMIP6,are used to project future changes, which compensate for the lack of typical greenhouse gas concentrations in the CMIP5 (Arora et al., 2020; Chen et al., 2020).The CMIP6 provides significant assistance in the analysis and application of multiple climate factors (O'Neill et al.,2016; Zhu et al., 2021), and has improved the simulation capabilities for China compared to the CMIP5 (Jiang et al., 2020).
Current climate change research in China is predominantly concentrated in the northwest of the country (Yao et al., 2022; Yu et al., 2022; Aizizi et al., 2023), and detailed studies on long-term regional climate change in the CTM are therefore required.Given the challenges posed by global warming to the CTM, it is essential to conduct comprehensive analyses of temperature and precipitation changes in this region.This will help to clarify the actual impacts of temperature and precipitation changes on glaciers, vegetation, and other factors in the context of climate warming.It will also reveal the crucial relationships among temperature, precipitation, and the "warming and wetting" characteristics, all of which have implications for ecologically sustainable development, thereby providing a robust scientific foundation for government policymaking and scientific research.In this study, we assessed the applicability of the CMIP6 GCMs in the CTM based on the monthly average temperature and monthly precipitation data from the CN05.1 gridded dataset and the CMIP6 GCMs.We then analyzed the dry-wet transitions from 1961 to 2014, and projected the spatiotemporal variation characteristics of temperature and precipitation in the CTM in the future period (2021-2100) under four radiative forcing scenarios (SSP1-2.6,SSP2-4.5, SSP3-7.0, and SSP5-8.5).The results will have crucial implications for the conservation of glacial and snow resources, as well as for the regional sustainable development of the CTM.
2 Materials and methods
2.1 Study area
The CTM (39°03′N-45°23′N, 73°26′E-95°28′E) are located in the arid northwestern part of China and serve as a natural boundary between the northern and southern portions of Xinjiang Uygur Autonomous Region, Northwest China.The altitude of the study area varies greatly from-35 to 7129 m a.s.l., and the region features unique topographical characteristics and abundant glaciers (Fig.1).The region falls within the mesothermal zone and is characterized by a typical arid and semi-arid climate, making it highly susceptible to climate change (Yao et al., 2022;Aizizi et al., 2023).The CTM are in rich in mineral resources, and have complex lithospheric and geomorphologic characteristics (Charvet et al., 2011; Muhtar et al., 2022).The ecological environment is particularly sensitive to changes in temperature and precipitation.

Fig.1 Overview of the Chinese Tianshan Mountains (CTM) based on the digital elevation model (DEM)derived from the 90 m resolution Shuttle Radar Topography Mission (SRTM) dataset.The DEM data were downloaded from the Geospatial Data Cloud (http://www.gscloud.cn).
2.2 Data sources
2.2.1 CN05.1 gridded dataset
The available meteorological stations within the study area are sparsely distributed along the boundary, and could not therefore sufficiently reflect the spatial distribution of temperature and precipitation in the region.Therefore, the monthly average temperature and monthly precipitation data of the CN05.1 gridded dataset from 1961 to 2020 were used in this study.This dataset has a high spatial resolution and continuity in both time series and spatial distribution, which can compensate for the uneven distribution of meteorological stations to some extent.The CN05.1 gridded dataset was provided by the Climate Change Research Center, Chinese Academy of Sciences (https://ccrc.iap.ac.cn/resource/detail?id=228), which was constructed by calculating a gridded climatology and adding to the daily anomaly in the interpolation of station observations(approximately 2400 meteorological stations) in China (Xu et al., 2009; Wu and Gao, 2013).Its horizontal resolution is 0.25°×0.25°.Because the historical experiment for the simulations of the GCMs only lasted until 2014, the period 1961-2014 was selected as the historical period for comparison and analysis in this study.Evaluating the simulations of the GCMs in the historical period is essential to ensure their applicability in future projections.
2.2.2 CMIP6 GCMs
Table 1 shows the basic details of the 24 CMIP6 GCMs.The period of 1961-2014 was taken as the baseline period for the historical simulations.We compared the monthly average temperature and monthly precipitation data from the GCMs with those from the CN05.1 gridded dataset to analyze the regional applicability of the CMIP6 GCMs and regional temperature and precipitation changes.The period of 2021-2100 was selected as the future time scale to project the temperatureand precipitation variation characteristics in the CTM under different radiative forcing scenarios.Four scenarios were thus established, including the SSP1-2.6, SSP2-4.5, SSP3-7.0, and SSP5-8.5(O'Neill et al., 2016).Future social development possibilities were considered without climate impacts or policy disruptions (Jiang and O'Neill, 2017; Kc and Lutz, 2017).The SSP1-2.6 scenario is a low radiative forcing scenario, simulating a relatively encouraging sustainable development that keeps the warming target at 2.000°C.The SSP2-4.5 and SSP3-7.0 scenarios are medium radiative forcing scenarios; however, the SSP3-7.0 scenario accounts for more regional social change inequalities and land use changes than the SSP2-4.5 scenario.The SSP5-8.5 scenario is designed to address an integrated scientific problem and is part of a high radiative forcing scenario under energy-intensive development.It is the only pathway that will achieve the radiative forcing of 8.5 W/m2by 2100.

Table 1 Basic details of the 24 global climate models (GCMs) from the Coupled Model Intercomparison Project Phase 6 (CMIP6)
2.3 Methodology
2.3.1 Downscaling and bias correction of the GCMs
The spatial resolutions of data from the CN05.1 and the GCMs were divergent, and the spatial resolution varied among different GCMs.The low spatial resolution of the models may lead to problems such as insufficient information being collected.Therefore, the bias correction and spatial disaggregation (BCSD) method was used to preprocess the data from the GCMs (Wang and Chen, 2014).The spatial resolution of the GCMs was downscaled by resampling to match that of the CN05.1, which was unified at 0.250°×0.250°.The basis of the bias correction was to establish a transfer function between the observed (CN05.1 gridded dataset) and simulated (GCM outputs) data based on the historical period (1961-2014), and apply it to future projections.We upscaled the resolution of the observed data to that of the simulated data of the models, and constructed their functional relationships.Subsequently, we downscaled the simulated data to the resolution consistent with the observed data using climate state indices and interpolation factors.The equidistant cumulative distribution function (EDCDF) was used to map the distribution of the monthly data from the GCMs onto that of the observed data (Li et al., 2010):
wherex~m-pis the bias-corrected GCM output of each climate variable in the future period;xm-pis the original GCM output of each climate variable in the future period;Fo-cis the transfer function of the observed data in the historical period;Fm-pis the transfer function of the GCM outputs in the future period; andFm-cis the transfer function of the GCM outputs in the historical period.The baseline training period was 1961-2000.This functional relationship was assumed to be applied in the bias correction of the GCMs for the future period of 2021-2100 (Xu and Wang,2019).
2.3.2 Taylor diagram quantitative evaluation index
The Taylor diagram quantitative evaluation index was introduced to assess the advantages and disadvantages of single model simulations.This was mainly based on the calculation of the correlation coefficient and standard deviation between the simulated and observed data (Taylor,2001; Xiang et al., 2021).The calculations are as follows:
whereRis the correlation coefficient between the simulated and observed values;nis the number of grid cells;xiandyiare the observed and simulated values of theithgrid cell in the study area,respectively;xandyare the mean values of the observed and simulated values in the study area, respectively;σfis the ratio of the standard deviation of the simulated data (σy) to the standard deviation of the observed data (σx);Sis the Taylor diagram quantitative evaluation index; andR0is the maximum correlation coefficient of all GCMs.The closer theSvalue is to 1.0, the better the simulation capability of the GCM is.
2.3.3 Interannual variability skill score (IVS)
The IVS quantitatively measures the similarity degree between the observed and simulated values in terms of interannual variability (Scherrer, 2011; Yang et al., 2021).This index was calculated as follows:
The lower the IVS value is, the better the interannual variability simulation of the GCM is.
2.3.4 Mann-Kendall test The Mann-Kendall test is currently a non-parametric statistical test method widely used in the meteorological and hydrological studies for long-time series trends.The samples do not need to follow a certain distribution and are not disturbed by outliers (Kendall and Stuart, 1979).In the Mann-Kendall test, the trend value can be calculated as follows (Salehnia and Ahn, 2022):
whereStis the trend value at timet;lis the length of the series; andyjandykare thejthandkthdata points in the series, respectively.The variance ofStwas calculated as follows:
whereσ2is the variance ofSt;cis the number of data points;gis the number of tied groups in the dataset; andtpis the number of data points in thepthtied group in Equation 8.Introducing the normalized test statisticZand significance levelα, when |Z|≥Z1-α/2, there is a significant change trend.A positive or negative valueof the test statisticZdenotes an increasing or decreasing trend,respectively.If the absolute test statisticZvalue is higher than 2.32, the trend is significant attheP<0.01 level.If the absolute test statisticZvalue is higher than 1.64, the trend is significant attheP<0.05 level (Kim et al., 2018).
2.3.5 Standardized precipitation index (SPI)
The SPI is a generic drought indicator used to measure standardized precipitation anomalies and calculate multiple precipitation patterns for given time scales (WMO, 2006; Dogan et al., 2012;Zhang et al., 2014; Li et al., 2022a).It uses the cumulative probability function to define the gamma distribution:
The result was then transformed into a standardized normal distribution, enabling the calculation of cumulative precipitation at multiple time scales and the depiction of dry and wet conditions (Salehnia et al., 2017).To define the relationship between the amount and probability of precipitation, the 3, 6, 12, 24, and 60 months were taken as a set of typical average periods(McKee et al., 1993).In this study, we calculated the SPI at four time scales (3, 12, 24, and 60 months) to reflect the dry-wet transitions in the CTM.We defined the climatic moisture categories in the CTM based on the SPI by referring the National Climate Center Drought Scale (General Administration of Quality Supervision, Inspection and Quarantine of the People's Republic of China, 2017) (Table 2).
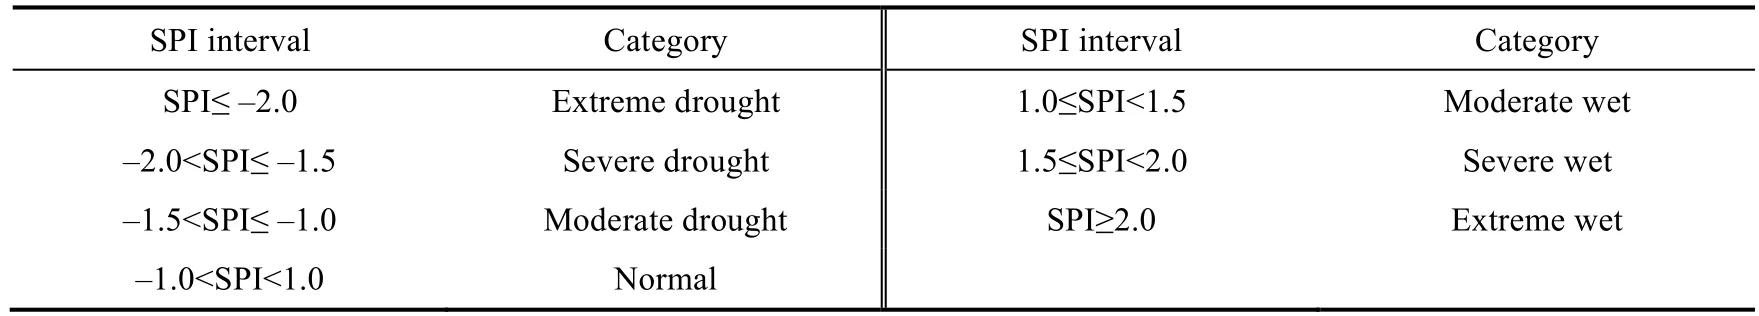
Table 2 Climatic moisture categories based on the standardized precipitation index (SPI)
2.3.6 Multi-model ensemble (MME)
Simulations by a single GCM may have some uncertainties in initial conditions, parameters, and structure.The MME assumes that the errors between the GCMs are independent of each other,which can be used to remove the errors to improve the uncertainty estimation (Tebaldi and Knutti,2007; Zarrin and Dadashi-Roudbari, 2021).We got the MME outputs based on Equation 12:
where MME(t,h) is the MME output of thehthgrid cell in the region at timet;Ma(t,h)presents the output of theathGCM of thehthgrid cell in the region at timet; anduis the total number of GCMs.The MME is widely used in projecting climate variables (Weigel et al., 2008; Kharin et al., 2013).
2.3.7 Cumulative departure (CD) method
The CD is a concept commonly used for the inter-decadal or seasonal analyses of climate variables, and the anomaly represents the offset between the value and the mean of a climate variable (Randall et al., 2007).This index is often used as a measure to assess the bias of the GCMs by transforming the climate variables into a series with a mean of zero through anomaly calculations.It is then possible to visualize and analyze how well simulations and corrections work.In this study, the observed values were assumed to have a mean of zero for the purpose of measuring the bias of the GCMs over different time series.The formula is as follows:
where CD(t,h) is the cumulative departure value of thehthgrid cell in the region at timet; and meanMa(t,h) and meanOa(t,h) are the mean simulated and observed CD values of theathGCM of thehthgrid cell in the region at timet,respectively.
3 Results
3.1 Capability of the CMIP6 GCMs in the CTM
Figure 2 shows the relationship of the correlation coefficients between monthly average temperature and monthly precipitation after bias correlation for the 24 GCMs and MME.Some variability existed among the GCMs due to the differences in their physical mechanisms.It should be noted that the GCMs mentioned below are bias-corrected models.Most GCMs simulated the monthly average temperature well, with correlation coefficients above 0.976, of which the correlation coefficients for three GCMs (ACCESS-ESM1-5, EC-Earth3, and CMCC-CM2-SR5)were greater than 0.980.The mean correlation coefficient of monthly precipitation from the GCMs was around 0.700, 0.2%-59.0% higher than that of observations from the CN05.1.For the 24 GCMs, the best simulations were from the ACCESS-CM2, INM-CM5-0, AWI-CM-1-1-MR, and EC-Earth3.The MME reduced the uncertainty of single GCM simulations, resulting in the simulated monthly average temperature and monthly precipitation values are close to the observed values.
按:《韵会》卷十二:“籞,说文禁苑也,……《后章纪注》:‘折竹以绳悬连之使人不得往来。’《前宣纪》:‘诏池籞本御幸者假与贫民。’”
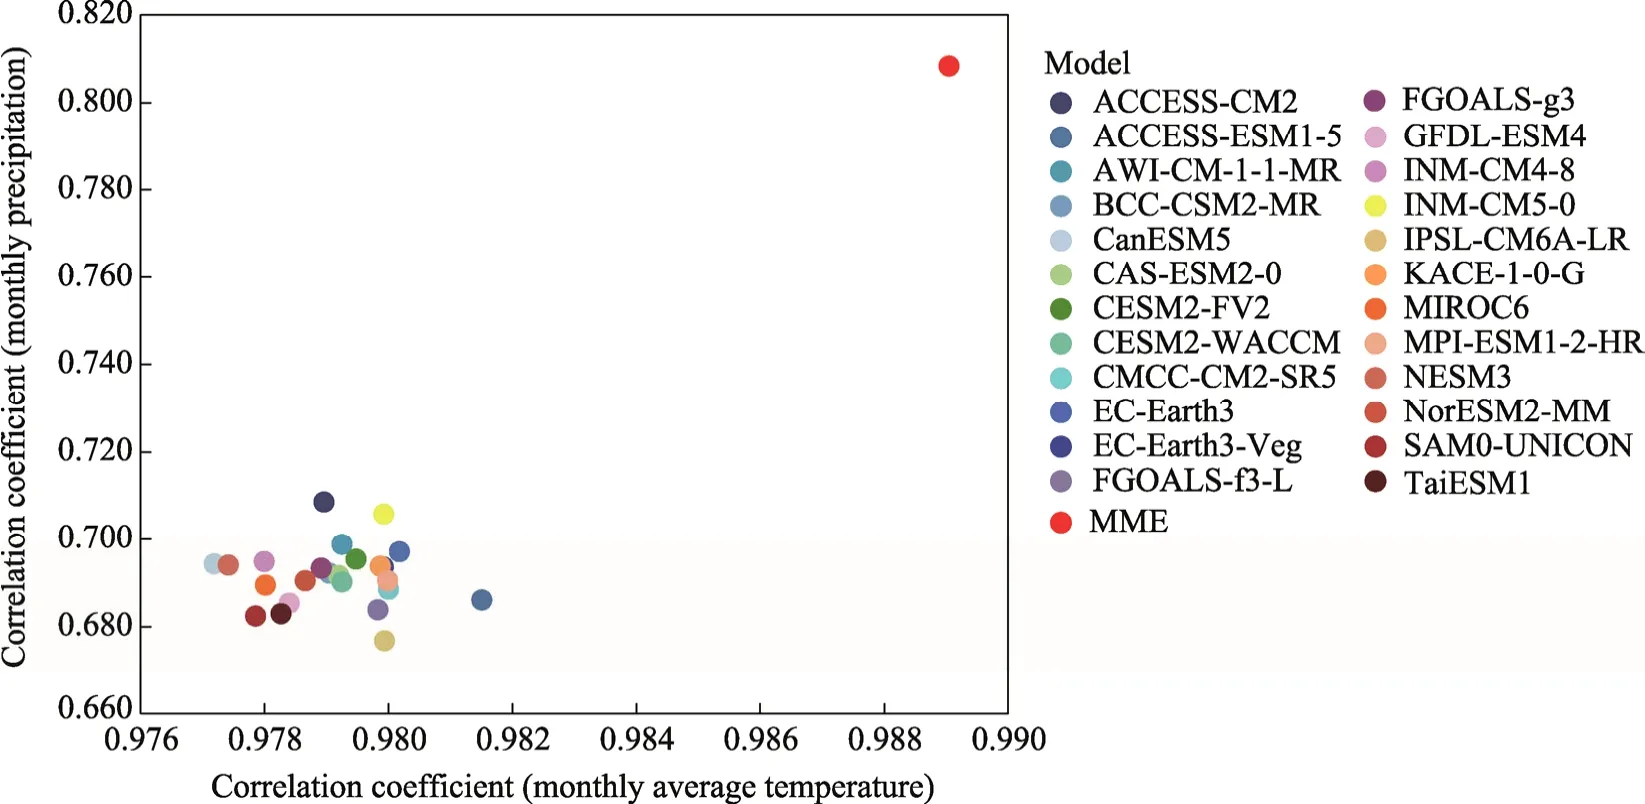
Fig.2 Scatter plot of the relationship of the correlation coefficients between monthly average temperature and monthly precipitation after bias correlation for the 24 global climate models (GCMs) and multi-model ensemble(MME)
Table 3 rates the quantitative evaluation results to analyze the bias-corrected effects of the 24 GCMs during the historical period (1961-2014).The comprehensive ranking was calculated using the arithmetic average of the rankings obtained through two distinct scoring methods for monthly average temperature and monthly precipitation simulations.The Taylor diagram quantitative evaluation index values for monthly average temperature were above 0.9913, while the values for monthly precipitation were higher than 0.9270.Notably, for monthly precipitation, the Taylor diagram quantitative evaluation index values for four models (ACCESS-CM2, AWI-CM-1-1-MR,EC-Earth3, and INM-CM5-0) were above 0.9700.The IVS values for monthly average temperature and monthly precipitation were close to zero, indicating that the interannual variability simulations of the 24 GCMs perform well.In summary, the INM-CM5-0 (ranking the 1st) produced the best simulations of monthly average temperature and monthly precipitation in the CTM,whereas the SAM0-UNICON produced the worst simulations (ranking the 24th).
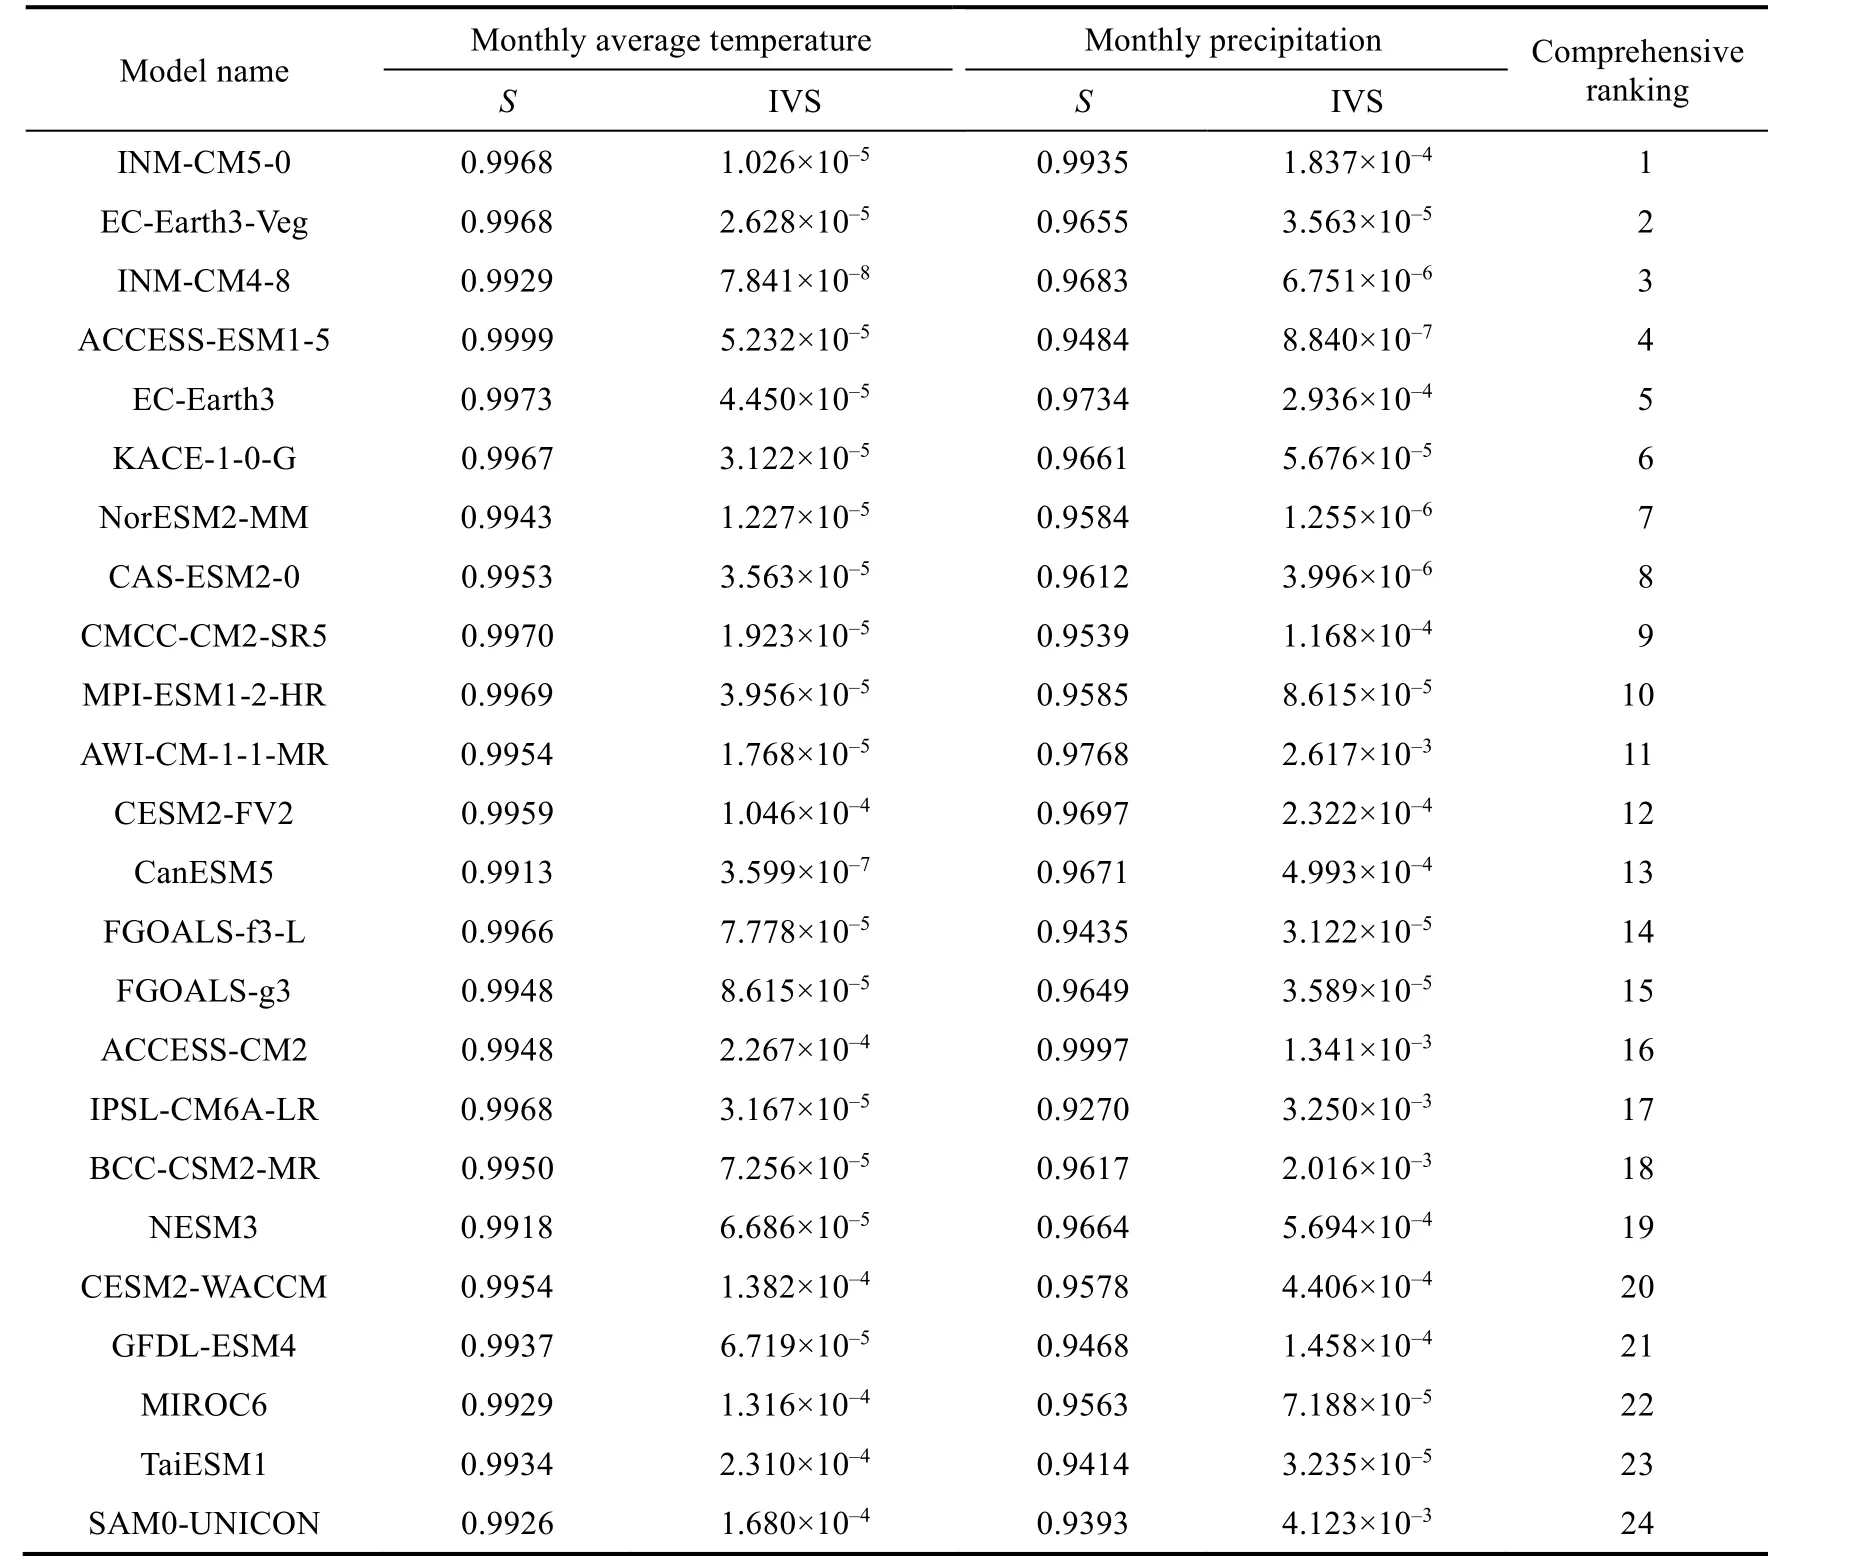
Table 3 Quantitative evaluation results of monthly average temperature and monthly precipitation simulations after bias correlation from the 24 GCMs
3.2 Spatiotemporal variations in temperature and precipitation in the CTM during 1961-2014
During 1961-2014, both the observed values and MME results indicated a fluctuating rise in annual average temperature and annual precipitation (Fig.3).The moving averages of the MME outputs were plotted to visualize their trends.The annual average temperature increased consistently from 1961 onward.After 1997, the annual average temperature from both the MME and CN05.1 increased substantially, which corresponded with the pattern of temperature changes recorded throughout Northwest China (Yang et al., 2017b).The fitted trend line from the CN05.1 indicated a period of rapid warming between 1975 and 1997, followed by a slow warming period from 1998 to 2014 in the CTM.During 1961-1997 and 1998-2014, the rate of change values in annual average temperature simulated by the MME were 0.016°C/10a and 0.241°C/10a greater than the observed values, respectively.
The annual precipitation in the CTM displayed a notable rising trend after 1989.The annual precipitation simulated by the MME displayed a smoother pattern than the observed values, with a distinct increase starting from 2008.Notably, the simulated annual precipitation demonstrated a delayed onset of apparent changes in comparison to the observed values.Furthermore, substantial disparities in precipitation simulations were observed among the GCMs during the same period(data not shown).Toward the end of the 20thcentury, the moving average of annual precipitation increased slowly with little change.The rate of change in annual precipitation was accelerated from the beginning of the 21stcentury.
The temperature simulated by the GCMs increased at the rate of 0.140°C/10a-0.350°C/10a during 1961-2014, which was close to the rate from the CN05.1 (0.290°C/10a) (Fig.4), and substantially higher than the global average (about 0.200°C/10a) (Mathew, 2022).Five models(CanESM5, CAS-ESM2-0, CESM2-WACCM, EC-Earth3, and NorESM2-MM) have simulated temperature increase rates above 0.300°C/10a, which were greater than the increase rate from the CN05.1 (0.290°C/10a).The MME simulation reduced the variability of simulations among different GCMs, but its simulated increase rate (0.230°C/10a) was lower than that from the CN05.1 (0.290°C/10a).
The change rates of precipitation simulated by the GCMs ranged from -3.300 to 9.720 mm/10a, whereas the change rate of precipitation from the CN05.1 was 10.500 mm/10a, which was greater than the current 50-a growth rate (9.700 mm/10a) across Xinjiang Uygur Autonomous Region, Northwest China (Wang et al., 2020).Although a rapid increase in precipitation was captured by most GCMs, the amount of precipitation was consistently underestimated.The model with simulated outputs closest to the observed values was the MIROC6, followed by the EC-Earth3.Negative rates of precipitation increase were simulated by eight GCMs (CASESM2-0, CESM2-FV2, CESM2-WACCM, CMCC-CM2-SR5, FGOALS-f3-L, GFDL-ESM4,INM-CM4-8, and NESM3), indicating a decrease in total precipitation in the CTM at the beginning of the 21stcentury.Temperature simulated by these eight models displayed an opposite trend with simulated precipitation at the beginning of the 21stcentury, with an obvious temperature increase (warming) accompanied by precipitation decrease (drying).The rate of precipitation increase simulated by the MME was 2.210 mm/10a, which lowered the uncertainty of the single model simulations to some extent, but still underestimated the precipitation amount(Tian et al., 2021).
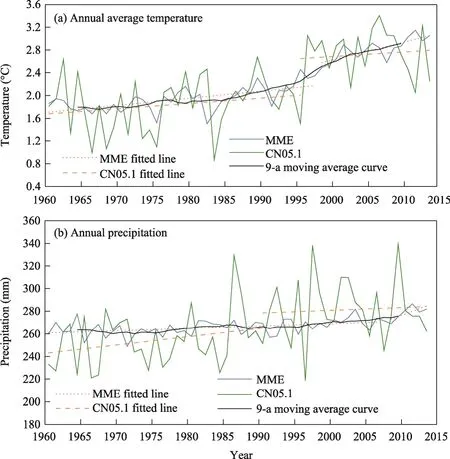
Fig.3 Temporal variations in annual average temperature (a) and annual precipitation (b) from the MME and CN05.1 during 1961-2014
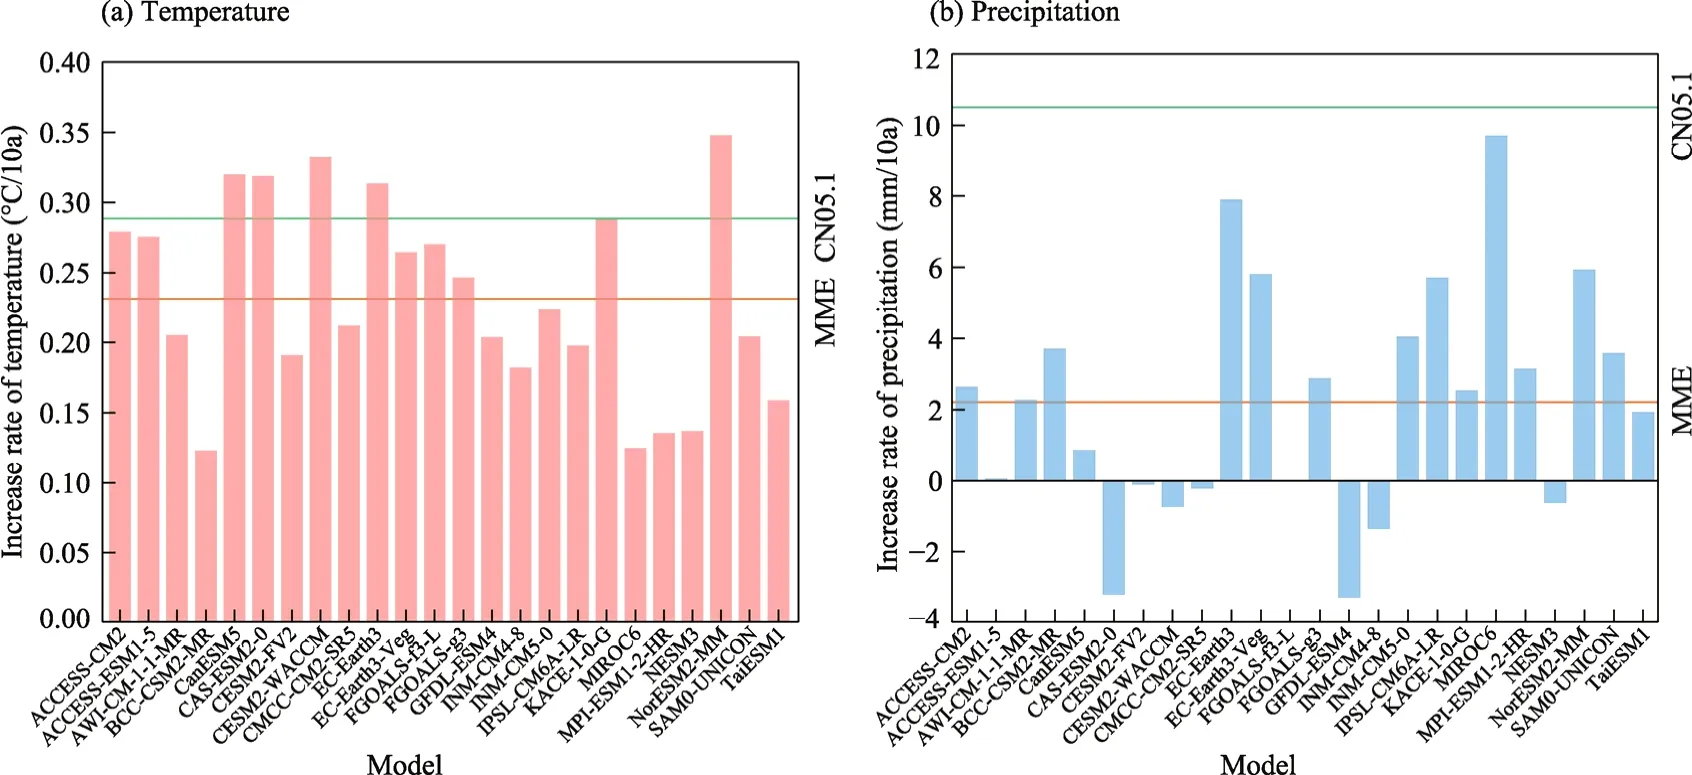
Fig.4 Increase rates of temperature and precipitation simulated from the 24 GCMs, CN05.1, and MME during 1961-2014
Figure 5 shows the intra-annual distribution of the CD values of temperature and precipitation between the GCMs and CN05.1 during 1961-2014.Based on the definition of the World Meteorological Organization (Greenwood, 2022), we divided a year into four seasons: winter(December-February of the next year), spring (March-May), summer (June-August), and autumn(September-November).The temperature simulated in spring and September, and precipitation simulated in winter and October were the closest to the observed values.The CD values of monthly average temperature and monthly precipitation were from -0.200°C to 0.370°C and from-0.690 to 1.450 mm during 1961-2014, respectively.This indicated that monthly average temperature and monthly precipitation are well simulated by the GCMs, with an overall warming and wetting bias.The models underestimated spring temperature, while overestimated winter temperature and spring precipitation.Winter and spring temperature profoundly affected spring precipitation (Wang et al., 2011).Generally, the GCMs simulated the warmer and wetter conditions in the CTM.

Fig.5 Portrait diagrams showing the intra-annual distribution of the cumulative departure (CD) values of temperature and precipitation between the GCMs and CN05.1 during 1961-2014 at different time scales
The monthly average temperature simulated by the MME was broadly consistent with that determined from the CN05.1 during 1961-2014.The CD values of seasonal precipitation between the simulated and observed values were in the range of 0.010-0.320 mm.The concentrated period(summer) of precipitation in the CTM was captured by the MME.Summer precipitation simulated by the MME accounted for 49.10% of the annual total, which was 8.80% larger than the value from the CN05.1.Spring precipitation simulated by the MME was overestimated by 5.20%compared to the observed value.The MME could accurately reflect the regional temperature and precipitation variation trends during the historical period (1961-2014); therefore, it can be used to project temperature and precipitation in the future (2021-2100) in the CTM.
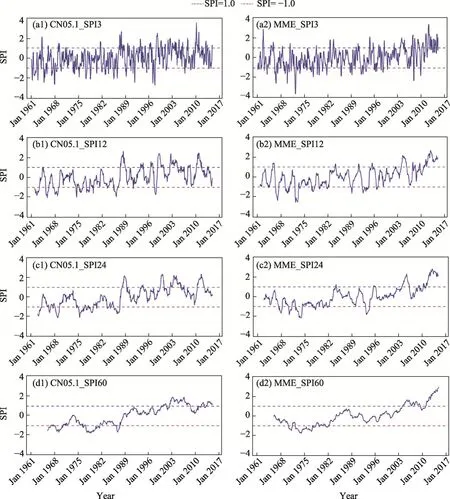
Fig.6 Temporal variations of standardized precipitation index (SPI) based on the CN05.1 (a1, b1, c1, and d1)and MME (a2, b2, c2, and, d2) during 1961-2014 at the 3-, 12-, 24-, and 60-month time scales.CN05.1_SP13,CN05.1_SPI12, CN05.1_SPI24, and CN05.1_SPI60 denote the SPI values at the 3-, 12-, 24-, and 60-month time scales, respectively, based on the CN05.1.MME_SPI3, MME_SPI12, MME_SPI24, and MME_SPI60 denote the SPI values at the 3-, 12-, 24-, and 60-month time scales, respectively, based on the MME.The SPI with values between -1.0 (the red dotted line) and 1.0 (the blue dotted line) indicates that the dry and wet conditions are normal in the region.
Figure 6 shows the SPI values calculated at four time scales (3, 12, 24, and 60 months) from 1961 to 2014.The overall trends of SPI were similar at different time scales, with visible wetting trend in the CTM during 1961-2014.There was a shift from dry to wet in the 1980s.Over time,the wetting trend simulated by the MME became more obvious, as well as the difference in the SPI between the simulated and observed values.The difference was more evident at the 24- and 60-month time scales than at the 3- and 12-month time scales.
At the 12-month time scale, more wet and drought events were identified according to the SPI(Fig.6).At the end of the 1980s, there was a clear difference in the SPI (maximum of 2.5)between the simulated and observed values.At the 60-month time scale, the MME simulated a shorter drought period, and the dry-wet transitions occurred earlier than those derived from the CN05.1.At the 24- and 60-month time scales, the MME preferred continued wetting trend in the 2010s.The SPI confirmed that the most frequent droughts occurred in the late 1960s, late 1970s,and 1980s.In the 2000s, there was a conversion to a wetter period.
The spatial distribution of the rates of change in annual average temperature and annual precipitation in the CTM from 1961 to 2014 is shown in Figure 7.The divergent rates of change were apparent in the northern and southern parts of the CTM (Li et al., 2012).The warming and wetting have accelerated in the northern part of the CTM.The MME caught the geographical variability, and simulated the spatial distribution of temperature and precipitation consistent with the CN05.1.The rates of warming simulated by the MME were almost consistent with the rates derived from the CN05.1.Specifically, the values were higher than the rates derived from the CN05.1 by 0.030°C/10a-0.083°C/10a in the southwestern part of the CTM, but were slightly lower than the rates derived from the CN05.1 in the northern part of the CTM.The rates of wetting simulated by the MME were lower than the rates derived from the CN05.1 throughout the region, whereas the simulated precipitation centers were consistent with the observed results.The simulation results from the MME reduced the spatial variability of the rates of wetting in the eastern and western parts of the CTM, and underestimated the rates of wetting change in the western part of the CTM from 1961 to 2014.
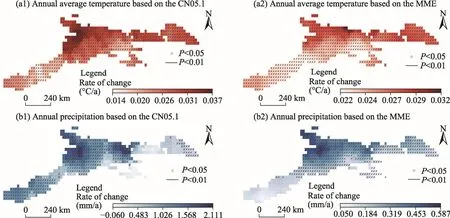
Fig.7 Spatial distribution of the rates of change in annual average temperature (a1 and b1) and annual precipitation (a2 and b2) based on the CN05.1 and MME during 1961-2014.The dotted areas indicate that the change trends of temperature and precipitation are significant at the P<0.05 level, and the lined areas indicate that the change trends are significant at the P<0.01 level.
3.3 Spatiotemporal variations in future temperature and precipitation patterns during 2021-2100
After validation and analysis during the historical period (1961-2014), the bias-corrected GCMs could be applied to project the future temperature and precipitation in the CTM.However, not all of the models had access to the four future scenarios (SSP1-2.6, SSP2-4.5, SSP3-7.0, and SSP5-8.5).Therefore, the MME used to characterize the future temperature and precipitation under the four SSP scenarios differed from that used for the historical period.After excluding the models with incomplete time series as well as the models that did not include the four SSP scenarios, the MME consisted of 12 GCMs: ACCESS-CM2, BCC-CSM2-MR, CAS-ESM2-0,CESM2-WACCM, CMCC-CM2-SR5, EC-Earth3, EC-Earth3-Veg, FGOALS-f3-L, FGOALS-g3,KACE-1-0-G, MIROC6, and TaiESM.After downscaling and bias correction, the MME averaging was performed on the data from the 12 GCMs, which can reduce the uncertainty of single model projections.
The annual average temperature and annual precipitation will increase with the increasing radiative forcing in the future (Fig.8).The annual average temperature presents a significant upward trend, while annual precipitation shows a volatile growing trend (Table 4).As the increase in radiative forcing, the annual average temperature increases at a faster rate, with the largest increase rate under the SSP5-8.5 scenario.By the end of the 21stcentury, the annual average temperature simulated by the MME will reach up to 4.100°C under the SSP1-2.6 scenario, with an increase rate of 0.090°C/10a.Under the SSP5-8.5 scenario, the corresponding value is 8.900°C, with an increase rate of 0.730°C/10a, which is much higher than the rate during 1961-2014 (0.290°C/10a).The annual precipitation projected by the individual models fluctuates widely, whereas the MME indicates a slowly increasing trend.By the end of the 21stcentury, the annual precipitation will increase by 3.09% under the SSP1-2.6 scenario and by 16.19% under the SSP5-8.5 scenario, compared to the historical period (1961-2014).
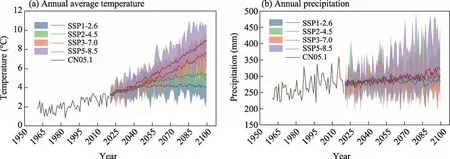
Fig.8 Temporal variations in annual average temperature (a) and annual precipitation (b) during 2021-2100 under the SSP1-2.6, SSP2-4.5, SSP3-7.0, and SSP5-8.5 scenarios compared to the values from the CN05.1 in the historical period (1961-2014).The colored shaded areas indicate the range of simulated fluctuations for the individual models under a given scenario, and the solid lines indicate the simulated mean value after averaging over multiple models under a given scenario.SSP, shared socio-economic pathway.

Table 4 Rates of change in annual average temperature and annual precipitation during 2021-2100 under the SSP1-2.6, SSP2-4.5, SSP3-7.0, and SSP5-8.5 scenarios
The monthly average temperature presents a general increasing variability during 2021-2100 under the four SSP scenarios relative to the historical period (Fig.9).As with the annual average temperature, its rate of increase also rises with increasing radiative forcing.The magnitude of increasing of temperature in some months exhibits symmetrical characteristics, with the largest increase in amplitude under the SSP5-8.5 scenario in March and October (102.23% and 126.87%,respectively).The temperature in winter and spring has a maximum magnitude of increasing of 126.00%.Despite the temperature only increases slightly in summer, it will continue to rise in the future relative to the historical period.Against this backdrop of sustained warming, the implications for the CTM, which contains abundant glacial snow resources, are self-evident.
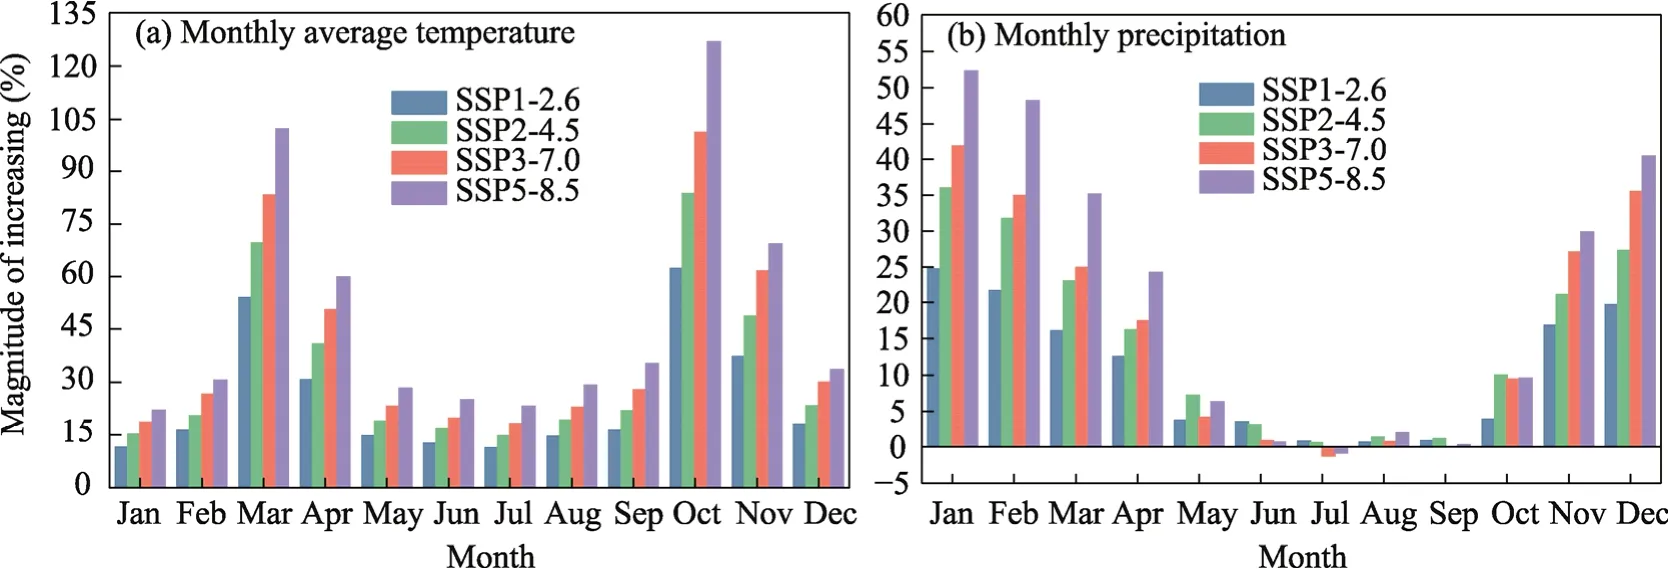
Fig.9 Magnitude of increasing of monthly average temperature (a) and monthly precipitation (b) during 2021-2100 under the SSP1-2.6, SSP2-4.5, SSP3-7.0, and SSP5-8.5 scenarios relative to the historical period
The variation in monthly precipitation is distinct from that in monthly average temperature;monthly precipitation is no longer synchronous during May-October with increasing radiative forcing.The magnitude of increasing of monthly precipitation is most prominent (52.23%) in January under the SSP5-8.5 scenario.Under all the four scenarios, the magnitude of increasing of monthly precipitation increases continuously from October to January of the next year and gradually decreases from January to July.The precipitation in July will decrease under both the SSP3-7.0 and SSP5-8.5 scenarios, compared to the historical period.Winter and spring precipitation values during 2021-2100 are higher than those during the historical period.
We divided the future period 2021-2100 into three terms: near-term (2021-2040), mid-term(2041-2060), and long-term (2081-2100).The overall trends and distributional characteristics of annual average temperature and annual precipitation in the three future terms are consistent with those during the whole future period (2021-2100), displaying an increase trend over time (Fig.10).However, in each term, the values of annual average temperature are more focused than those of annual precipitation.The annual precipitation varies over a wider range in each term.Under the SSP1-2.6 scenario, both annual average temperature and annual precipitation increase rapidly in near-term and mid-term, while annual average temperature and annual precipitation increase slowly in long-term.Compared with the mid-term, there are decreases in annual average temperature and annual precipitation in some years in long-term under the SSP1-2.6 scenario.The annual average temperature reaches up to 4.180°C, and annual precipitation increases to 283.770 mm in long-term under the SSP2-4.5 scenario.Under the SSP2-4.5 and SSP3-7.0 scenarios, a trend of increasing from near-term to long-term occurs both in annual average temperature and annual precipitation.Under the SSP5-8.5 scenario, the annual average temperature reaches up to 8.100°C in long-term, indicating an increase of 116.00% compared to that in near-term.The annual precipitation under the SSP5-8.5 scenario in long-term will increase by 10.41% compared to that in near-term.By the end of the 21stcentury, the CTM may display warming and wetting characteristics under the SSP5-8.5 scenario.
The rate of change in annual average temperature over time under the four scenarios is significantly spatially heterogeneous (Fig.11).Most regions in the CTM display significant warming trend.In all three future terms, the rate of warming changes smoothly under the SSP1-2.6 and SSP2-4.5 scenarios, while it increases substantially over time under the SSP3-7.0 and SSP5-8.5 scenarios.The rate of change in annual average temperature gradually decreases from near-term to long-term under both the SSP1-2.6 and SSP2-4.5 scenarios.It is negative in long-term under the SSP1-2.6 scenario (Fig.11a3), and increases slowly from near-term to mid-term under the SSP2-4.5 scenario (Fig.11b1-b3).Under the SSP2-4.5 scenario, the fastest rate of warming appears in the western part of the CTM in long-term (Fig.11b3), while under the other three scenarios, the fastest rate of warming occurs in the eastern part (Fig.11a3, 11c3, and 11d3).For all the three future terms, the overall rate of temperature increase (warming) is fastest under the SSP5-8.5 scenario, even reaching 0.090°C/a in the eastern part of the CTM in long-term(Fig.11d1-d3).
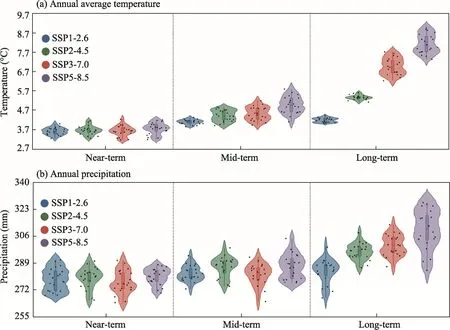
Fig.10 Violin plot showing the trends and distribution of annual average temperature (a) and annual precipitation (b) in near-term (2021-2040), mid-term (2041-2060), and long-term (2081-2100) under the SSP1-2.6, SSP2-4.5, SSP3-7.0, and SSP5-8.5 scenarios.The violin shape indicates the distributional characteristics of annual average temperature and annual precipitation, with the width representing the degree of concentration.Black dots indicate the data points of annual average temperature and annual precipitation in different years.Box boundaries indicate the 25th and 75th percentiles across years, and whiskers below and above the box indicate the 10th and 90th percentiles, respectively.The horizontal line within each box indicates the median of data points.
Generally, the spatial variability of annual precipitation is diversified (Fig.12).The center of annual precipitation changes over time in the CTM.Under the SSP1-2.6 scenario, the rate of change in annual precipitation increases significantly in the western part of the CTM in long-term,compared to the near-term and mid-term (Fig.12a1-a3).The region showing significant wetting in long-term shrinks compared to the near-term under the SSP2-4.5 scenario (Fig.12b1 and b3).Under the SSP3-7.0 scenario, the rate of change in annual precipitation decreases in the western part of the CTM, whereas it initially decreases and then increases in the central region in three terms, compared to that under the SSP2-4.5 scenario (Fig.12b1-c3).Under the SSP5-8.5 scenario,the fastest increase in the rate of annual precipitation occurs in long-term (Fig.12d3), and the average rate of change in annual precipitation in the northern part of the CTM reaches up to 2.500 mm/a in long-term.
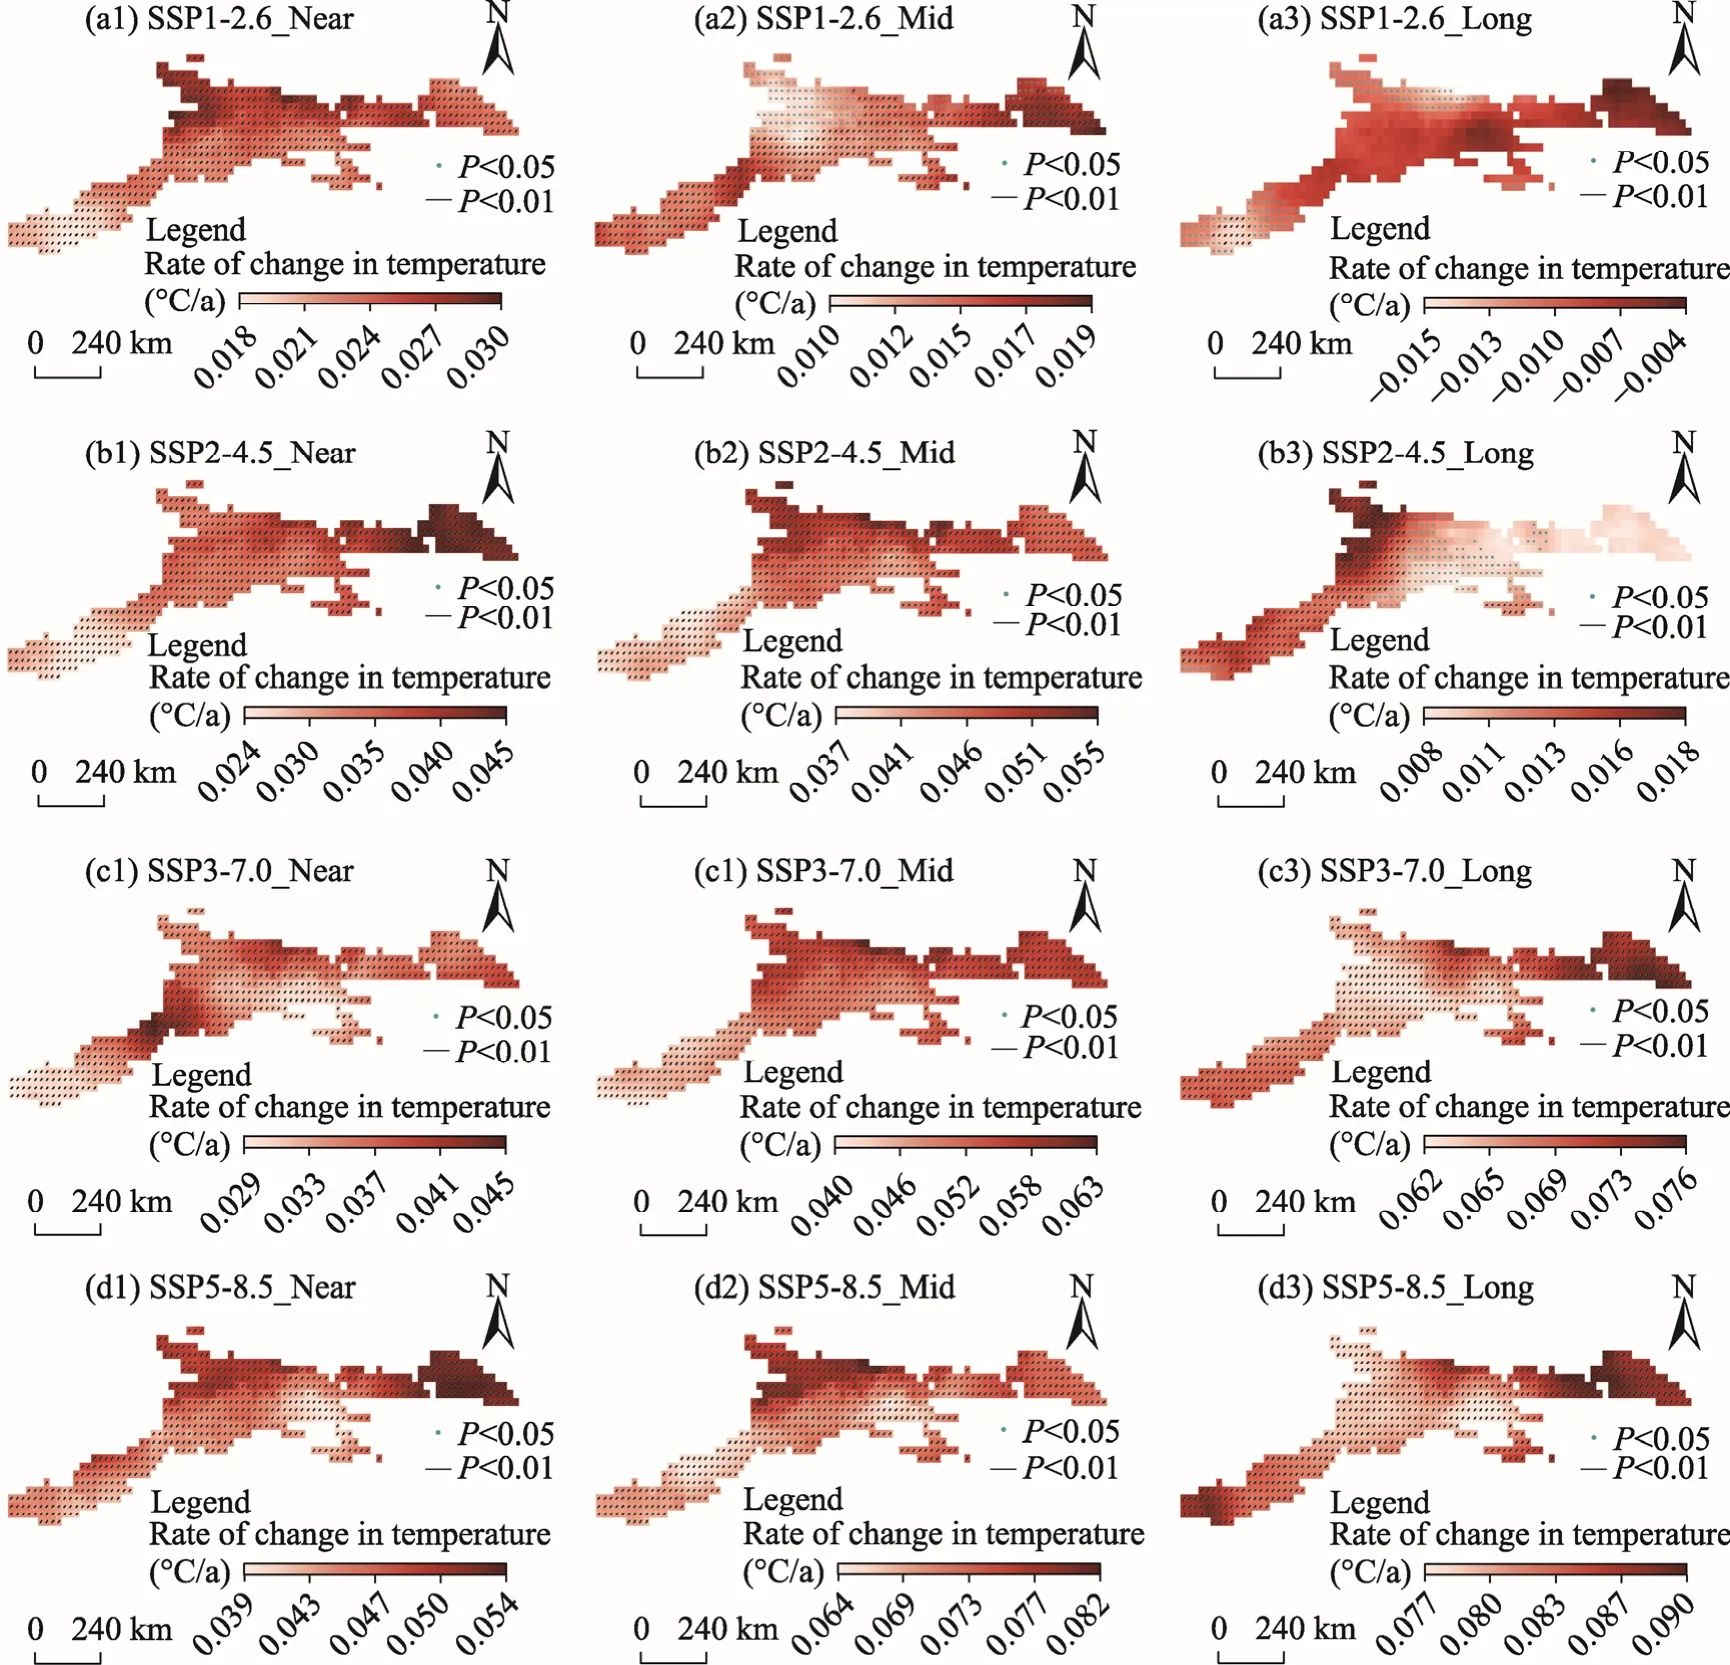
Fig.11 Spatial distribution of the rate of change in annual average temperature increase (warming) in near-term(2021-2040), mid-term (2041-2060), and long-term (2081-2100) under the SSP1-2.6 (a1-a3), SSP2-4.5 (b1-b3),SSP3-7.0 (c1-c3), and SSP5-8.5 (d1-d3) scenarios.SSP1-2.6_Near, SSP2-4.5_Near, SSP3-7.0_Near, and SSP5-8.5_Near mean SSPs in near-term; SSP1-2.6_Mid, SSP2-4.5_Mid, SSP3-7.0_Mid, and SSP5-8.5_Mid mean SSPs in mid-term; SSP1-2.6_Long, SSP2-4.5_Long, SSP3-7.0_Long, and SSP5-8.5_Long mean SSPs in long-term.The dotted areas indicate that the change trends of temperature are significant at the P<0.05 level, and the lined areas indicate that the change trends are significant at the P<0.01 level.
Figure 13 shows the variations in SPI values from the MME during 2021-2100 under the four SSP scenarios.Generally, there is a trend from dry to wet in the CTM under all scenarios, with an obvious wetting at the end of the 21stcentury.The CTM will become wetter with the increase in radiative forcing in the future.The SPI at the 12-month time scale indicates a large interannual fluctuation than that at the 60-month time scale.At the 12-month time scale, the number of dry years (with SPI≤ -1.0) would reduce with the increase in radiative forcing.At the 60-month time scale, the moment at which the non-drought state begins is almost the same under all scenarios.Under the SSP1-2.6 scenario, drought conditions are captured in the late 2080s and the beginning of the 2090s and will last for about 5 a, but afterward the SPI rebounds rapidly and wet conditions occur (Fig.13a1 and a2).The SPI values will decline under the SSP2-4.5 scenario in the 2070s(Fig.13b1 and b2), with moderate drought conditions occurring.However, the SPI values will exceed 2.0 in the 2080s under the SSP2-4.5 scenario, exhibiting extreme wet conditions.The values continue to increase without apparent drought conditions under the SSP3-7.0 and SSP5-8.5 scenarios in the future (Fig.13c1-d2).It is noted that an extreme wet level would be reached under the SSP5-8.5 scenario by the end of the 21stcentury.
4 Discussion
4.1 Capability of the CMIP6 GCMs in the CTM
This study combined the CN05.1 with CMIP6 GCMs during 1961-2014 to construct a probability function.The accuracy of the bias-corrected GCMs for both temperature and precipitation simulations was considerably improved, and the bias-corrected GCMs were considered suitable for small-scale studies in regions such as the CTM (Du et al., 2022).We used the MME to reduce the uncertainty of single models and project the spatiotemporal variations of temperature and precipitation from 2021 to 2100 under four SSP scenarios.The GCMs demonstrated a strong performance in simulating and projecting temperature, but tended to underestimate precipitation,which are consistent with the findings of Lafon et al.(2013) and Hu et al.(2021).Notably, there are significant differences in the precipitation simulation performance among individual GCMs over the same period (Lei et al., 2023).

Fig.13 Temporal variations of the SPI values based on the MME during 2021-2100 at the 12- and 60-month time scales under the SSP1-2.6 (a1 and a2), SSP2-4.5 (b1 and b2), SSP3-7.0 (c1 and c2), and SSP5-8.5 (d1 and d2) scenarios.SSP1-2.6_SPI12, SSP2-4.5_SPI12, SSP3-7.0_SPI12, and SSP5-8.5_SPI12 denote the SPI values at the 12-month time scale under the SSP1-2.6, SSP2-4.5, SSP3-7.0, and SSP5-8.5 scenarios, respectively.SSP1-2.6_SPI60, SSP2-4.5_SPI60, SSP3-7.0_SPI60, and SSP5-8.5_SPI60 denote the SPI values at the 60-month time scale under the SSP1-2.6, SSP2-4.5, SSP3-7.0, and SSP5-8.5 scenarios, respectively.The SPI with values between -1.0 (the red dotted line) and 1.0 (the blue dotted line) indicates that the drought and wet conditions are normal in the region.
4.2 Performance in simulating temperature and precipitation in the historical period(1961-2014)
In general, the trends of annual average temperature and annual precipitation during 1961-2014 simulated by the GCMs in the CTM are consistent with those in Northwest China (Qin et al.,2021).The warming and wetting trends in the CTM were apparent with regards to monthly average temperature and monthly precipitation simulated by the bias-corrected MME during 1961-2014.The MME slightly underestimated spring temperature and overestimated winter temperature, which had an impact on the precipitation phase in winter and spring (Xu et al.,2016).The GCMs overestimated spring and summer precipitation by 75.40% in the CTM (Yang et al., 2023).
During 1961-2014, the climate in the CTM first experienced a period of rapid warming,followed by a slower warming phase.The MME simulated a slower rate of warming than the observed warming rate.From 1998 to 2013, most GCMs consistently simulated accelerated warming in the CTM, failing to adequately capture the warming mitigation (Zhang et al., 2021a).Unlike the change trend of annual precipitation in Northwest China (Deng et al., 2014), an increasing trend existed before 1997 in the CTM.Precipitation simulated by the MME increased slowly towards the end of the 20thcentury, then proliferated rapidly at the beginning of the 21stcentury.The interannual variation of precipitation exhibited cyclical oscillatory characteristics in the range of 4-7 a (Wang et al., 2012; Li et al., 2016).The timing of the apparent changes in precipitation was delayed in the simulations compared with the observations.The northwestern part of the CTM displayed a distinctive spatial pattern of accelerated warming coupled with enhanced precipitation between 1961 and 2014 (Fig.7).The rate of change in precipitation simulated by the MME lagged behind the observed rate, particularly in the western part of the CTM.Moreover, the previously drought conditions shifted to a wetter environment during the 1980s in the CTM.
4.3 Performance in projecting temperature and precipitation in the future (2021-2100)
During 2021-2100, the annual average temperature displays a significant upward trend, while annual precipitation shows a fluctuating increase trend (Fig.8).Transitions from dry to wet occur in the CTM in the 21stcentury under the four SSP scenarios (Fig.13) (Chen et al., 2022).Under the SSP1-2.6 scenario, the annual average temperature exhibits a trend of increasing first and then decreasing, and annual precipitation shows a decreasing trend in some years by the end of the 21stcentury.Warming and drying become more pronounced in the eastern part of the region (Li et al.,2022b).Moderate drought will emerge in the 2070s while extreme wet may occur in the 2080s under the SSP2-4.5 scenario.Under the SSP3-7.0 scenario, significant warming and wetting will exist in the central part of the region.In long-term, the annual average temperature and annual precipitation were projected to increase at the rates of 0.090°C/a and 2.500 mm/a, respectively, in the eastern part of the region under the SSP5-8.5 scenario.Ultimately, an extreme wet level will be achieved by the end of the 21stcentury.
The annual average temperature simulated by the MME under the SSP1-2.6 scenario reaches up to 4.170°C with an increase rate of 0.090°C/10a, while under the SSP5-8.5 scenario, it is expected to peak at 8.900°C with an increase rate of 0.730°C/10a by the end of the 21stcentury.During 2021-2100, the annual precipitation simulated by the MME under the SSP1-2.6 scenario reaches 286.000 mm, with an increase rate of 0.680 mm/10a, while under the SSP5-8.5 scenario,it peaks at 316.710 mm with an increase rate of 4.930 mm/10a.The magnitude of increasing of temperature in some months exhibits symmetrical characteristics, with the largest increase occurring in spring and autumn.The precipitation increases the most in winter, and there is no positive correlation between summer precipitation and radiative forcing (Fig.9) (Yang et al.,2023).Although the increase in precipitation in near-term and mid-term would alleviate the drought conditions to some extent, the ''warm and dry'' pattern in the CTM will not change at all(Wang et al., 2020).
4.4 Limitations and prospects
Regional warming and wetting, as a response to global warming, can lead to an increase in water vapor (Tu and Lu, 2021).Precipitation, a component of the water cycle, has increased in the CTM in recent decades due to the northward transport of moisture from the tropical Indian Ocean and the intensified southerly current (Shi et al., 2007; Sun et al., 2022a).Due to the nature of the CTM and the complex climatic influences, it is difficult to ascertain whether long-term changes in the water cycle stem from changes in water vapor transport, westerly circulation and evapotranspiration, or other factors (Pi et al., 2020).Changes in temperature and precipitation,acceleration of glacial ablation and shrinkage, variations in glacier material balances, and reduction in the length of the potential snowfall season are the indicators of the transitions from warm and dry to warm and wet conditions in the CTM (Tang et al., 2013; Javadinejad et al., 2020;Li et al., 2023).
There is a significant amount of uncertainty surrounding the intricacies of future climate change (Visser et al., 2000; Kundzewicz et al., 2018).The resolution, physical characteristics, and other variables of the GCMs will generate some inaccuracies and uncertainties in future projections (Knutti, 2008; Schaller et al., 2011; Collins et al., 2012).Further experimental and observational data are therefore required for the continuous improvement of predictive models.Additionally, multi-factor physical effects, policy decisions, international community responses,and anthropogenic influences will also necessitate ongoing discussion and optimization in the future (Hawkins and Sutton, 2011).
5 Conclusions
The climate in the CTM has notably transitioned from warm and dry to warm and wet(1961-2014).Therefore, in this study, we evaluated the simulation performance of the CMIP6 GCMs in the CTM and investigated the unique regional climate change at different time scales in this region.We also projected the future temperature and precipitation changes during 2021-2100,and applied the SPI to analyze the dry-wet transitions in the CTM during 1961-2014 and 2021-2100 at different time scales.This enables us to obtain a detailed overview of the temporal trends and spatial distribution of temperature and precipitation in the region.Generally, the GCMs can capture the climatological features of temperature and precipitation in the CTM very well,with a warming and wetting trend occurring by the end of the 21stcentury under the four SSP scenarios (SSP1-2.6, SSP2-4.5, SSP3-7.0, and SSP5-8.5).There are spatial and temporal variations in the rates of change in temperature and precipitation in the region.The central and western parts of the CTM will display significant warming and wetting by the end of the 21stcentury under the SSP5-8.5 scenario.
Climate change poses a multifaceted challenge to the CTM because its impacts not only negatively affect the ecosystems and environment, but also pose a threat to social and economic stability.The findings of this study could inform government decision-making and the development of regional ecological protection and production activities in the CTM, which will be useful for further analyses of meteorological drought in this region.
Conflict of interest
The authors declare that they have no known competing financial interests or personal relationships that could have appeared to influence the work reported in this paper.
Acknowledgements
This work was financially supported by the National Natural Science Foundation of China (42261026, 41971094,42161025), the Gansu Provincial Science and Technology Program (22ZD6FA005), the Higher Education Innovation Foundation of Education Department of Gansu Province (2022A041), and the open foundation of Xinjiang Key Laboratory of Water Cycle and Utilization in Arid Zone (XJYS0907-2023-01).
Author contributions
LIU Xinyu: conceptualization, data curation, formal analysis, methodology, validation, writing - original draft; LI Xuemei: funding acquisition, project administration, resources, writing - review and editing; ZHANG Zhengrong:formal analysis, investigation; ZHAO Kaixin: visualization; and LI Lanhai: funding acquisition, supervision.All authors approved the manuscript.
猜你喜欢
地域文化研究(2023年5期)2023-12-16
学苑教育(2022年25期)2022-03-02
市场周刊(2018年5期)2018-09-17
赤峰学院学报·哲学社会科学版(2017年8期)2018-07-09
现代商贸工业(2016年35期)2016-04-09
江西社会科学(2015年2期)2015-04-16
文史博览·文史(2014年8期)2014-10-21
河北开放大学学报(2012年5期)2012-09-11
环球时报(2009-05-15)2009-05-15
中国新闻周刊(2009年7期)2009-03-10
- Journal of Arid Land的其它文章
- Exploring groundwater quality in semi-arid areas of Algeria: Impacts on potable water supply and agricultural sustainability
- Runoff change in the Yellow River Basin of China from 1960 to 2020 and its driving factors
- Influence of varied drought types on soil conservation service within the framework of climate change:insights from the Jinghe River Basin, China
- Land use and cover change and influencing factor analysis in the Shiyang River Basin, China
- Effects of landscape fragmentation of plantation forests on carbon storage in the Loess Plateau, China
- Effects of drip and flood irrigation on carbon dioxide exchange and crop growth in the maize ecosystem in the Hetao Irrigation District, China