
Effects of drip and flood irrigation on carbon dioxide exchange and crop growth in the maize ecosystem in the Hetao Irrigation District, China
2024-02-26 09:11LIChaoqunHANWentingPENGManman
Journal of Arid Land 2024年2期
LI Chaoqun, HAN Wenting, PENG Manman
1 College of Mechanical and Electrical Engineering, Heze University, Heze 274015, China;
2 College of Mechanical and Electronic Engineering, Northwest A&F University, Yangling 712100, China;
3 Institute of Soil and Water Conservation, Northwest A&F University, Yangling 712100, China
Abstract: Drip irrigation and flood irrigation are major irrigation methods for maize crops in the Hetao Irrigation District, Inner Mongolia Autonomous Region, China.This research delves into the effects of these irrigation methods on carbon dioxide (CO2) exchange and crop growth in this region.The experimental site was divided into drip and flood irrigation zones.The irrigation schedules of this study aligned with the local commonly used irrigation schedule.We employed a developed chamber system to measure the diurnal CO2 exchange of maize plants during various growth stages under both drip and flood irrigation methods.From May to September in 2020 and 2021, two sets of repeated experiments were conducted.In each experiment, a total of nine measurements of CO2 exchange were performed to obtain carbon exchange data at different growth stages of maize crop.During each CO2 exchange measurement event, CO2 flux data were collected every two hours over a day-long period to capture the diurnal variations in CO2 exchange.During each CO2 exchange measurement event, the biological parameters (aboveground biomass and crop growth rate) of maize and environmental parameters(including air humidity, air temperature, precipitation, soil water content, and photosynthetically active radiation) were measured.The results indicated a V-shaped trend in net ecosystem CO2 exchange in daytime, reducing slowly at night, while the net assimilation rate (net primary productivity) exhibited a contrasting trend.Notably, compared with flood irrigation, drip irrigation demonstrated significantly higher average daily soil CO2 emission and greater average daily CO2 absorption by maize plants.Consequently, within the maize ecosystem, drip irrigation appeared more conducive to absorbing atmospheric CO2.Furthermore, drip irrigation demonstrated a faster crop growth rate and increased aboveground biomass compared with flood irrigation.A strong linear relationship existed between leaf area index and light utilization efficiency, irrespective of the irrigation method.Notably, drip irrigation displayed superior light use efficiency compared with flood irrigation.The final yield results corroborated these findings, indicating that drip irrigation yielded higher harvest index and overall yield than flood irrigation.The results of this study provide a basis for the selection of optimal irrigation methods commonly used in the Hetao Irrigation District.This research also serves as a reference for future irrigation studies that consider measurements of both carbon emissions and yield simultaneously.
Keywords: carbon dioxide exchange; maize growth; drip irrigation; harvest index; net primary productivity; Hetao Irrigation District
1 Introduction
The Hetao Irrigation District, situated in the Northwest China, holds a continental climate characterized by sufficient sunlight and high evaporation.The average annual rainfall of approximately 130 mm and average annual evaporation of approximately 2300 mm (Guo and Liu,2021) pose a challenge for meeting crop growth requirements.The Hetao Irrigation District benefits from the Yellow River, the China's second longest river, which flows through this district.Therefore, both groundwater and river water resources are abundantly available in this area (Wu et al., 2019; Peng et al., 2022).Drip irrigation and flood irrigation are the main irrigation methods to utilize water resources in this area (Wei et al., 2021).
The effects of drip and flood irrigation on maize growth and carbon dioxide CO2exchange between maize plants (the major food crop in the Hetao Irrigation District, constituting approximately 35% of the total planting area in this district) and the atmosphere vary significantly(Tian et al., 2017; Wei et al., 2021).Therefore, it is crucial to thoroughly investigate the effects of these two irrigation methods, namely flood irrigation and drip irrigation, on carbon emissions and their implications for maize biomass and yield.
Key parameters such as net ecosystem CO2exchange (NEE), crop net primary productivity(NPP), and soil respiration (Rs) play a pivotal role in demonstrating the CO2exchange between ecosystem and atmosphere (Otieno et al., 2009; Lindner et al., 2016).Two primary methods, eddy covariance and chamber-based approaches, are currently employed for measuring CO2exchange.Eddy covariance, a large-scale and fixed-point observation technique, is suitable for assessing overall emissions within an entire ecosystem (Gao et al., 2019).However, it cannot differentiate carbon emissions originating from the crop itself or other sources such as soil, microorganisms,and animals, making it unsuitable for studying carbon flux in small-scale agricultural fields.On the contrary, chamber-based approaches allow for the examination of carbon flux in small-scale agricultural fields (Li et al., 2020), enabling separate measurements of CO2emissions from both crops and soil and facilitating a more comprehensive analysis of carbon emissions in agricultural fields.
Currently, most studies on carbon emission measurement using the chamber method have used the manual measurement, which is a labor-intensive experiment (Otieno et al., 2009; Xue et al.,2017), and most studies measured carbon emissions only once from 09:00 to 13:00 (Beijing time),representing the average emission rate of the day (Polifka et al., 2018).However, environmental factors such as temperature and soil humidity greatly influence the carbon emission of the agroecosystem, leading to a large daily variation in CO2emission (Li et al., 2021a, b; Peng et al.,2021).Thus, the average CO2emission cannot accurately reflect the daily variation in CO2emission.Additionally, the efficiency of light utilization cannot be calculated by measuring the carbon emission only once.Many researchers have begun employing the chamber method to measure crop carbon exchange multiple times a day to obtain comprehensive data on daily variation of carbon exchange at a canopy scale.Lindner et al.(2016) studied the diurnal NEE variation in the rice cropland and manually conducted measurement between 06:00 and 18:00(Beijing time); however, the labor-intensive nature of the chamber method limits the measurement of nighttime CO2exchange data.While most studies have used model estimation method to determine nighttime average emission values (Elsgaard et al., 2012), these values cannot capture the specific variation type of nighttime emissions (Li et al., 2021b), hindering an accurate reflection of nighttime emission trends.
As maize plants grow very tall, a large labor force is needed to measure the CO2exchange.Currently, most of the studies focused only on soil carbon emission in the maize ecosystem.For example, Guo et al.(2017) studied the influences of drip and flood irrigation on soil CO2emission and soil carbon sequestration in maize cropland.However, studying soil carbon emission alone cannot provide a comprehensive understanding of the effects of different irrigation methods on crop growth and CO2exchange in maize ecosystem.To comprehensively investigate the influence of drip and flood irrigation on carbon emissions in maize fields, as well as to explore the correlation among carbon emission, crop biomass, and yield, it is essential to gather a significant amount of data regarding the diurnal variations in carbon emission.
In this research, nighttime CO2exchange was measured using an automated gas sampling chamber developed by our research team (Li et al., 2020; Peng et al., 2021), and daytime CO2exchange was measured with a dynamic chamber.The objectives of this study are: (1) to quantify and compare diurnal NPP, NEE, and Rs of maize plants at various growth stages under drip and flood irrigation conditions; (2) to analyze the correlation between biological factors and light response parameters under the two irrigation conditions; (3) to compare the advantages and disadvantages of the two irrigation methods, by considering CO2emission, crop growth, and yield.
2 Materials and methods
2.1 Site description
The experiment was conducted at the Science and Technology Experimental Station in Xingongzhong Town (41°05′16′′N, 108°03′50′′E), Wuyuan County, Bayannur City, Inner Mongolia Autonomous Region, China (Fig.1), with an elevation of 1102 m.The experimental site is part of the Hetao Irrigation District and has a continental climate characterized by low average annual rainfall (Zhao et al., 2014), which is insufficient to meet the crop growth requirements (Li et al., 2021b).Soil analysis (including soil physical and chemical parameters) at the experimental site revealed that the topsoil layer (0.00-30.00 cm) had a slightly alkaline irrigation-silted soil, with a pH value of 8.3.The organic matter, nitrogen, and carbon concentrations were 17.82, 0.80, and 27.15 g/kg, respectively.The soil bulk density and water capacity were 1.4 g/cm3and 28%, respectively.

Fig.1 Distribution of irrigation canals in the Hetao Irrigation District and the location of experimental site
2.2 Experimental design
2.2.1 Local corn cultivation requirements The research object of this study was the local conventional spring maize (''Xianyu 1225'').The agronomic requirements for plant spacing of corn in the area are illustrated in Figure 2.The plant spacing of maize is 0.20 m; and the wide rows and narrow rows are alternate set, in which the wide row spacing is 0.80 m and the narrow row spacing is 0.40 m.To reduce evaporation and increase temperature, local cultivation requirements also involve the use of plastic mulch in narrow rows, and the width of plastic film is 0.50 m.By conducting surveys on local irrigation practices, as well as aligning with the literature data on commonly used irrigation schedules in this region (Dong et al., 2018; Wei et al., 2019, 2021), we established an irrigation schedule for this study (Fig.3).For flood irrigation, three irrigation events were conducted during the entire growth period: the seedling stage (approximately 7 d after sowing, lasting for 25 d and covering the period from emergence to 5-leaf stage), the jointing stage (lasting approximately 25 d,occurring from mid-July to early August and covering the 5-9 leaf stage), and the tasseling stage(approximately two months after sowing, lasting approximately 20 d).For drip irrigation,groundwater was used as the water source, and six irrigations (approximately once every two weeks) were performed throughout the growth period.Base fertilizer was applied before sowing(3 May) and was top-dressed once during the reproductive growth period.

Fig.2 Schematic diagram showing the experimental fields with drip irrigation (a) and flood irrigation (b)
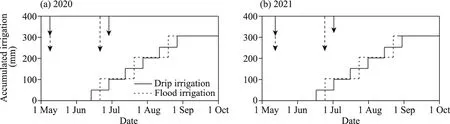
Fig.3 Irrigation and fertilization schedule in 2020 (a) and 2021 (b).The solid arrow represents the fertilization time of drip irrigation and the dotted line arrow represents the fertilization time of flood irrigation.
2.2.2 Requirements for maize planting and management at the experimental site
A schematic diagram of the experimental design is outlined in Figure 3, covering an area of 1.00 hm2.Flood irrigation was provided to one half of the experimental site, and drip irrigation was provided to the other half.An isolation belt was set between flood irrigation and drip irrigation zones to prevent interaction between the two irrigation methods.For drip irrigation, one drip irrigation pipe supplied water for two rows of maize, and this pipe was placed in the middle of the narrow row (Fig.2a).Flood irrigation provided water directly from the Yellow River through canal valves.Both irrigation methods employed in the experimental site adhered to local agricultural irrigation practices.The precise irrigation schedule and quantities are shown in Figure 3.The basal fertilizer applied included urea, diammonium phosphate, and potassium sulfate, and the application amounts were 375, 375, and 225 kg/hm2, respectively.In June, top-dressing with urea (150 kg/hm2) was carried out.In 2020, the sowing time was on 7 May (day of year(DOY)128) and the harvest time was on 25 September (DOY269), with a total growth length of 141 d.In 2021, the sowing time was on 9 May (DOY129) and the harvest time was on 28 September 28 (DOY271), with a growth length of 142 d.
2.3 Experimental data measurement
2.3.1 Microclimate
The main climatic changes, including air temperature, air humidity (HOBO U23-001, Onset Computer Corp, Massachusetts, the USA), and photosynthetically active radiation (PAR) (HOBO S-LIA-M003, Onset Computer Corp, Massachusetts, the USA) were measured at a meteorological station located near the experimental site.These data were recorded by a recorder (HOBO H21-USB, Onset Computer Corp, Massachusetts, the USA) every minute.Additionally, soil temperature and volumetric soil water content (TDR-315L, Acclima, Meridian, Idaho, the USA) at the topsoil (10.00 cm) were measured.The volumetric soil water content was measured every 5 min, and averaged and logged every 30 min using a data logger (CR3000, Campbell, Logan, Utah,the USA).Five TDR-315L sensors were deployed in each irrigation zone to calculate the average soil temperature and volumetric soil water content of the corresponding area.Additionally, a rain gauge was used to measure the rainfall each time.
2.3.2 Measurement of soil and maize CO2flux during nighttime
At night, the closed static chamber method was used to measure the CO2flux of soil and maize ecosystem.Figure 4a shows the static chamber used for measuring the CO2flux in maize plants.The length and width of the static chamber are both 0.54 m.The chamber has two different heights of 0.54 m and 1.10 m.The total height of chamber was increased by superimposing one chamber over another to measure the maize plants with different heights.During nighttime, the chamber can accurately control the opening and closing of lid.When the static chamber is closed, the temperature- and humidity-adjusting device works automatically to adjust the temperature and humidity in the chamber.And after the chamber is closed, the gas sampling device will automatically collect gas samples at 0, 5, 10, and 15 min.Subsequently, the chamber automatically opens following the collection of the four gas samples.This cyclic gas collection process repeats every 2 h.CO2flux measurements were conducted between 22:00 and 04:00 (Beijing time).The working principle and mode of chamber have already been described by Wachiye et al.(2021) and Yang et al.(2021).The collected gas was assessed in laboratory using gas chromatography(GC-2010PLUS, Shimadzu, Kyoto, Japan).The static chamber method was also adopted for measuring soil CO2flux during nighttime, and its gas collection and measurement methods were similar to those for maize CO2flux.The chamber's length, width, and height for soil CO2flux measurement are 0.36,0.36, and 0.36 m, respectively.
2.3.3 Measurement of soil and maize CO2flux during daytime
The chamber used to measure the maize CO2flux during daytime was similar to that used during nighttime.However, the dynamic chamber method was used to measure the maize CO2flux (Fig.4b).An infrared CO2gas analyzer (TD600-SH-B; Beijing Tiandi Shouhe Tech Development Co.,Ltd., Beijing, China) was used to extract the gas directly from the chamber to measure the change in gas concentration, after which the measured gas returned to the chamber.In the dynamic chamber method, a set of CO2flux data could be measured after the chamber was closed for 3-5 min, reducing physiological effects on crops due to chamber sealing.To avoid an excessive increase in temperature in the chamber, ice was placed on the outside of chamber to cool when measuring CO2flux during measurements (Li et al., 2008b).Daytime measurements were recorded from 06:00 to 20:00, at 2 h intervals.Compared with maize, the soil was much less sensitive to temperature, and as maize blocked sunlight, the chamber had minimal effect on soil temperature.Therefore, the daytime measurement method for soil CO2flux was the same as the nighttime measurement method.
2.3.4 Temporal and spatial arrangement of gas collection experiments for measuring CO2flux
The gas collection experiments for measuring CO2flux commenced during the vegetative stages of maize growth, specifically at the 7-leaf stages.It was conducted on sunny days, with gas sampling performed every ten days, and a total of nine gas sampling events were conducted throughout the entire experiment.In each gas sampling event, samples were collected from six different sampling plots in both flood irrigation and drip irrigation zones.Maize plants selected for measurements during gas sampling were chosen randomly after germination, resulting in a total of 54 gas sampling points for both flood irrigation and drip irrigation.During each gas sampling event, samples were collected once every 2 h throughout the day.Before gas sampling,a frame or collar was installed around each maize sample plot a month in advance.Additionally, a soil CO2flux measurement plot, employing the same frame-setting mode and CO2flux measurement timing as those of its corresponding maize sample, was set up near each maize sample plot's location.
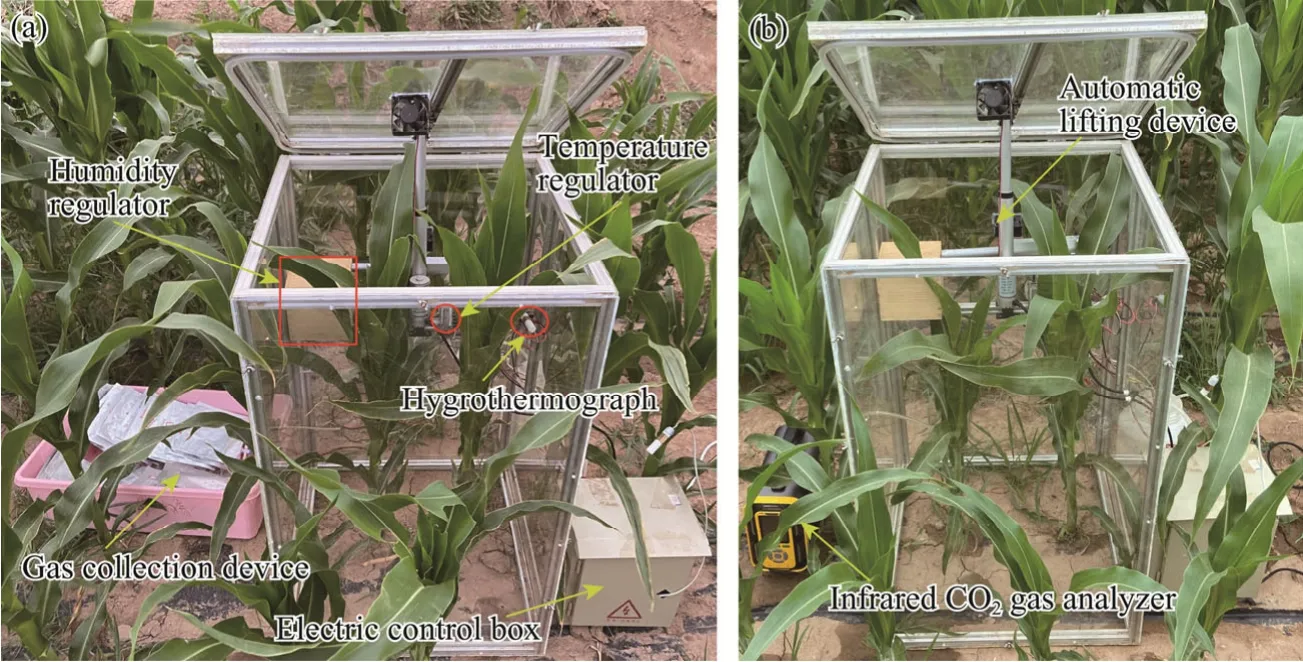
Fig.4 Chambers for measuring greenhouse gas CO2 flux during nighttime (a) and daytime (b)
2.3.5 Measurements of growth parameters and yield of maize crops
Following gas measurement, the aboveground biomass (AGB) of maize in each gas sampling plot was harvested and measured.This involved drying the maize to a constant weight at 85℃ in an oven and then recording the dry matter weight.Simultaneously, the leaf area index (LAI) of maize in each gas sampling event was measured using a plant canopy analyzer (LAI-2200C, LI-COR,Lincoln, Nebraska, the USA).The LAI was calculated by averaging measurements recorded from four points around the gas sampling plot.For yield measurement, six areas were randomly selected in both drip and flood irrigation zones, with each measurement point covering 9.00 m2area.To prevent inaccuracies, particular attention was paid to avoid selecting areas that had been part of gas measurement plots during the selection of yield measurement areas.This precaution was followed because the biomass from these gas measurement plots had already been harvested and could potentially introduce inaccuracies in yield measurements.The maize yield in both drip and flood irrigation zones was evaluated by measuring AGB and yield in the yield measurement areas.The grain was weighed after drying the grains in an oven to a constant weight at 85°C.The harvest index (HI) was determined as the ratio of dry grain weight to total plant dry weight.
2.4 Calculation method for gas emission
2.4.1 CO2flux and net primary productivity (NPP) calculation
The NEE and Rs were measured using the chamber method and calculated using established formulas (Flessa et al., 1998; Polifka et al., 2018):
whereFCO2is the CO2flux (mg CO2/(m2·h));kCO2is the gas constant at 273.15 K (equivalent to 0.536 μg C/μL);Tis the air temperature (K);Vis the chamber volume (L);Ais the chamber surface area (m2); and Δc/Δtis the altered CO2concentration in the chamber (mL/(L·h)).
The NPP was obtained using established formulas (Lindner et al., 2016):
where NPP is the net primary productivity (μmol CO2/(m2·s)); NEE is the net ecosystem CO2exchange (μmol CO2/(m2·s)); and Rs is the soil respiration (μmol CO2/(m2·s)).NEE and Rs are calculated using Equation 1, where NEE or Rs replacesFCO2in Equation 1.
2.4.2 Calculation of net ecosystem CO2exchange (NEE) and NPP of maize ecosystem
In this experiment, the average area occupied by each maize plant was 0.12 m2, determined by the average row spacing of 0.60 m and plant spacing of 0.20 m (plant density in Fig.2).When measuring CO2flux using the chamber method, the average area occupied by each maize plant within the chamber differs from the average area occupied by each maize plant in its natural state.Therefore, net CO2exchange in the chamber (Fchamber) differs from NEE; it is necessary to convertFchamberto NEE.When measuring CO2flux using the chamber method, the total amount of CO2exchange per second in the chamber (Tchamber) was calculated as follows:
whereFchamberis the net CO2exchange in the chamber (μmol CO2/(m2·s)) andAchamber(the region labeled as ''maize chamber'' in Fig.2) is the area of the chamber (m2).
The area occupied by the maize in the chamber under the specified planting density was different from the actual area of the chamber.The difference in the total amount of CO2exchange per second under two different areas wasTsoil(μmol CO2/s), which is calculated as follows:
whereAis the bare soil area occupied by two maize plants at the specified density (m2).
Finally, NEE was calculated as follows:
whereLplantis the plant spacing (0.20 m);Lrowis the row spacing (0.60 m);Lplant×Lrowrepresents the area occupied by a corn plant (''plant density'' as shown in Fig.2); and 2×Lplant×Lrowrepresents the area occupied by two corn plants.After calculating the NEE, the NPP was determined using Equation 2.
2.5 Empirical description of canopy responses
After the measurement of NEE changes in the maize ecosystem during daytime, the leading light-related parameters of maize at the canopy scale were calculated using the Michaelis-Menten model (Peng et al., 2021).The formula used in the model is:
where PAR is the photosynthetically active radiation (μmol photon/(m2·s));αis an approximation of the canopy light use efficiency ((μmol CO2/(m2·s))/(μmol photon/(m2·s)));βis the maximum NEE of ecosystem (μmol CO2/(m2·s)); andγis the average ecosystem respiration during the observation period (μmol CO2/(m2·s)).By utilizing the daytime measurements of NEE and PAR parameters, the values of parametersα,β, andγin Equation 6 can be estimated.These parameters can reflect the carbon exchange capacity of maize ecosystem.Besides,α×β×PAR/(α×PAR+β) for high PAR (PAR=2000 μmol photon/(m2·s) in this study) can be thought of as the average maximum canopy uptake capacity (often noted as (β+γ)2000(μmol CO2/(m2·s))).
3 Results
3.1 Microclimate
The primary meteorological data during the main growth period of maize (experimental period,DOY160-260) are presented in Figure 5.Data of the daily average air humidity and air temperature variations in the two years (Fig.5a) revealed minimal divergence between the daily average temperature lines for the two years, suggesting a small average temperature difference.The daily average temperature remained stable in the early stages of maize growth and later showed a downward trend.Like the average air humidity, the average air temperature for the two years showed minimal divergence.The daily average air humidity showed a gradual increase throughout the maize growth period.Precipitation and soil water content (represented by the parameter of the soil water content at a depth of 10.00 cm (VWC10)) data indicated that VWC10rapidly increased after precipitation, followed by a slow reduction (Fig.5b).In the PAR variation diagram, average PAR during daytime was around 900 μmol photon/(m2·s), but during rainy weather PAR reduced rapidly (Fig.5b and c).
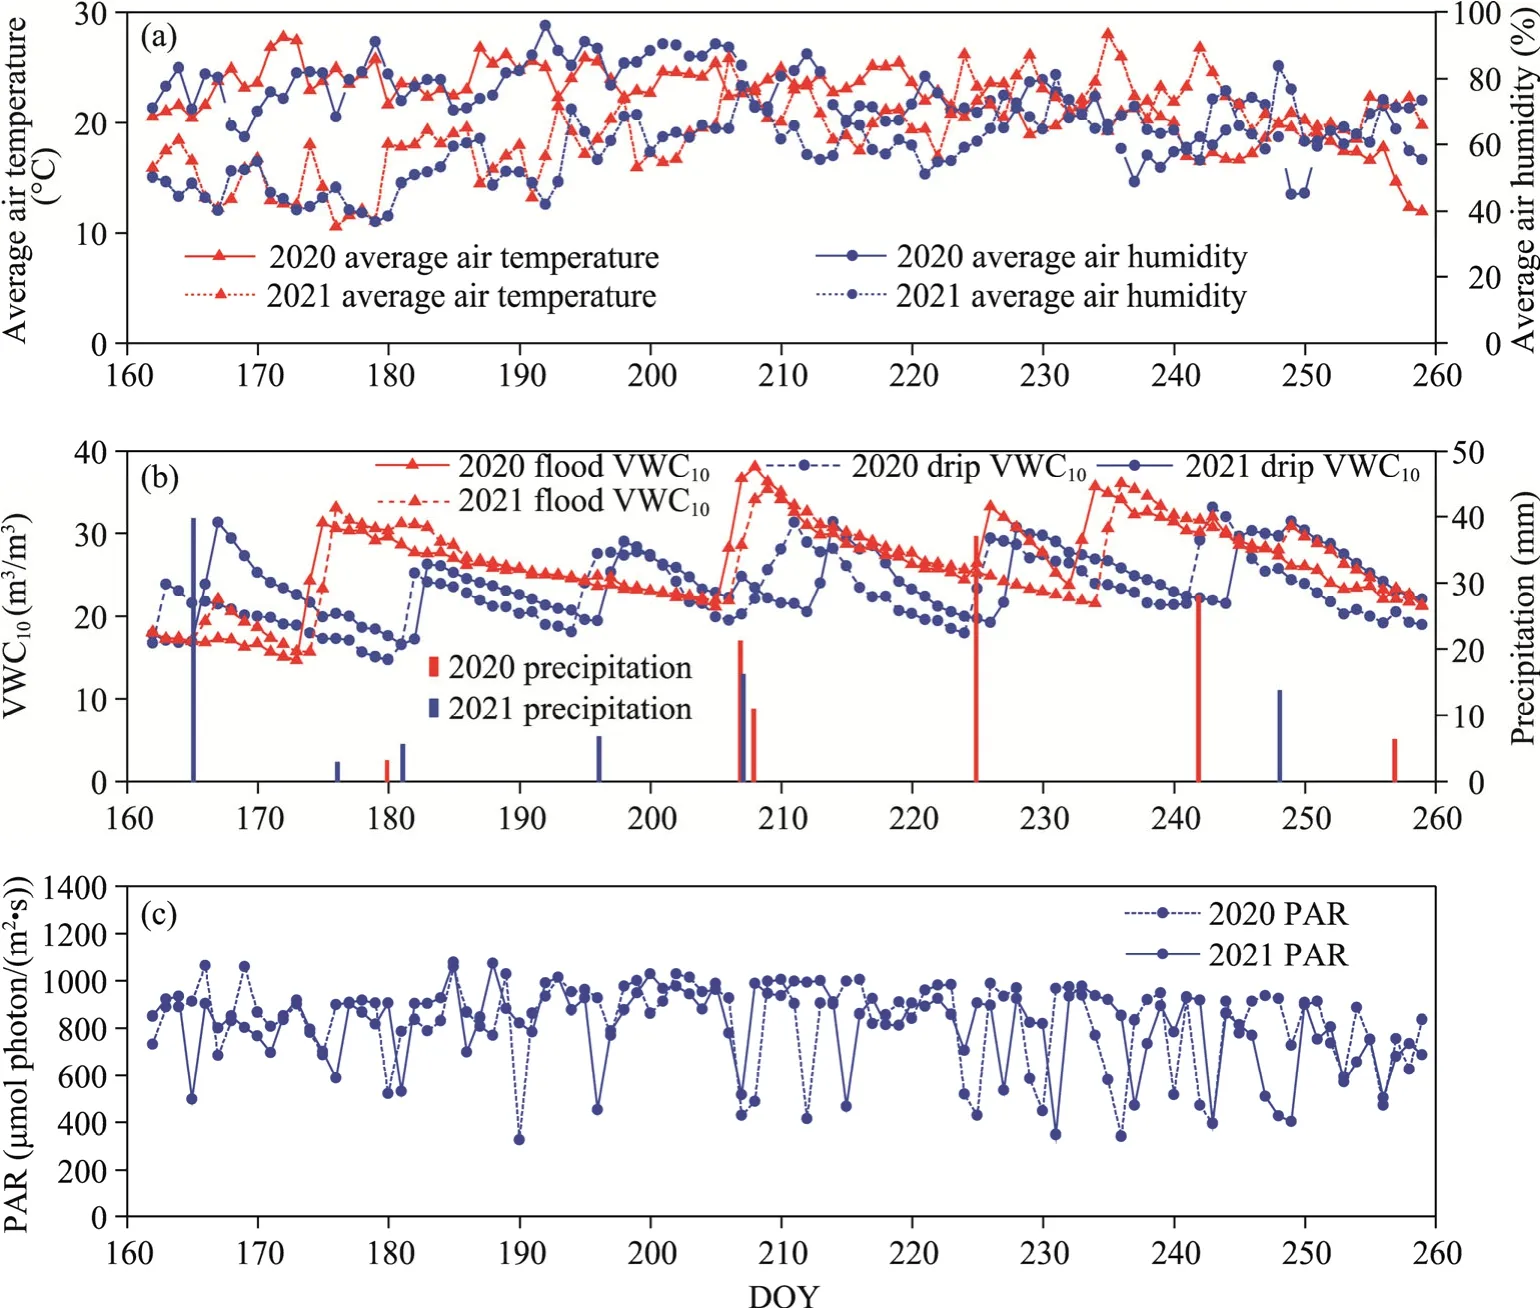
Fig.5 Changes in meteorology, volumetric soil water content, and photosynthetically active radiation (PAR)during the maize growth period in 2020 and 2021.(a), daily average air humidity and average air temperature; (b),precipitation and soil water content at a depth of 10.00 cm (VWC10); (c), average PAR value during daytime.DOY, day of year.
3.2 Daily patterns of CO2 flux under drip and flood irrigation
The gas sample data collected over nine days at each maize growth stage are shown in Figures 6 and 7.Figure 6 presents the data for the year 2020, while Figure 7 presents the data for the year 2021.Daily data included variations in NPP, NEE, and Rs.Regarding NPP, the daily variation range of NPP shifted from small to large and then decreased during the entire growth period.Notably, peak NPP changes occurred in DOY217 and DOY219 in 2020 and 2021, respectively,aligning with the maize 14-leaf stages.Daily NPP variations showed initial increments, followed by declines during daytime, but all the values were positive, indicating that maize has been absorbing carbon and synthesizing their own organic matter during daytime.At nighttime, daily NPP variations showed negative values and tended to reduce gradually, implying that maize breathing at nighttime consumed organic matter and exhaled CO2.Like NPP, the daily NEE variation range during the whole growth period showed the trend of initial increased and then reduced, and the date of the maximum variation range was the same as that for NPP (peak NEE changes occurred in DOY217 and DOY219 in 2020 and 2021, respectively).However, unlike NPP, a negative value of daily NEE variation during daytime suggested that the whole ecosystem was a carbon sink; and a positive value at nighttime indicated that the entire ecosystem was a carbon source.Rs, throughout the growth period, displayed an initial increase followed by reduction.Daily Rs variation also initially increased and then reduced; particularly, Rs initially increased and then decreased during daytime and decreased at nighttime.
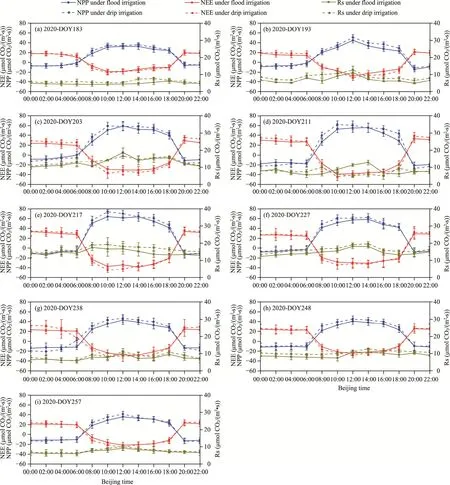
Fig.6 Daily changes in net primary productivity (NPP), net ecosystem CO2 exchange (NEE), and soil respiration (Rs) of maize ecosystem under drip and flood irrigation conditions in 2020.(a), DOY183 in 2020; (b),DOY193 in 2020; (c), DOY203 in 2020; (d), DOY211 in 2020; (e), DOY217 in 2020; (f), DOY227 in 2020; (g),DOY238 in 2020; (h), DOY248 in 2020; (i), DOY257 in 2020.
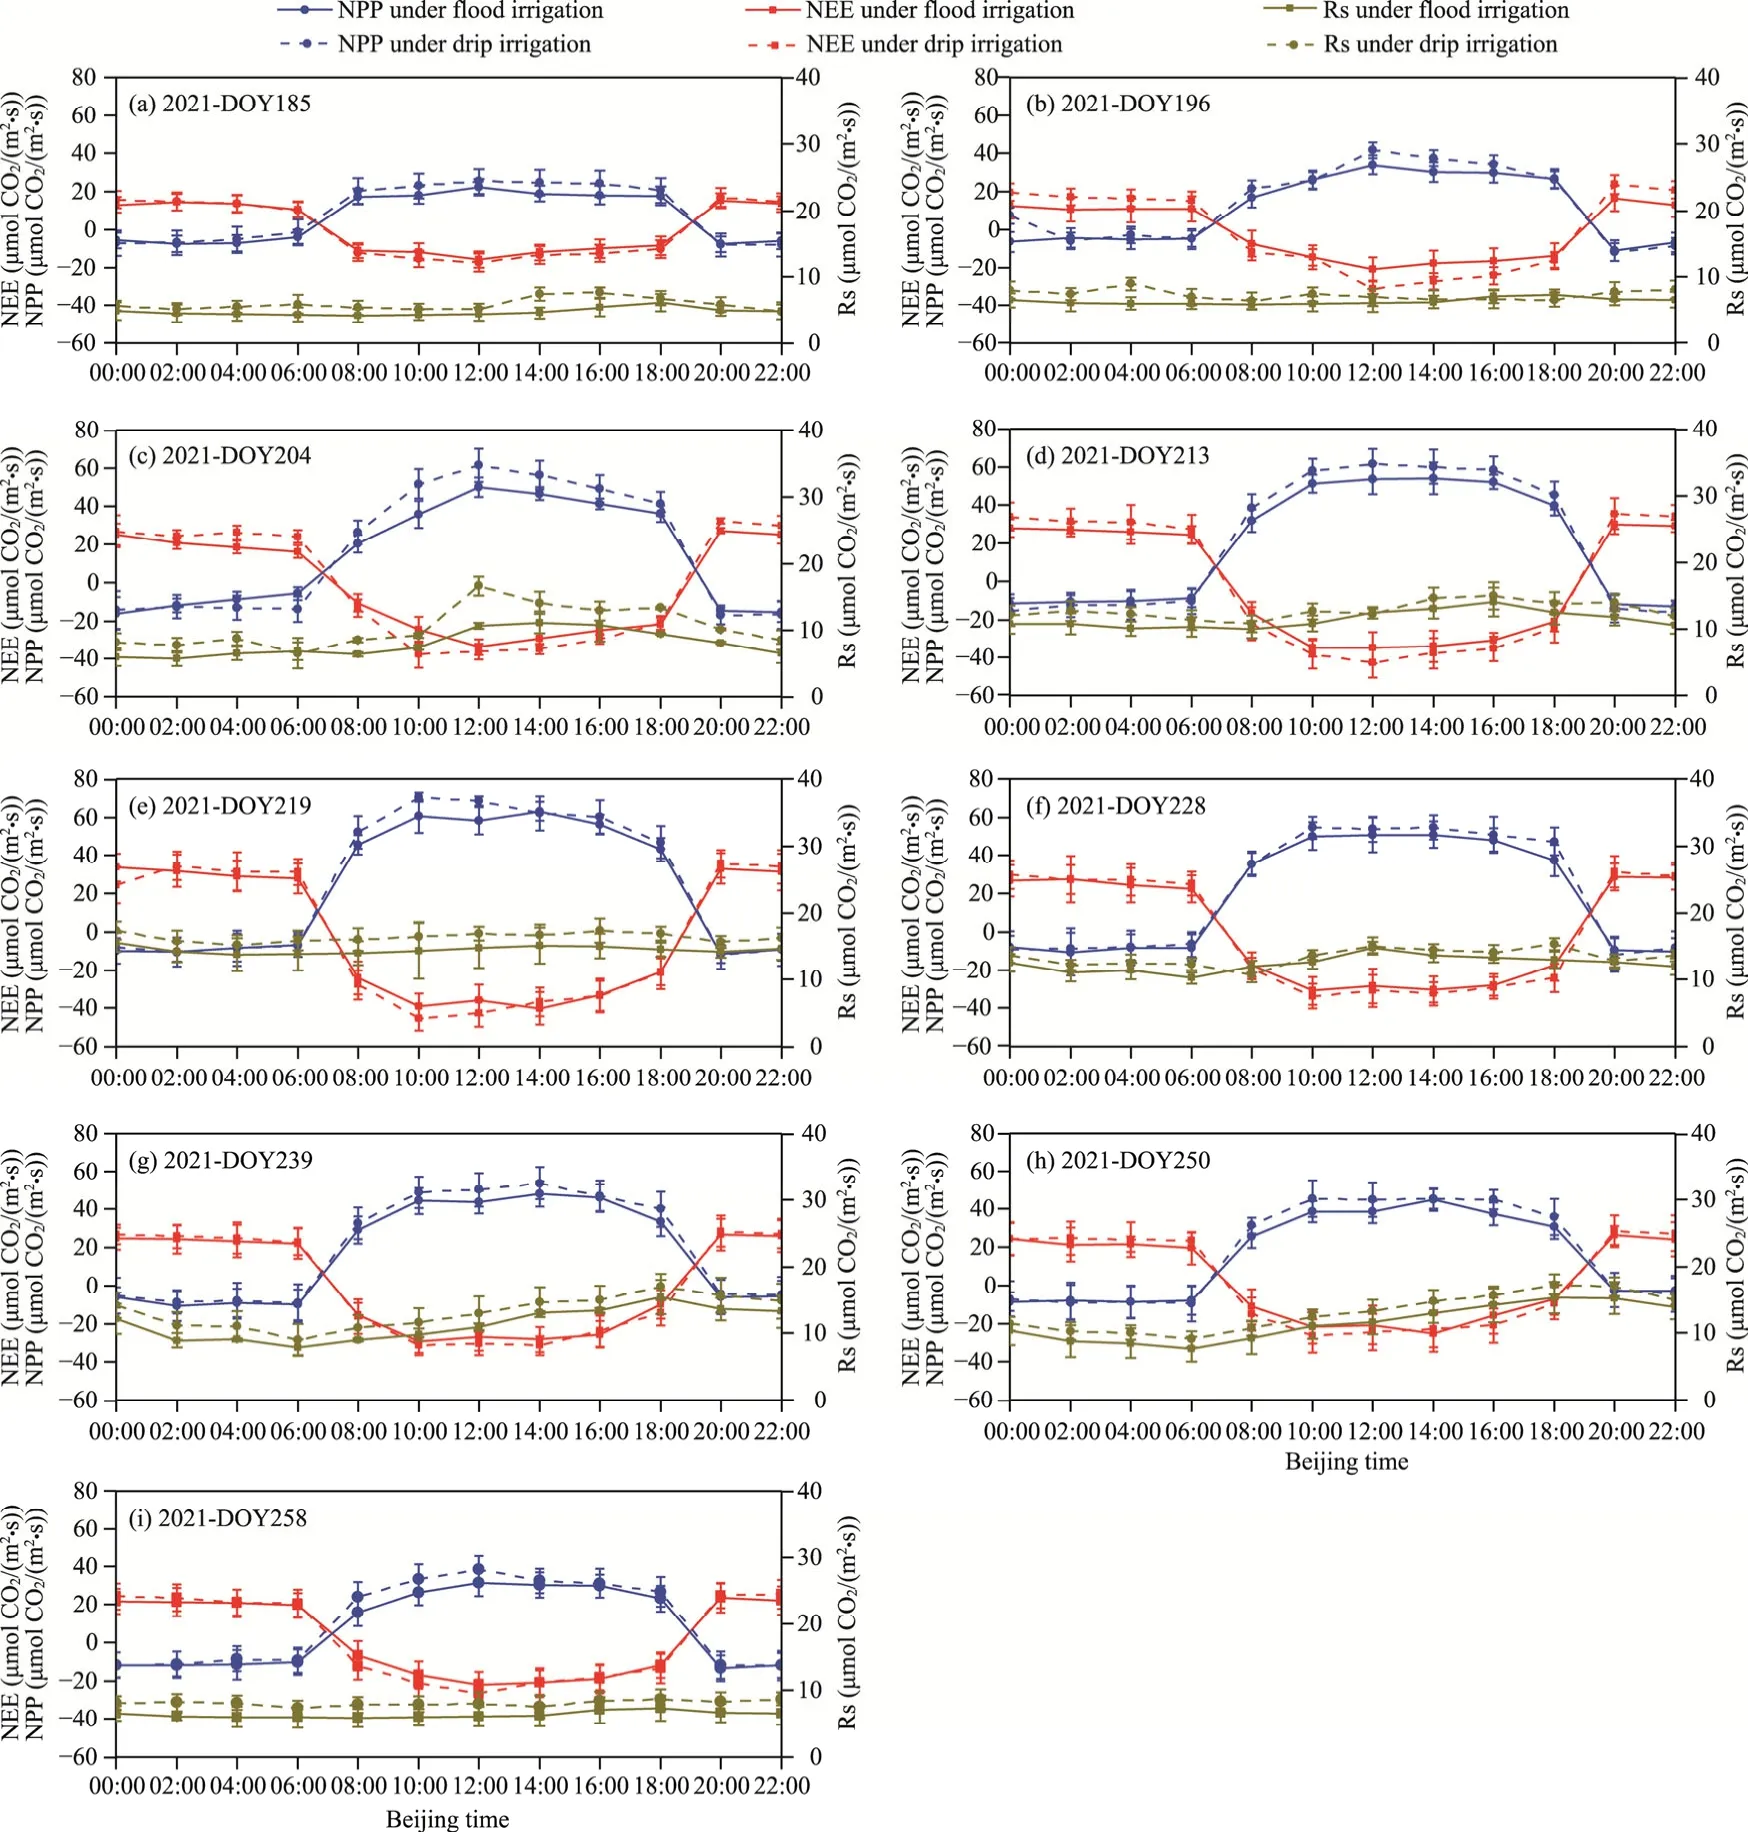
Fig.7 Daily changes in NPP, NEE, and Rs of maize ecosystems under drip and flood irrigation conditions in 2021.(a), DOY185 in 2021; (b), DOY196 in 2021; (c), DOY204 in 2021; (d), DOY213 in 2021; (e), DOY219 in 2021; (f), DOY228 in 2021; (g), DOY239 in 2021; (h), DOY250 in 2021; (i), DOY258 in 2021.
As shown in Figures 6 and 7, the NEE variation curves within the drip irrigation zone during daytime predominantly fall below those of the flood irrigation zone (a smaller negative value of NEE indicates a higher carbon absorption capacity).Additionally, the NPP variation curves in the drip irrigation zone generally showed a trend above those in the flood irrigation zone (a larger positive value of NPP indicates a greater carbon absorption capacity).These findings imply that,compared with the flood irrigation zone, the maize ecosystem in the drip irrigation zone exhibits increased CO2absorption during daytime.Conversely, during nighttime, the NEE variation curves in the drip irrigation zone were mostly positioned above those of the flood irrigation zone (a larger positive value of NEE indicates higher carbon emissions).Additionally, the NPP variation curves in most drip irrigation zone mostly tended to be below those in the flood irrigation zone (a smaller negative value of NPP indicates greater carbon emissions).This indicates that, in contrast to the flood irrigation zone, the maize ecosystem in the drip irrigation zone emits more CO2during nighttime.Regarding Rs, the daily variation curves of Rs in the drip irrigation zone during both daytime and nighttime consistently exceeded those in the flood irrigation zone, signifying higher carbon emissions in the drip irrigation zone than in the flood irrigation zone.
3.3 Relationships between light response parameters and biological factors
The light response parameters for each experimental day,αand (β+γ)2000, were calculated using Equation 6 based on the daily data from Figures 6 and 7.The variations in the data ofαand(β+γ)2000for each experimental day are illustrated in Figure 8.Theαand (β+γ)2000values tended to increase initially, followed by a subsequent decrease.In 2020, peak values for flood irrigation and drip irrigation were observed on DOY211, coinciding with the 14-leaf stage of maize growth period.At this stage, flood irrigation displayedαvalue of 0.106 (μmol CO2/(m2·s))/(μmol photon/(m2·s)) and (β+γ)2000value of 51.344 μmol CO2/(m2·s), while drip irrigation had slightly elevated values, withαat 0.113 (μmol CO2/(m2·s))/(μmol photon/(m2·s)) and (β+γ)2000at 52.743 μmol CO2/(m2·s).Similarly, in 2021, both flood irrigation and drip irrigation reached their peak values on DOY213, aligning with the 14-leaf stage of maize growth period.At this point, flood irrigation exhibitedαvalue of 0.112 (μmol CO2/(m2·s))/(μmol photon/(m2·s)) and (β+γ)2000value of 50.852 μmol CO2/(m2·s), while drip irrigation showed slightly higher values, withαat 0.116(μmol CO2/(m2·s))/(μmol photon/(m2·s)) and (β+γ)2000at 52.451 μmol CO2/(m2·s).Furthermore,as shown in Figure 8, where a consistent trend was observed, for most dates, theαand (β+γ)2000values in the drip irrigation zone surpassed those in the flood irrigation zone.This trend suggests a higher efficiency in light utilization and carbon absorption within the maize canopy in the drip irrigation zone.
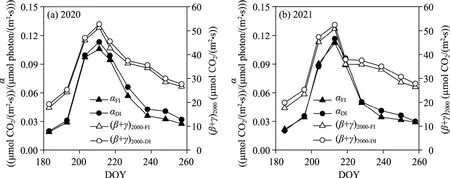
Fig.8 Changes in light response parameters of maize under drip and flood irrigation conditions during the maize growth period in 2020 (a) and 2021 (b).α represents an approximation of the canopy light use efficiency,and (β+γ)2000 represents the average maximum canopy light uptake capacity.αFI, α value under flood irrigation condition; αDI, α value under drip irrigation condition; (β+γ)2000-FI, (β+γ)2000 value under flood irrigation condition;(β+γ)2000-DI, (β+γ)2000 value under drip irrigation condition.
Figure 9 illustrates the relationship between main light response parameters and crop biological parameters.As shown in Figure 9a, there is a strong linear relationship betweenαand LAI.The slope of drip irrigation (0.043) was greater than that of flood irrigation (0.039), indicating that with crop growth, theαparameter of maize under drip irrigation increased more rapidly, thus favoring crop growth.The parameters of (β+γ)2000and AGB demonstrated a clear polynomial relationship (Fig.8b).Comparing the polynomial curves of maize under drip irrigation and flood irrigation, it is apparent that the maximum value of the polynomial curve under drip irrigation surpassed that under flood irrigation.During the late growth stage of maize, compared with flood irrigation, the (β+γ)2000value of maize under drip irrigation was higher at the same AGB.Therefore, with increasing AGB, drip irrigation progressively played a more significant role in promoting crop growth.

Fig.9 Relationship between the main light response parameters and crop biological parameters.(a), relationship between α and leaf area index (LAI); (b), relationship between (β+γ)2000 and aboveground biomass (AGB).
3.4 Effects of drip and flood irrigation on maize yield
The data in Table 1 illustrate AGB, crop growth rate (CGR), HI, yield, and average daily NEE(NEEaverage) during the maize growth stage under drip and flood irrigation conditions across the two-year experiment.Figure 10 demonstrates the variations of AGB and CGR during different maize growth periods in 2020 and 2021.Notably, the AGB of maize kept an increase trend during the whole growth period both in 2020 and 2021, while CGR exhibited an initial increase followed by a decrease throughout the maize growth cycle in both years.Comparing the values in 2020 and 2021, maize AGB and maize CGR were greater under drip irrigation condition than under flood irrigation condition.The yield from drip irrigation was higher than that from flood irrigation.Specifically, in 2021, the yields from drip and flood irrigation were 887.5 and 753.2 g/m2,respectively.In the preceding year, 2020, the yields from drip and flood irrigation stood at 917.7 and 745.3 g/m2, respectively.Evidently, the yield in the drip irrigation zone consistently exceeded that in the flood irrigation zone.Additionally, the HI in the drip irrigation system was higher than that in the flood irrigation system.In 2021, the HI values under drip irrigation and flood irrigation were 0.51 and 0.49, respectively.Similarly, in 2020, the HI values for drip irrigation and flood irrigation conditions were 0.52 and 0.48, respectively.In 2021, the NEEaveragevalues under drip irrigation and flood irrigation conditions were -10.34 and -7.10 g C/(m2·d), respectively; in 2020,the NEEaverageunder drip irrigation and flood irrigation conditions were -10.37 and -6.38 g C/(m2·d), respectively.Therefore, the maize plants cultivated under drip irrigation absorbed more CO2from the atmosphere than flood irrigation.
4 Discussion
4.1 Daily variations in NPP, NEE, and soil respiration (Rs) under drip and flood irrigation conditions
Upon comparing the NPP, NEE, and Rs values of maize under both drip and flood irrigation conditions (Figs.6 and 7), certain commonalities emerged in these parameters.Notably, for both irrigation techniques, the total soil CO2emission displayed an initial increase followed by a subsequent reduction during maize growth.This trend aligns with that reported in a previous study (Zogg et al., 1996), which suggested that, as maize develops, its root system develops,thereby escalating carbon emissions.The roots of crops are the major factors contributing to Rs(Dugas et al., 1999; Zhang et al., 2007).The observed changes in CO2emission were evaluated.Moreover, the range of variation in the daily NPP or NEE showed a pattern of initial increase and subsequent decrease, mirroring the daily fluctuations of maize carbon emission monitored through the eddy covariance technique (Xu et al., 2018).This pattern likely emerged from the growth phase wherein leaf area and biomass begin to increase, and the extent of photosynthesis or respiration increases (Otieno et al., 2009).However, as maize approaches maturation, a senescence phase ensues, leading to a reduction in photosynthesis and respiration rates (Xi et al.,2019).

Table 1 Main biological parameters of maize under drip and flood irrigation conditions in 2020 and 2021
The NPP, NEE, and Rs of maize under both irrigation conditions exist notable differences.Notably, soil CO2emissions are higher under drip irrigation compared to flood irrigation (Figs.6 and 7), which is consistent with the findings by Zhang et al.(2014) and Wei et al.(2021).Despite causing less soil disturbance, drip irrigation paradoxically results in higher CO2emissions than flood irrigation.Pu et al.(2019) suggest that the frequent alternation between dry and wet soil conditions under drip irrigation fosters microbial respiration and activity, thereby intensifying soil CO2flux.In terms of CO2absorption by the maize ecosystem, crops absorb a relatively higher amount of CO2(NEEaverage) under drip irrigation, indicating that within the entire maize ecosystem, drip irrigation promotes greater atmospheric CO2fixation.Drip irrigation, known for its potential to significantly enhance the photosynthesis rate (Wu et al., 2023), inevitably leads to increased CO2fixation.Additionally, by preserving soil aeration, drip irrigation fosters plant root growth, enhancing AGB and leaf area (Leghari et al., 2021).Leaf area plays a crucial role in NEE as it determines the photosynthetic surface area (Limpens et al., 2008), which likely explains why drip irrigation fixes more CO2than flood irrigation.
4.2 Maize growth variables and light response parameters under drip and flood irrigation
Parameterαis a crucial factor that reflects light utilization and is closely associated with crop growth (Otieno et al., 2009).A higherαvalue signifies conditions more conducive to crop growth(Li et al., 2008a).Multiple studies have established a strong correlation between cropαand LAI(Fig.9a).For instance, Lindner et al.(2016) identified a linear relationship of 0.91 betweenαand rice LAI.In this investigation, a similarly high correlation betweenαand LAI was observed(R2=0.85 for drip irrigation andR2=0.83 for flood irrigation).Comparingαand LAI relationships under flood irrigation and drip irrigation, it is evident that maizeαunder drip irrigation is higher at the same LAI level.This finding aligns with previous research (Umair et al., 2019), indicating that drip irrigation has the potential to significantly enhance photosynthesis rates.
The parameter (β+γ)2000is a significant indicator reflecting the maximum production capacity of crops.Peng et al.(2021) revealed a polynomial relationship between the parameter (β+γ)2000and AGB.This study also demonstrated a polynomial relationship between this parameter and AGB (Fig.9b).In the early growth stages, the predominant growth occurred in stems and leaves,with leaves being the primary factor promoting photosynthesis (Otieno et al., 2009).Consequently, (β+γ)2000exhibited an increasing trend.However, during the late growing season,both crop respiration and photosynthesis rates declined (Peng et al., 2021), leading to a reduction in (β+γ)2000.Notably, during the late growing season, the (β+γ)2000parameter for maize under drip irrigation surpassed that under flood irrigation.This study further supports the notion that drip irrigation can significantly enhance photosynthesis rates (Umair et al., 2019).
4.3 Effect of drip and flood irrigation on NEE, aboveground biomass (AGB), and yield of maize
Table 1 depicts the AGB and yield for flood and drip irrigation, and it is evident that under drip irrigation condition, the AGB during each growth period is higher.This outcome is consistent with the research of Umair et al.(2019), which discovered that drip irrigation enhances the photosynthesis rate and stimulates plant root growth.Additionally, these results align with the findings of higher NPP under drip irrigation.NPP, denoting the net CO2uptake by canopy,significantly influences CO2flux into terrestrial biosphere (Ito, 2011; Zhang et al., 2019).The yield under drip irrigation surpasses that under flood irrigation, consistent with the study of Tian et al.(2017), which exhibited a significant increase in maize yield (by 28%) with drip irrigation compared to flood irrigation treatments.Fu et al.(2017) and Leghari et al.(2021) similarly found that drip irrigation improves water conservation and grain yield.This higher yield corresponds with the observed larger CGR (Fig.10) andα(Fig.8) under drip irrigation in this study.
5 Conclusions
This study delves into the carbon exchange and crop growth of maize under drip and flood irrigation conditions in the Hetao Irrigation District to investigate their effects.The findings suggest that drip irrigation accelerates crop growth and development while increasing yield more effectively than flood irrigation.Soil emissions are higher under drip irrigation, yet the ecosystem is more conducive to carbon fixation than under flood irrigation.Consequently, drip irrigation in this region appears more effective in reducing CO2emissions and enhancing production.This research offers valuable insights for decision-making regarding maize irrigation methods in the Hetao Irrigation District in the future.However, it is important to note that this study has yet to consider the potentially significant effects of various trace elements present in the water sources used for these irrigation methods on carbon emissions and crop growth.Investigating the influence of waterborne trace elements on carbon emissions and crop growth represents a crucial avenue for future research.
Conflict of interest
The authors declare that they have no known competing financial interests or personal relationships that could have appeared to influence the work reported in this paper.
Acknowledgements
This study was supported by the Shandong Province Natural Science Foundation Youth Branch (ZR2023QC157),the National Natural Science Foundation of China (51979233), the Key Research and Development Project of Shaanxi Province (2022KW-47, 2022NY-220), and the Heze University Doctoral Research Fund (XY21BS24,XY22BS17).We thank the editors and anonymous reviewers for their useful suggestions on improving the quality of this article.
Author contributions
Conceptualization: LI Chaoqun, HAN Wenting; Data curation: LI Chaoqun, PENG Manman; Methodology: LI Chaoqun; Investigation: HAN Wenting; Formal analysis: LI Chaoqun; Writing - original draft preparation: LI Chaoqun; Writing - review and editing: PENG Manman; Funding acquisition: LI Chaoqun, HAN Wenting, PENG Manman; Supervision: HAN Wenting; Validation: PENG Manman.All authors approved the manuscript.
- Journal of Arid Land的其它文章
- Exploring groundwater quality in semi-arid areas of Algeria: Impacts on potable water supply and agricultural sustainability
- Runoff change in the Yellow River Basin of China from 1960 to 2020 and its driving factors
- A CMIP6-based assessment of regional climate change in the Chinese Tianshan Mountains
- Influence of varied drought types on soil conservation service within the framework of climate change:insights from the Jinghe River Basin, China
- Land use and cover change and influencing factor analysis in the Shiyang River Basin, China
- Effects of landscape fragmentation of plantation forests on carbon storage in the Loess Plateau, China