
Influence of varied drought types on soil conservation service within the framework of climate change:insights from the Jinghe River Basin, China
2024-02-26 09:11BAIJizhouLIJingRANHuiZHOUZixiangDANGHuiZHANGChengYUYuyang
Journal of Arid Land 2024年2期
BAI Jizhou, LI Jing*, RAN Hui, ZHOU Zixiang, DANG Hui, ZHANG Cheng, YU Yuyang
1 School of Geography and Tourism, Shaanxi Normal University, Xi'an 710119, China;
2 College of Geomatics, Xi'an University of Science and Technology, Xi'an 710054, China
Abstract: Severe soil erosion and drought are the two main factors affecting the ecological security of the Loess Plateau, China.Investigating the influence of drought on soil conservation service is of great importance to regional environmental protection and sustainable development.However, there is little research on the coupling relationship between them.In this study, focusing on the Jinghe River Basin,China as a case study, we conducted a quantitative evaluation on meteorological, hydrological, and agricultural droughts (represented by the Standardized Precipitation Index (SPI), Standardized Runoff Index (SRI), and Standardized Soil Moisture Index (SSMI), respectively) using the Variable Infiltration Capacity (VIC) model, and quantified the soil conservation service using the Revised Universal Soil Loss Equation (RUSLE) in the historical period (2000-2019) and future period (2026-2060) under two Representative Concentration Pathways (RCPs) (RCP4.5 and RCP8.5).We further examined the influence of the three types of drought on soil conservation service at annual and seasonal scales.The NASA Earth Exchange Global Daily Downscaled Projections (NEX-GDDP) dataset was used to predict and model the hydrometeorological elements in the future period under the RCP4.5 and RCP8.5 scenarios.The results showed that in the historical period, annual-scale meteorological drought exhibited the highest intensity,while seasonal-scale drought was generally weakest in autumn and most severe in summer.Drought intensity of all three types of drought will increase over the next 40 years, with a greater increase under the RCP4.5 scenario than under the RCP8.5 scenario.Furthermore, the intra-annual variation in the drought intensity of the three types of drought becomes smaller under the two future scenarios relative to the historical period (2000-2019).Soil conservation service exhibits a distribution pattern characterized by high levels in the southwest and southeast and lower levels in the north, and this pattern has remained consistent both in the historical and future periods.Over the past 20 years, the intra-annual variation indicated peak soil conservation service in summer and lowest level in winter; the total soil conservation of the Jinghe River Basin displayed an upward trend, with the total soil conservation in 2019 being 1.14 times higher than that in 2000.The most substantial impact on soil conservation service arises from annual-scale meteorological drought, which remains consistent both in the historical and future periods.Additionally, at the seasonal scale, meteorological drought exerts the highest influence on soil conservation service in winter and autumn, particularly under the RCP4.5 and RCP8.5 scenarios.Compared to the historical period,the soil conservation service in the Jinghe River Basin will be significantly more affected by drought in the future period in terms of both the affected area and the magnitude of impact.This study conducted beneficial attempts to evaluate and predict the dynamic characteristics of watershed drought and soil conservation service, as well as the response of soil conservation service to different types of drought.Clarifying the interrelationship between the two is the foundation for achieving sustainable development in a relatively arid and severely eroded area such as the Jinghe River Basin.
Keywords: meteorological drought; hydrological drought; agricultural drought; soil conservation service; Variable Infiltration Capacity (VIC) model; Revised Universal Soil Loss Equation (RUSLE); Jinghe River Basin
1 Introduction
The frequent occurrence of extreme climate under the backdrop of global warming disrupts the distribution of water resources, posing a formidable threat to the global ecological environment,particularly in arid and semi-arid areas (Leal et al., 2021).Drought is characterized by an imbalanced distribution of water resources resulting from insufficient precipitation in a region(Yang et al., 2005).Within the context of climate change, drought has inflicted incalculable and potentially irreversible harm to ecosystems (Fensham et al., 2009).The influence of drought on ecosystems is far-reaching and has gradually become a research focus (Gampe et al., 2021).Drought alters the structural and functional attributes of dryland ecosystems, including microbial communities, plant productivity, and nutrient cycling processes (Huang et al., 2015).Berdugo et al.(2020) evaluated 20 ecosystem functions and attributes responsive to worsening drought,finding that drought led to an abrupt decline in various ecosystem attributes, including vegetation productivity, soil fertility, vegetation coverage, and vegetation richness.Drought is considered the most significant hazard resulting from climate change, necessitating urgent drought monitoring and assessment (Carle, 2015).The drought index represents the most commonly utilized method for drought monitoring (Cao et al., 2023).It can be categorized into meteorological, hydrological,agricultural, and socio-economic indices, depending on the type of drought (Maity et al., 2016).The meteorological drought index primarily relies on precipitation, evapotranspiration, and other data to characterize the scarcity of water resulting from insufficient rainfall (Zhou et al., 2013),such as the Standardized Precipitation Index (SPI).The hydrological drought index relies on calculations of runoff and groundwater from hydrological models such as the Soil and Water Assessment Tool (SWAT) to depict the decrease in rivers or reservoirs resulting from insufficient surface water or groundwater (Zhang et al., 2019), such as the Standardized Runoff Index (SRI).The agricultural drought index is mainly related to factors such as soil moisture and vegetation coverage, and describes the phenomenon where crops are unable to grow normally due to insufficient soil moisture (Pan et al., 2023), such as the Standardized Soil Moisture Index (SSMI).The socio-economic drought index describes the phenomenon of water scarcity resulting from human activities (Kimwatu et al., 2021), such as the Socio-economic Drought Index (SEDI).Scholars at home and abroad have constructed hundreds of drought indices, but common drought indices only target a certain type of drought, and there are significant differences in the statistical methods used and the applicable spatiotemporal scales (Wang et al., 2022).Consequently, it is imperative to explore methods to monitor multiple drought types in a region simultaneously.
In addition to drought, severe soil erosion represents another significant threat in arid and semi-arid areas (Terwayet Bayouli et al., 2003).Climate change has resulted in an increased frequency of droughts, thereby exacerbating soil erosion (Ciampalini et al., 2020).Soil conservation service refers to the ability of ecosystems to control soil erosion and retain sediment (Masroor et al.,2022).As an essential regulating service in ecosystems, it can provide a healthy environment for soil formation and plant growth and is an important guarantee to prevent land degradation and reduce the risk of flooding (Liu et al., 2019).Currently, there exists a unified quantitative indicator in the academic community that quantifies soil conservation service as the difference between potential (maximum soil erosion without surface vegetation and soil conservation measures) and actual soil erosion (Zheng et al., 2021).The concrete calculation process is mostly based on soil erosion models, such as the Revised Universal Soil Loss Equation (RUSLE), Integrated Valuation of Ecosystem Services and Trade-offs (InVEST), and SWAT models.Among these models, the RUSLE model holds the distinction of being the most widely used (Olorunfemi et al., 2020).It contains the basic elements involved in the soil erosion process and is suitable for steep and undulating terrain, making it advantageous in soil conservation assessment.
Drought has produced varying degrees of impact on different ecosystem services (Pravalie et al.,2014) and has resulted in a decline in the quality of ecosystem services provided to humans(Berdugo et al., 2020).However, there is limited research on the effects of drought on soil conservation service.Han et al.(2019) applied the Pearson's correlation coefficient to examine the effects of drought on freshwater ecosystem services at different time scales.The findings indicated that inter-annual and seasonal droughts resulted in decreased water yield and soil conservation in Guizhou Province, China.Bai et al.(2021) employed the grey relation analysis to investigate the relationship of soil conservation service with drought, vegetation, and other factors, and the results showed that soil conservation service was closely related to drought, followed by vegetation.In summary, the existing research mainly concentrates on the qualitative analysis of the relationship between drought and soil conservation service, yet it lacks the precise expression of quantitative analysis.In addition, the prediction research under future scenarios also needs to be explored.
The Loess Plateau in China is regarded as a highly susceptible region to the impacts of climate change and possesses a fragile ecological environment, and the Jinghe River Basin is a typical basin in the Loess Plateau.Is there a link between climate change-related droughts and ecologically relevant soil conservation service in the area? Does this relationship exhibit variations across different temporal and spatial scales? Consequently, this study takes the Jinghe River Basin as a study target to investigate the characteristics of droughts at different time scales based on meteorological, hydrological, and agricultural drought indices and to predict the effects of varied drought types on soil conservation service under two Representative Concentration Pathways (RCPs) (RCP4.5 and RCP8.5).The main research contents included: (1) constructing a Variable Infiltration Capacity (VIC) model and a generalized standardized index (SI) applicable to the Jinghe River Basin; (2) assessing the temporal and spatial variability of drought at seasonal and annual scales in the Jinghe River Basin; (3) estimating soil conservation service at different time scales using the RUSLE model; and (4) assessing the impacts of drought on soil conservation service.Elucidating these matters will aid managers in comprehending the pivotal challenges that impede regional development and in devising focused remedies.
2 Materials and methods
2.1 Study area
The Jinghe River Basin (106°14′-108°42′E, 34°46′-37°19′N; 219-2908 m; Fig.1) covers an area of 45,421 km2.Situated in a transition zone between semi-arid and subhumid, this area experiences high evaporation rates with an average annual temperature of approximately 8°C.The average annual precipitation in the basin ranges from 350 to 600 mm, exhibiting significant inter-annual variation and uneven spatial and temporal distributions, gradually decreasing from south to north, with locally heavy rainfall concentrations.The Jinghe River Basin is situated in an area characterized by a high incidence of drought and frequently experiences disaster events.The dominant soil types in the basin are loessal soil and heilu soil, with the thickness of the loess varying from 50 to 250 m.These soils have a loose structure with numerous voids, making them highly susceptible to erosion and easily dispersed by flowing water, resulting in soil erosion.
2.2 Data sources
This study utilized various datasets including the Digital Elevation Model (DEM), land use, soil data, Normalized Difference Vegetation Index (NDVI), daily runoff, meteorological observation data, NASA Earth Exchange Global Daily Downscaled Projections (NEX-GDDP) dataset, and vegetation library file.Detailed information regarding the data sources can be found in Table 1.These data were uniformly preprocessed by projection transformation, clipping, and resampling in ArcGIS 10.2.The arithmetic mean of daily runoff observation data for each month was taken as the monthly average runoff (m3/s).This serves as runoff validation data for the VIC model.
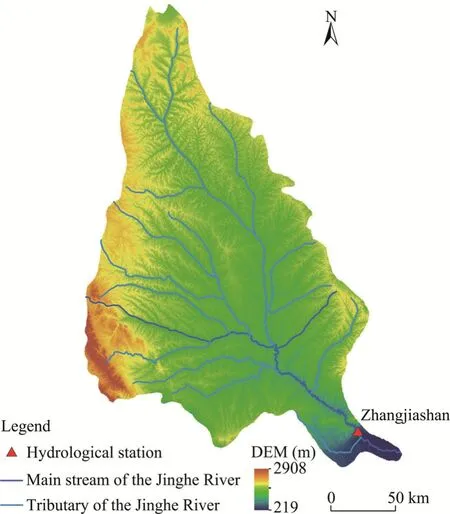
Fig.1 Overview of the Jinghe River Basin based on the Digital Elevation Model (DEM)

Table 1 Detailed description of data used in the study
Accurate climate projection models are crucial for assessing the influence of regional climate change and disaster warnings (Khan et al., 2021).To enhance the simulation and prediction capabilities of climate models, researchers have undertaken extensive studies utilizing advanced technologies and methodologies, such as the Coupled Model Intercomparison Project 5 (CMIP5)(Zeng et al., 2020).The NEX-GDDP dataset is comprised of downscaled climate scenarios for the globe that are derived from the General Circulation Model (GCM) runs conducted under the CMIP5 and across two of the four greenhouse gas emission scenarios known as RCP4.5 and RCP8.5.This dataset includes data on historical climate simulations and future climate projections.In this study, historical data (1976-2005) were utilized to validate the suitability of the GCMs, and future data (2026-2060) were employed to predict drought conditions and assess soil conservation service.Multi-model ensembles can improve the simulation capability and are widely used for the simulation and prediction of future climate (Wu et al., 2018).This study adopted multi-model ensemble of CNRM-CM5, INMCM4, MIROC-ESM, and MRI-CGCM3 models in the NEX-GDDP dataset.The correlation coefficients of monthly precipitation,minimum and maximum temperatures calculated using the multi-model mean and the meteorological observation data were found to be 0.78, 0.99, and 0.98, respectively (Fig.S1).These results demonstrate that the selected multi-model ensemble is capable of accurately modeling and predicting the hydrometeorological features of the study area.
Considering the characteristics of the VIC model and the hydrological features of the Jinghe River Basin, this study adopted a spatial resolution of 0.03°×0.03° to effectively model the basin,resulting in the division of 4967 grid cells.Meteorological data for individual grid cells were obtained through inverse distance weight interpolation methods, utilizing both meteorological station data and NEX-GDDP dataset.Soil data were acquired from the Harmonized World Soil Database (HWSD) and underwent uniform classification using the FAO-90 classification system.Subsequently, the dominant soil type within each grid cell was determined based on its percentage coverage, and the soil parameter of the dominant soil type was taken as the soil attribute of the specific grid cell.The vegetation library file, containing the physical and chemical property parameters corresponding to each vegetation type, was acquired from the official website of the VIC model (https://vic.readthedocs.io/en/master/), adhering to the default settings.
2.3 Materials and methods
2.3.1 Construction of the VIC model
The VIC model, initially proposed by Wood et al.(1992), consisted of only two soil layers(VIC-2L).Subsequently, researchers incorporated an additional surface layer responsive to rainfall factor, forming the current VIC-3L model (Xie et al., 2003).The VIC model, a large-scale hydrological model, incorporates the soil water retention curve at the grid scale to account for spatial heterogeneity in soil infiltration capacity (Liang et al., 2003).Furthermore, it accommodates both infiltration and saturation excess runoff, enhancing its versatility (Xie et al.,2003).This model is easily integrated with the climate models and finds extensive applications in assessing the effects of human activities and climate change on the water cycle (Mahto and Mishra, 2020).Therefore, this study investigated drought conditions in the Jinghe River Basin based on the results of the VIC model simulations.The VIC model was operated by gridding the study area and simulating internal runoff processes based on meteorological (daily precipitation,temperature, and wind speed), soil (soil type and physical-chemical properties), and vegetation type (derived from land use data) data for each grid cell.Moreover, the eight-direction (D8)algorithm was used to define flow direction during the operation of the hydrological routing model.
The Nash-Sutcliffe efficiency (NSE), relative error (RE), and Kling-Gupta efficiency coefficient(KGE) are widely acknowledged indicators used to assess the accuracy of hydrological model simulations.Consequently, these three indicators were chosen to evaluate the performance and accuracy of the VIC model results.Due to the challenges associated with obtaining runoff data,the model was calibrated using measured data from a restricted period (preheating period:2000-2005; calibration period: 2006-2010; validation period: 2011-2015).The calibrated parameters are presented in Table 2.Figure 2 depicts the accuracy evaluation of the runoff simulation data from the Zhangjiashan Hydrological Station in the Jinghe River Basin.Our results indicated that the NSE between the simulated and observed values exceeded 0.71, the RE was below 0.01, and the KGE surpassed 0.86 during the calibration period; while for the validation period, the NSE between the simulated and observed values exceeded 0.83, the RE was below 0.05, and the KGE surpassed 0.89.According to these statistical evaluation results, we concluded that the VIC model can indeed reasonably represent the characteristics of hydrological processes in the Jinghe River Basin.Therefore, the outputs (e.g., runoff and soil moisture) of the calibrated VIC model are reliable and reasonable for studying drought (Zhang et al., 2017).The constructed VIC model was deemed applied to the Jinghe River Basin.Moreover, similar to recent studies(e.g., Zhang et al., 2023), this study assumes that a model calibrated with observed data from a limited period remains applicable across a broader temporal scope.
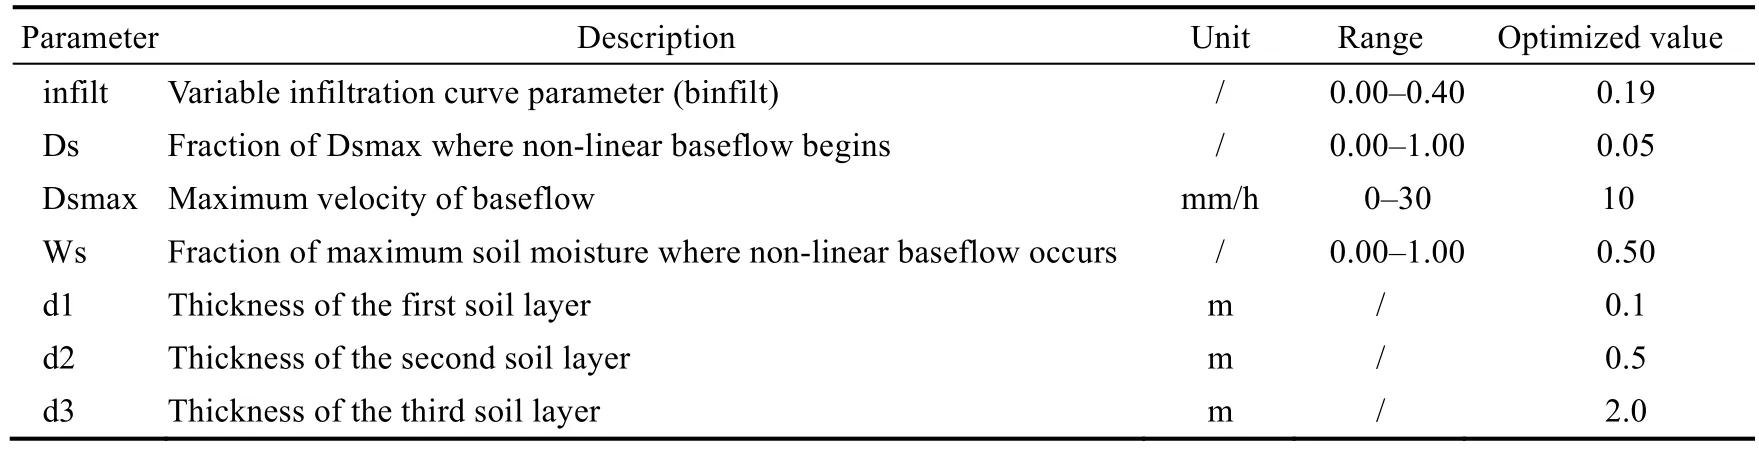
Table 2 Main parameters and optimized values of the Variable Infiltration Capacity (VIC) model

Fig.2 Comparison of simulated and observed monthly runoff as well as precipitation at Zhangjiashan Hydrological Station from 2006 to 2015
2.3.2 Drought index calculation based on the VIC model
Choosing a suitable drought index is critical for accurately assessing and predicting the drought(Khatiwada and Pandey, 2019).The construction of drought indices needs to select an appropriate statistical method based on the characteristics of different variables.The SPI and SRI use Gamma distribution probability to calculate the drought characteristics (Zhou et al., 2013), while the SSMI and Standardized Precipitation Evapotranspiration Index (SPEI) employ log-logistic probability distribution (Shi et al., 2015).The spatiotemporal scales of different drought indices are also inconsistent.The SPI, SRI, and SSMI allow for drought calculation at different time scales, whereas the Palmer Drought Severity Index (PDSI) and Crop Moisture Index (CMI) have relatively fixed time scales (Mu et al., 2013).To compensate for the large uncertainty caused by Gamma distribution due to different optimal distributions of hydrological elements, Farahmand and AghaKouchak (2015) suggested a generalized SI according to a non-parametric distribution(i.e., Gringorten plotting position).This method uses an empirical distribution function to standardize the marginal probabilities of drought-related variables, including soil moisture,precipitation, and surface runoff.The SI does not require predetermined parameter distribution functions, nor does it necessitate parameter estimation or fit evaluation.Furthermore, when examining multiple drought types simultaneously, SI can mitigate conflicting statistical assumptions of drought indices and ensure comparability across different drought types at both spatial and temporal scales.
Therefore, following the method proposed by Farahmand and AghaKouchak (2015), this study calculated three types of drought indices (SPI, SRI, and SSMI) using the SI.The SPI, SRI, and SSMI correspond to meteorological, hydrological, and agricultural droughts, respectively.The occurrence and severity of drought events were determined utilizing the classification criteria listed in Table 3 (Administration of Quality Supervision, Inspection and Quarantine of People's Republic of China and Standardization Administration of China, 2017).
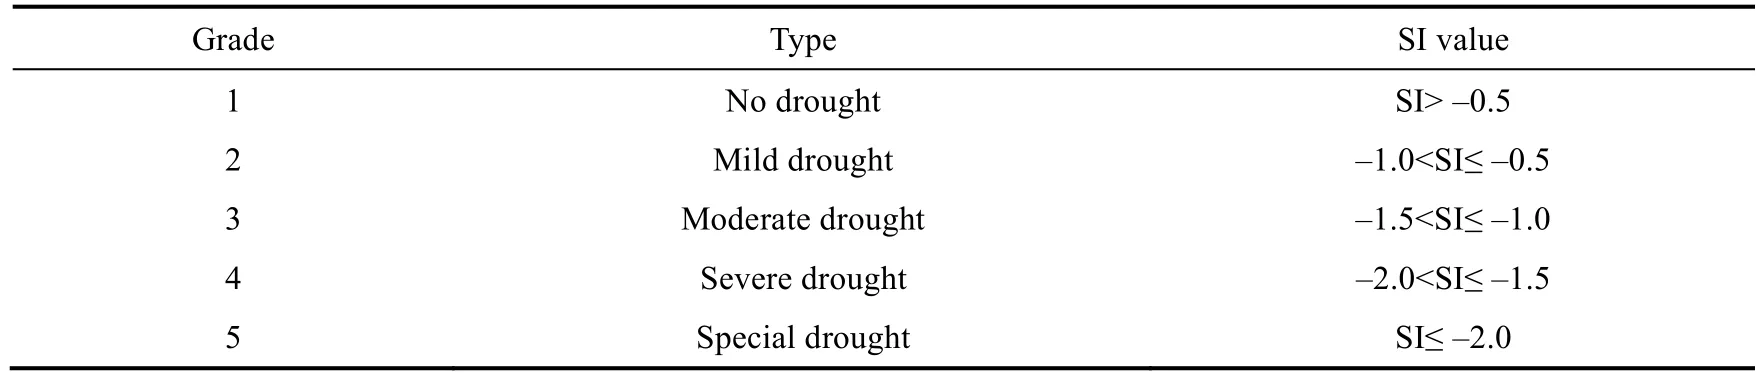
Table 3 Drought classification criteria based on the standardized index (SI)
For this study, drought indices at the 3- and 12-month scales were selected to characterize seasonal-scale and annual-scale droughts, respectively.First, based on precipitation and VIC model simulations of runoff and soil moisture, we calculated the SI values of SPI, SRI, and SSMI from 1981 to 2019.Additionally, meteorological data under the two future scenarios (RCP4.5 and RCP8.5) were also input into the VIC model, enabling the calculation of the drought indices for future period (2026-2060).To evaluate the applicability of the SI, the drought records during 1981-2019 in the study area were compiled by referring to the Chinese Dictionary of Meteorological Hazards (Wen and Ding, 2008).The comparison revealed that the correlation coefficients between the simulated and measured occurrence of drought months were 0.80 at the annual scale and 0.72 at the seasonal scale, suggesting that the SI constructed in this study can effectively capture the occurrence of drought.
This study introduced drought intensity to explore the drought characteristics.Specifically,drought intensity was employed to evaluate the severity of drought during a certain period and is reflected by the SI value (Eq.1).
whereSis the drought intensity;mis the frequency of drought occurrence; and SIiis the absolute value of the SI value corresponding to the three types of drought at theithdrought occurrence.The larger the value ofS, the more severe the drought.
2.3.3 Quantification of soil conservation service
Soil conservation service can protect sensitive and fragile regional ecology and environment, and is one of the important regulation services.In terms of retaining soil and minimizing soil erosion,soil conservation service focuses on the ability of the ecosystem to hold soil (Liu et al., 2020).Consequently, a common approach to quantify soil conservation service is by calculating the difference between the potential and actual soil erosion (Bai et al., 2022).This study used the RUSLE model to estimate the soil conservation amount (Maqsoom et al., 2020), as shown in Equation 2:
whereBcis the annual soil conservation modulus (t/(hm2·a));Ris the rainfall erosion force factor(MJ·mm/(hm2·h·a));Kis the soil erodibility factor (t·h/(MJ·mm));LSis the topographic (slope gradient and slope length) factor;Cis the vegetation cover and crop management factor; andPis the soil conservation measure factor.
The rainfall erosion force factor (R) represents the erosivity potential of rainfall.The empirical formula proposed by Wischmeier et al.(1965) is adopted:
where PREidenotes the monthly precipitation in theithmonth (mm); and PRE represents the annual precipitation (mm).
The soil erodibility factor (K) signifies the sensitivity of soil erosion to external forces such as rainfall impact.The Erosion Productivity Impact Calculator model estimates theKfactor by considering variables such as soil mechanical composition and organic carbon content (Williams et al., 1983):
where SAN is the soil sand content (%); SIL is the soil silt content (%);CLA is the soil clay content (%); and SOCis the soil organic carbon content (%).
The topographic factor (LS) was calculated using the method from Wischmeier et al.(1978):
whereLis the slope length factor;Sis the slope gradient factor;λis the length of the horizontal projection of the slope;αis the slope length exponent;βis the ratio of the rill to interill erosion;andθis the slope (°) extracted from DEM.
The vegetation cover and crop management factor (C) can be calculated using the vegetation cover factor formula proposed by Cai et al.(2000):
wherefcis the vegetation coverage (%); NDVI is the Normalized Difference Vegetation Index;and NDVImaxand NDVIminare the maximum and minimum values of NDVI in the study area,respectively.
The soil conservation measure factor (P) reflects soil and water conservation measures,indicating the ratio of soil loss after implementing special measures to the amount lost when planting along the slope.The assignment ofPvalues was determined based on previous research(Sun et al., 2013), considering both land use and slope characteristics (Table 4).The soil conservation amounts in the study area were calculated seasonally and annually from 2000 to 2019 using the RUSLE model.When calculating the seasonal-scale soil conservation, the calculation methods for theK,LS,C, andPfactors were consistent with those at the annual scale.TheRfactor follows a similar approach to Equation 3 but it involves the sum of precipitation corresponding to the three months within each quarter.For the future simulations of soil conservation amounts, theKandLSfactors will remain unchanged, while theCandPwill be determined using 2019 as a baseline.TheRfactor will utilize precipitation data under different future scenarios (RCP4.5 and RCP8.5).
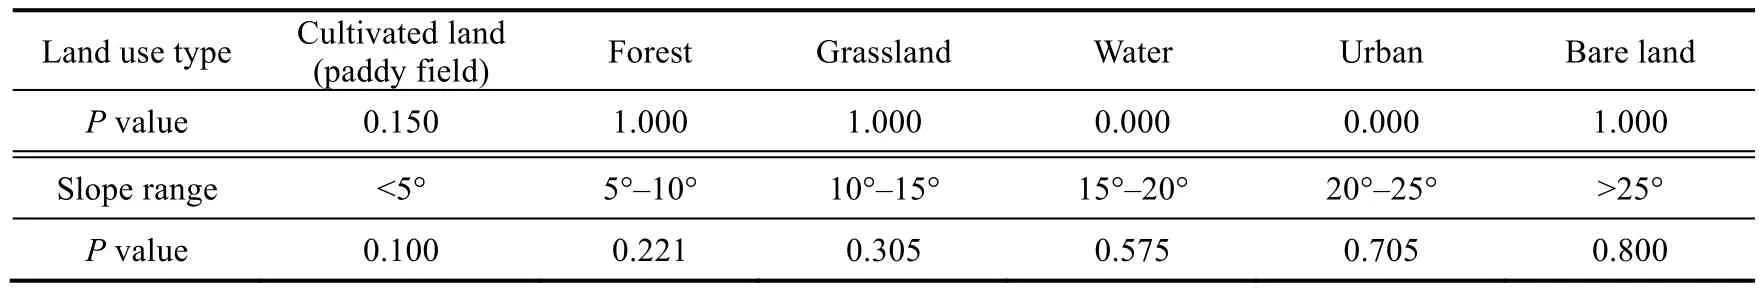
Table 4 Soil conservation measure factor (P) values for different land use types and slope ranges
2.3.4 Effects of drought on soil conservation service
This study primarily characterized the influence of drought on soil conservation service by measuring the degree of change in the average soil conservation in severe drought years compared to the overall study period (Eq.12).Therefore, we identified the five worst years (dy)for each of the three drought types for the historical period (2000-2019) and future period(2026-2060) under the RCP4.5 and RCP8.5 scenarios using the results of drought intensity.
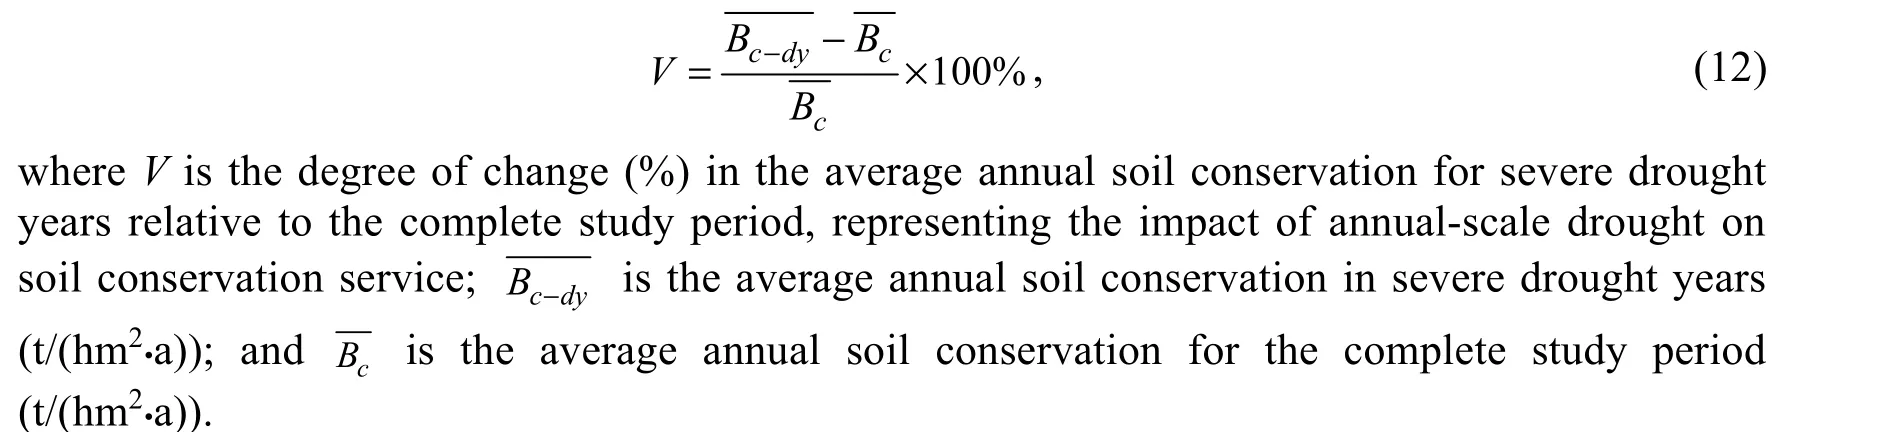
Furthermore, by referring to the evaluation of annual-scale drought impact, this study further assessed the impact of seasonal drought on soil conservation service based on the same principle.Concretely, we substituted the annual values in Equation 12 with season-specific soil conservation.
3 Results
3.1 Drought assessment based on multiple drought types
3.1.1 Annual-scale drought characteristics This study calculated meteorological, hydrological, and agricultural drought indices using the output data from the VIC model.Spatial variations in the drought intensity of the three drought indices were observed during the historical period (2000-2019) and future period (2026-2060)under the RCP4.5 and RCP8.5 scenarios (Fig.3).In the historical period, meteorological drought intensity ranged from 2.47 to 3.92, with high-value areas located in the north, southeast, and southwest of the Jinghe River Basin.However, there was little difference in the intensity of meteorological drought across the region, indicating limited variability in available water resources within the limited confines of this basin.Hydrological drought intensity fluctuated in the range of 2.16-4.91.The intensity of agricultural drought ranged from 1.81 to 4.82, and the spatial distribution was consistent with that of hydrological drought.The high-value areas were concentrated in the southwestern part of the basin in the Liupanshan Mountain.
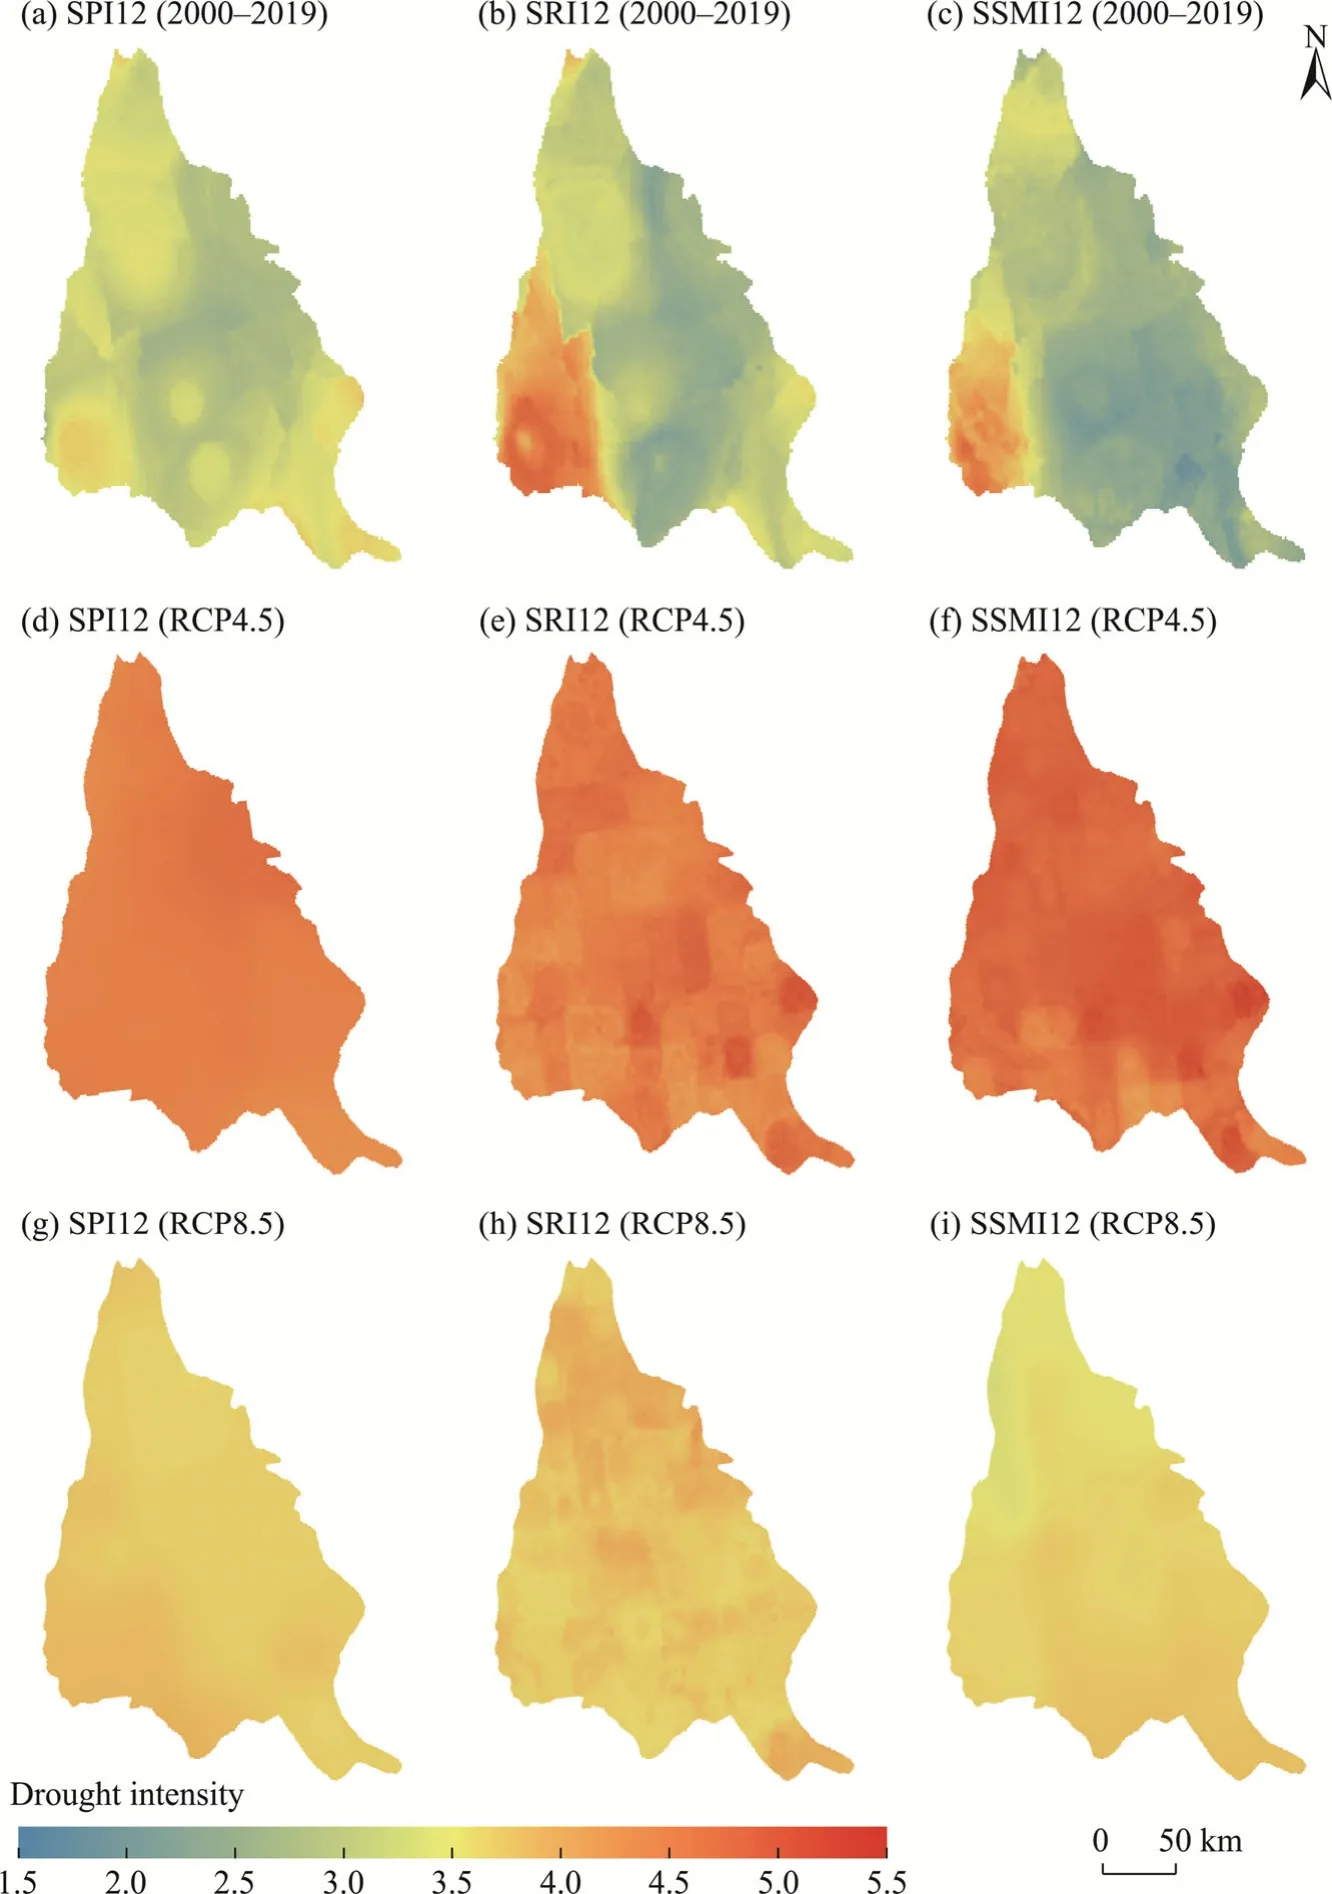
Fig.3 Spatial distribution of drought intensity of annual-scale meteorological drought (a, d, and j), hydrological drought (b, e, and h), and agricultural drought (c, f, and i) during the historical period (2000-2019) and future period (2026-2060) under the RCP4.5 and RCP8.5 scenarios in the Jinghe River Basin.RCP, Representative Concentration Pathway; SPI, Standardized Precipitation Index; SRI, Standardized Runoff Index; SSMI,Standardized Soil Moisture Index.The SPI12, SRI12, and SSMI12 correspond to the annual-scale meteorological,hydrological, and agricultural droughts, respectively.
In comparison to the historical period, the future period may witness an increase in the intensity of all three drought types, exhibiting a more pronounced impact on the Jinghe River Basin under the RCP4.5 scenario (Fig.3d-f) than under the RCP8.5 scenario (Fig.3g-i).Under the RCP4.5 and RCP8.5 scenarios, the range of meteorological drought intensity becomes narrower, spanning 4.31-4.79 and 3.66-3.94, respectively.Moreover, the spatial difference between hydrological and agricultural drought intensities is not obvious in the future period, and the distribution of high and low values tends to be uniform.However, the agricultural drought intensity displays a negligible north-south variation under the RCP8.5 scenario.The exacerbation of drought may further affect the sustainable development of the Jinghe River Basin, which should receive more attention.
3.1.2 Seasonal-scale drought characteristics From 2000 to 2019, the average intensity of seasonal-scale meteorological drought in the Jinghe River Basin was as follows: 1.02 in spring, 1.01 in summer, 0.52 in autumn, and 0.83 in winter.Meteorological drought had the highest drought intensity in spring and summer, followed by winter and autumn (Fig.4a-d).The average intensity of seasonal-scale hydrological drought was 0.96 in spring, 1.00 in summer, 0.52 in autumn, and 0.77 in winter.Among the hydrological drought, summer drought was the most intense, followed by spring drought and winter drought,and autumn drought was the least intense (Fig.4e-h).The average intensity of seasonal-scale agricultural drought was 0.94 in spring, 1.13 in summer, 0.53 in autumn, and 0.70 in winter.Among the agricultural drought, summer drought was the most intense, followed by spring drought, winter drought, and autumn drought (Fig.4i-l).In general, the seasonal-scale drought was weakest in autumn and most severe in summer, and the spatial distribution showed little differences among the meteorological, hydrological, and agricultural droughts.
Under the RCP4.5 scenario, the spatial distribution of drought intensity remains relatively consistent across the seasons for the same drought type.In comparison to the historical period, the spatial differences in meteorological drought intensity in the basin in spring, summer, and autumn exhibit further reduction in the future period, with slight variation in the northern region in winter(Fig.S2a-d).The spatial differences in hydrological drought intensity will surpass those in meteorological drought intensity (Fig.S2e-h).The high-value areas of hydrological drought intensity in summer are concentrated in the central basin.The low-value areas of hydrological drought intensity in winter are distributed in the southern part.The spatial differences between seasonal-scale agricultural droughts are as inconspicuous as hydrological and meteorological droughts.The drought intensity ranges across the four seasons are similar, and the distribution of drought intensity within the basin remains uniform.
In the case of RCP8.5 scenario, the spatial difference of drought intensity in different seasons is greater than that under the RCP4.5 scenario, which shows the scattered distribution of drought intensity in different seasons (Fig.S2m-x).The drought intensity in all seasons is lower than that under the RCP4.5 scenario, which is consistent with the results at the annual scale.Similar to the RCP4.5 scenario, the RCP8.5 scenario shows low values of meteorological drought intensity in the northern region in winter, as well as low values of hydrological drought intensity in the southern part of the basin.
3.2 Spatial and temporal characteristics of soil conservation service
3.2.1 Annual variations in soil conservation service
The average annual total soil conservation was 1.24×10⁸t during 2000-2019.From the perspective of inter-annual changes, the total soil conservation showed an upward trend, increasing by 8.16×10⁷t from 2000 to 2019.The total soil conservation in 2019 was 1.14 times that in 2000(Fig.5).In 2013, the total soil conservation was the highest (2.96×10⁸t), while in 2016, the total soil conservation was the lowest (4.36×10⁷t).During 2000-2019, theRfactor was the highest in 2013 and lowest in 2016, which is related to the annual precipitation.

Fig.4 Spatial distribution of multi-year average of meteorological (a-d), hydrological (e-h), and agricultural(i-l) drought intensity at the seasonal scale from 2000 to 2019 in the Jinghe River Basin.The SPI3, SRI3, and SSMI3 correspond to the seasonal-scale meteorological, hydrological, and agricultural droughts, respectively.
The spatial patterns of the average annual soil conservation modulus for the period 2000-2019 in the Jinghe River Basin are shown in Figure 6.Areas with high soil conservation capacity were found mainly in the southwestern, southern, and eastern parts of the basin.These regions are dominated by woodlands and shrubs, with high vegetation coverage, especially near the Liupanshan Mountain, where the altitude is high.In addition, the intensity of the human disturbance on the surface is relatively small.Conversely, the northern basin featured a land use pattern characterized by alternating cultivated land and grassland, resulting in low vegetation coverage, limited soil fixation capacity, and weak soil conservation capacity.In the middle basin,cultivated land was the dominated land use type, and human activity interfered greatly; most of the land was bare in winter and spring, with a weak soil conservation capacity.Low soil conservation capacity in the middle of the basin presented a strip distribution near the river channel.

Fig.6 Spatial distribution of multi-year average soil conservation modulus from 2000 to 2019 in the Jinghe River Basin
We further calculated the relative changes in average annual total soil conservation in the future period (2030s, 2040s, 2050s, and 2060s) under different climate scenarios compared to the annual total soil conservation in 2019.In the context of climate change, the soil conservation under the RCP4.5 and RCP8.5 scenarios will reduce.Under the RCP4.5 scenario, the average annual total soil conservation in the 2030s, 2040s, 2050s, and 2060s is expected to reduce by 54.3%, 35.0%,41.0%, and 38.9%, respectively.Under the RCP8.5 scenario, the mean values in the 2030s, 2040s,2050s, and 2060s are reduced by 42.1%, 34.8%, 47.7%, and 25.7%, respectively, with the largest reduction occurring in the 2050s.
3.2.2 Seasonal variations in soil conservation service
The seasonal-scale soil conservation was estimated in the RUSLE model for the period 2000-2019 (Fig.7).In spring, soil conservation exhibited an overall upward trend, with the largest values in 2014 and 2015.In summer, there was a tendency for soil conservation to increase slightly, with significant increases in 2003, 2013, and 2018.In autumn, the largest values were recorded in 2011 and 2014.Soil conservation in winter showed the largest value in 2008.This increase in soil conservation can be attributed to an increase in precipitation.
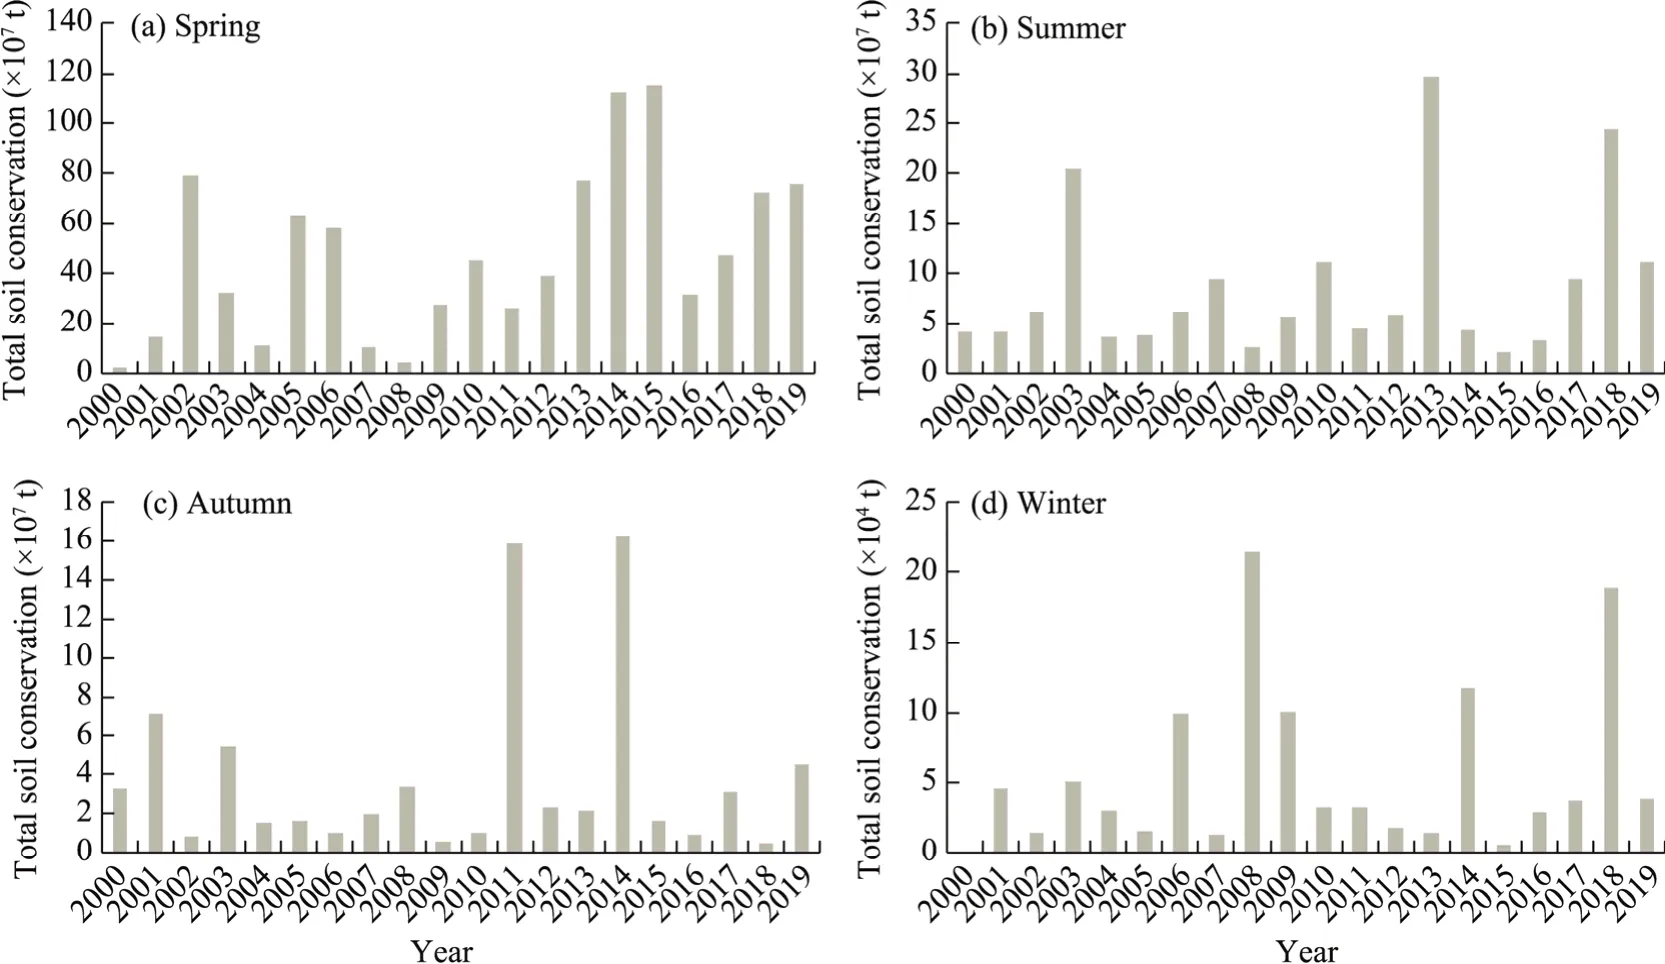
Fig.7 Temporal variations in annual total soil conservation in spring (a), summer (b), autumn (c), and winter (d)from 2000 to 2019 in the Jinghe River Basin
From the perspective of spatial distribution, the soil conservation modulus in spring ranged from 0.00 to 24.00 t/hm2during 2000-2019 (Fig.8).Areas with soil conservation modulus below 3.00 t/hm2encompassed 93.0% of the entire basin.High-value areas (with soil conservation modulus≥10.00 t/hm2) were distributed in the southern and northern margins of the basin (where vegetation coverage was high), accounting for only 7.0% of the entire area.Soil conservation modulus was between 0.00 and 100.00 t/hm2in summer.Areas with soil conservation modulus of less than 50.00 t/hm2accounted for 92.3% of the basin, mainly for cultivated land and grassland.The areas with soil conservation modulus of more than 50.00 t/hm2accounted for 7.7% of the basin and were mainly distributed in the southwestern, southern,and eastern margins of the basin.The soil conservation modulus in autumn was 0.00-100.00 t/hm2.However, the majority of the distribution (accounting for 99.2% of the basin) fell within the range of 0.00-50.00 t/hm2.The soil conservation modulus in winter was 0.00-0.43 t/hm2(0.00-0.10 t/hm2in most areas).Overall, the spatial variation in soil conservation was greatest in summer, followed by autumn, spring, and winter.
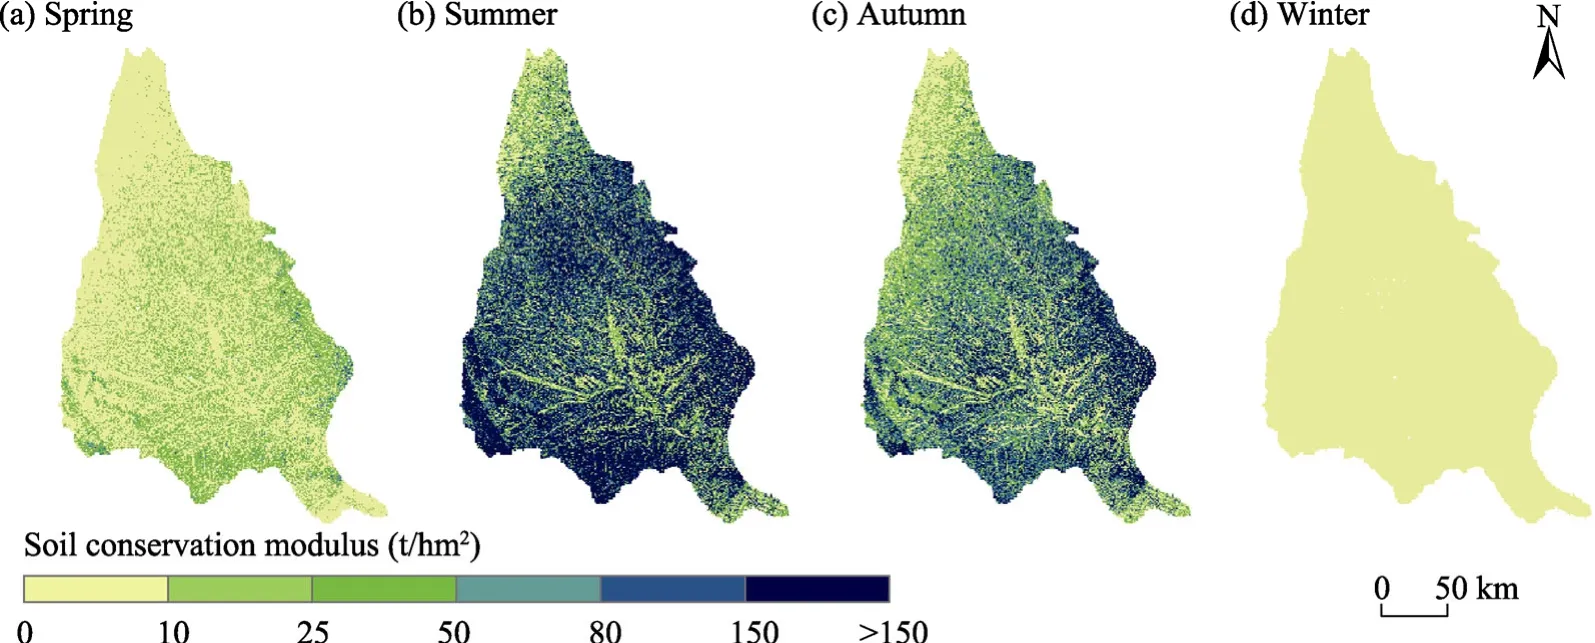
Fig.8 Spatial distribution of multi-year average soil conservation modulus in spring (a), summer (b), autumn(c), and winter (d) during 2000-2019 in the Jinghe River Basin
By comparing the soil conservation service under different climate scenarios with that in 2019,the response characteristics of seasonal-scale soil conservation service to climate change were studied (Table 5).The seasonal averages of soil conservation under both climate scenarios exhibit a downward trend compared to the values observed in 2019.Notably, under the RCP4.5 scenario,soil conservation in spring of the 2040s will increase by 21.6%, and it will increase by 200.1% in winter of the 2030s, while the decreases are most obvious in winter.This is because there is less precipitation in winter, and a slight increase or decrease in precipitation can cause soil conservation to change exponentially.
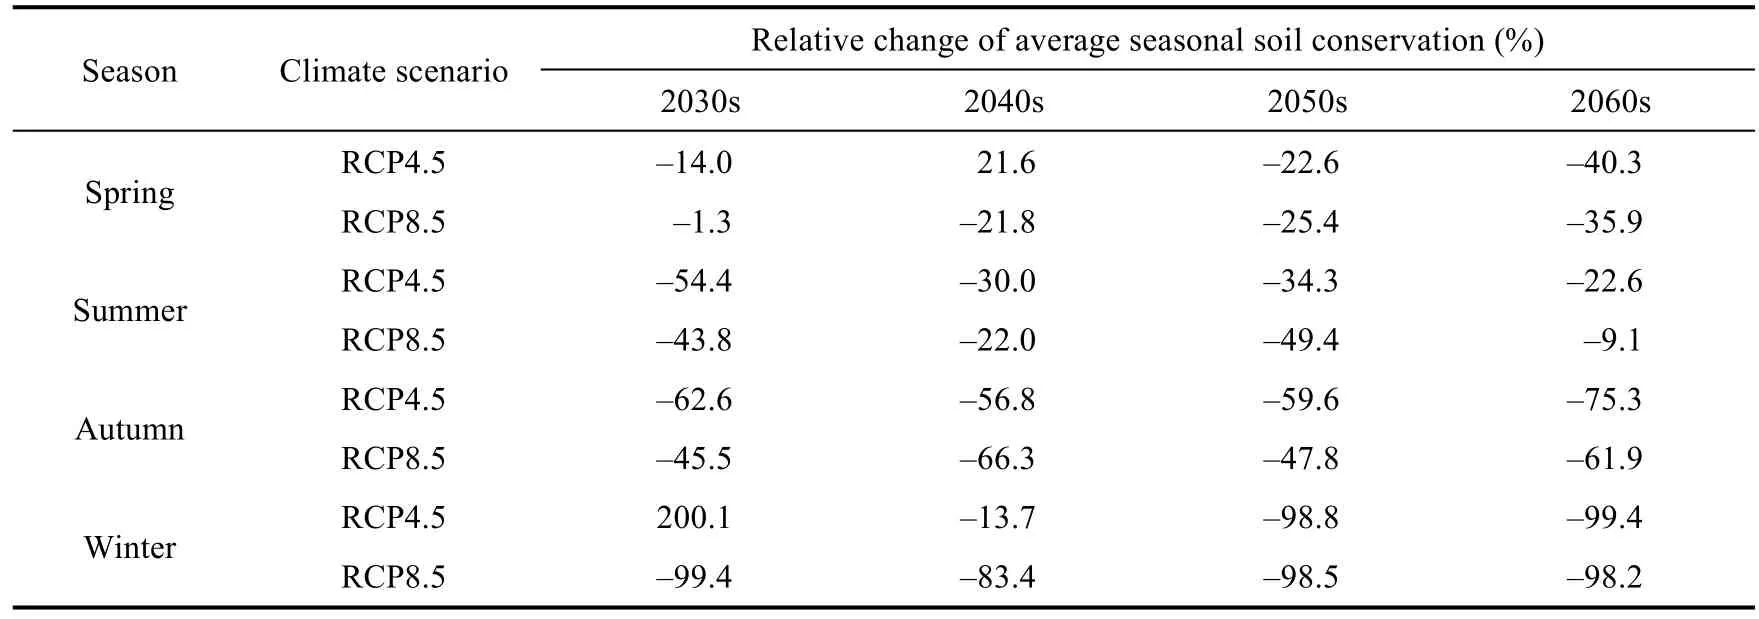
Table 5 Relative changes of average seasonal soil conservation in the 2030s, 2040s, 2050s, and 2060s under the RCP4.5 and RCP8.5 scenarios compared to the seasonal soil conservation in 2019
3.3 Decline in soil conservation service under different drought conditions
3.3.1 Impact of annual-scale drought on soil conservation service Based on drought identification and quantification of soil conservation service, we estimated the degree of change in the average soil conservation corresponding to the five years with the most severe drought compared to the historical period 2000-2019 (Fig.9a-c).In the years with severe meteorological drought, the average annual soil conservation was found to be lower than the historical average in most areas, with a reduction of more than 25.0%.Only a few areas in the north and southeast showed an increase, primarily ranging from 0.0% to 25.0%.Further analysis of supplementary data revealed that the precipitation levels in these specific regions for the corresponding years were comparatively higher when juxtaposed with other areas within the Jinghe River Basin.Therefore, the impact of meteorological drought in these areas was less pronounced than in other parts of the basin.The impact of hydrological drought on soil conservation service was smaller than that of meteorological drought.In the years with severe hydrological drought, more than half of the basin experienced a decline in soil conservation.Compared to meteorological drought, the areas with degree of change between -50.0% and-25.0% in soil conservation contracted, while the areas with degree of change between -25.0%and 0.0% in soil conservation increased.This provides additional evidence that the influence of hydrological drought on soil conservation service was concentrated at lower levels.In the years with severe agricultural drought, the areas with soil conservation reduction were mainly distributed in the northern region, accounting for about half of the basin area.On the eastern edge, the soil conservation increased, but the increase was small.Under the influence of different droughts, the soil conservation declined in most areas.The analysis found that the drought intensity corresponding to a few abnormal regions (where average soil conservation in the years with severe drought was above the historical average) was smaller than that in other regions, which further confirmed that the more serious the drought, the lower the soil conservation capacity.
We further investigated the degree of change in average annual soil conservation in the severe drought years compared to the future period under the RCP4.5 and RCP8.5 scenarios (Fig.9d-i).Under the RCP4.5 scenario, the impacts of meteorological, hydrological, and agricultural droughts on soil conservation service will show insignificant differences.In the years with severe meteorological drought, soil conservation in the Jinghe River Basin will decrease, with degree of change < -30.0% in approximately two-thirds of the basin.In the years with severe hydrological drought, soil conservation will decrease by more than 20.0%, and the decrease is more serious in the west than in the east.In the years with severe agricultural drought, soil conservation will generally decrease by more than 20.0%.Under the RCP8.5 scenario, the degree of change in average annual soil conservation will be -10.0%-0.0% for meteorological drought.Soil conservation in the years with severe hydrological drought also shows a decrease, with degree of change mainly between -20.0% and -10.0%.In the years with severe agricultural drought, soil conservation will decrease by 30.0%-40.0%, 10.0%-20.0%, and 20.0%-30.0% in the east, north,and other areas of the basin, respectively.Overall, the impact of meteorological and agricultural droughts on soil conservation service under the RCP8.5 scenario is greater than that under the RCP4.5 scenario, while the impact of hydrological drought on soil conservation service is smaller than that under the RCP4.5 scenario.
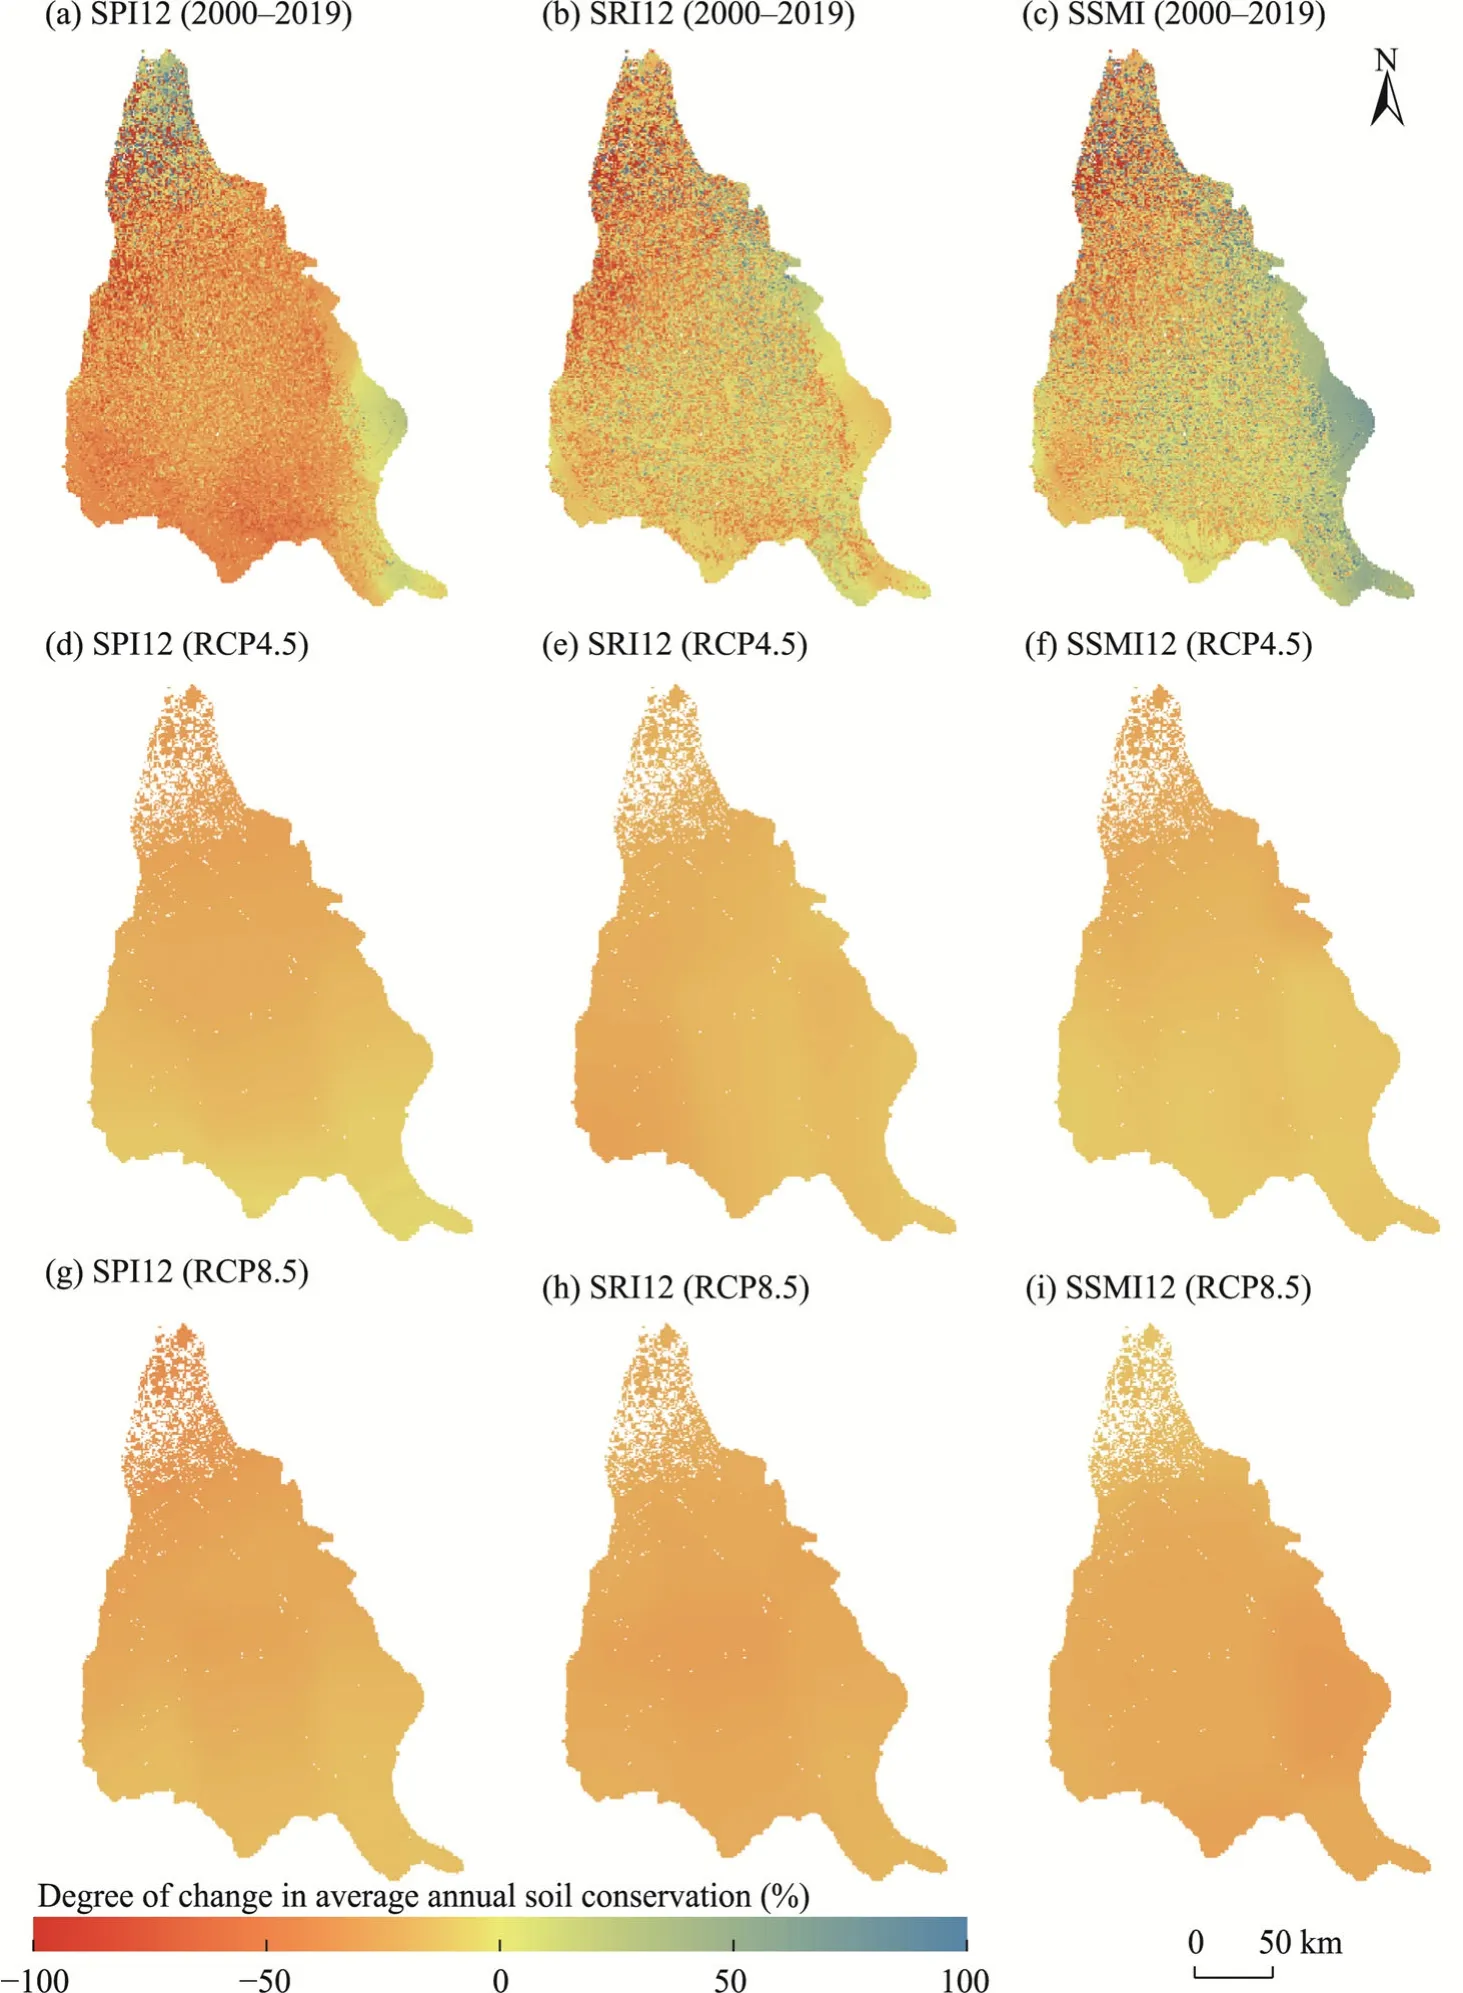
Fig.9 Degree of change in average annual soil conservation in severe drought years relative to the historical period (2000-2019) (a-c) and future period (2026-2060) under the RCP4.5 (d-f) and RCP8.5 (g-i) scenarios for meteorological, hydrological, and agricultural droughts.The SPI12, SRI12, and SSMI12 correspond to the annual-scale meteorological, hydrological, and agricultural droughts, respectively.
3.3.2 Impact of seasonal-scale drought on soil conservation service
To further explore the influence of different droughts on soil conservation service at the seasonal scale, this study quantified the degree of change in the average seasonal soil conservation of the five most severe drought years in comparison to the average seasonal soil conservation during 2000-2019 (Fig.10).
Over the last two decades, spring and autumn were more severely affected by meteorological drought (Fig.10a-d).In the years with severe meteorological drought, most areas showed a decreasing state of soil conservation in spring, summer, and autumn, except for the northern part(showing an increase of soil conservation) (Fig.10a-c).In winter, the increase in soil conservation in the southern region did not exceed 50.0% (Fig.10d).Summer and autumn were more severely affected by hydrological drought (Fig.10e-h).In the years with severe hydrological drought, soil conservation in most areas reduced by more than 50.0% in summer and autumn, and only a small part of the northern area showed an increase in soil conservation (Fig.10f and g).A slight increase in soil conservation was observed in certain region in spring and winter (Fig.10e and h).Winter and summer were more severely affected by agricultural drought(Fig.10i-l).In the Jinghe River Basin, the reduction in soil conservation in winter was more than 50.0% (Fig.10l).Degree of change in soil conservation had a similar spatial distribution in spring and summer, and soil conservation in the central and eastern regions increased significantly,whereas soil conservation mainly reduced in other regions (Fig.10i and j).In autumn, there was an increase in soil conservation within the northern region; nevertheless, reduction remained the dominant trend in the majority of areas (Fig.10k).
To investigate the impact of future seasonal-scale drought on soil conservation service, this study computed the degree of change in average seasonal soil conservation in the severe drought years in comparison to the future period under the RCP4.5 and RCP8.5 scenarios (Fig.S3).More severe drought conditions are expected to be experienced in the future period compared to the historical period (Fig.3).Under the two climatic scenarios, winter and autumn are most severely affected by meteorological drought, followed by spring and summer.In spring and autumn, the reduction in soil conservation under the RCP8.5 scenario will be greater than that under the RCP4.5 scenario, while in summer, the reduction in soil conservation under the RCP8.5 scenario is smaller than that under the RCP4.5 scenario.In winter, the reduction in soil conservation under both scenarios will be more than 80.0%.
4 Discussion
4.1 Model simulations of drought and soil conservation service
Based on multi-source data, the VIC model, SI, and RUSLE model were utilized to simulate the spatial distribution patterns and temporal changes of drought and soil conservation service in the Jinghe River Basin.

Fig.10 Degree of change in average seasonal soil conservation in severe drought years relative to the historical period (2000-2019) under meteorological drought (a-d), hydrological drought (e-h), and agricultural drought(i-l).The SPI3, SRI3, and SSMI3 correspond to the seasonal-scale meteorological, hydrological, and agricultural droughts, respectively.
This study strictly calibrated and validated the data and models before use, and compared the simulation results with previous studies.Ran et al.(2020) have verified the applicability of the VIC model in the Jinghe River Basin.Therefore, this study selected the VIC model to simulate the hydrological process of the basin.Based on the runoff data observed at the Zhangjiashan Hydrological Station near the watershed outlet, we calibrated the parameters of the VIC model.The simulated and observed values met the requirements of RE<0.05, NSE>0.83, and KGE>0.89 for the validation period, indicating that the calibrated VIC model can reflect the actual runoff characteristics of the Jinghe River Basin.We calculated the SI according to the data simulated by the VIC model.This study conducted an analysis of three drought types (meteorological,hydrological, and agricultural droughts) in the Jinghe River Basin using three drought indices(SPI, SRI, and SSMI, respectively).Considering the variations in spatio-temporal scales among these indices, this study introduced the SI to ensure the spatial and temporal comparability.Droughts from 1981 to 2019 were simulated in this study, with the initial 20-year period utilized for verification, while the subsequent 20-year was dedicated to analyze the association between drought and soil conservation service.The consistency (indicated by the correlation coefficient)between the drought occurrence months represented by the SI and the measured data at annual and seasonal scales were 0.80 and 0.72, respectively, indicating that the SI can accurately reflect the occurrence of drought.In addition, the spatial distribution of drought intensity is consistent with the research by Zhang et al.(2016), with severe drought areas mainly located in the western and northern parts of the basin.In summary, the drought indices (SPI, SRI, and SSMI) established in this study can accurately characterize the drought status of the basin both in time series and spatial distribution.The RUSLE model is usually used to estimate soil conservation service.However, previous studies were limited by the time accuracy of land use and precipitation data and often calculated soil conservation at an annual scale and in discontinuous years (Liu et al.,2020).This study used land use datasets (2000, 2005, 2010, 2015, and 2018) and monthly precipitation data to calculate annual and seasonal soil conservation for 20 consecutive years from 2000 to 2019 and forecast changes in soil conservation service in the future, thus expanding the application scope of the RUSLE model.
The distribution pattern of soil conservation service in the Jinghe River Basin exhibits higher levels in the southwestern and southeastern regions, while low levels in the northern region, and the total soil conservation is increasing overall, with the largest distribution in summer and the smallest in winter within the year.These findings align with the results reported by Zheng et al.(2021) based on the RUSLE model and Yu et al.(2022) based on the SWAT model.
4.2 Mechanism of drought impacts on soil conservation service
It is not difficult to see that the quantitative method of soil conservation service is based on soil erosion, so the first analysis is made from the perspective of soil erosion.Prolonged drought may lead to soil exposure and erosion, land degradation, and eventually desertification (Sidiropoulos et al., 2021).Firstly, intensified drought diminishes both vegetation coverage and abundance,disrupts the balance of microbial communities, impairs natural land function, and weakens the capacity of plants to consolidate the soil (Otkin et al., 2016).On the other hand, drought increases the hydrophobicity of the soil and reduces the infiltration capacity of soil water, which in turn leads to increased surface runoff and soil erosion (Gazol et al., 2018).We can consider that drought suppresses soil conservation service indirectly by altering soil properties and changing vegetation conditions.Furthermore, precipitation, which is closely related to drought, is the most direct external factor to soil erosion among meteorological factors.Bai et al.(2022) found that the correlation coefficient between precipitation and soil conservation service is above 0.80.In the Jinghe River Basin, drought generally corresponds to less precipitation.Combined with the RUSLE model, it is easy to find that during the drought period, theRfactor decreases, resulting in a decrease in potential erosion and the amount of soil that needs to be maintained, ultimately leading to the reduction of soil conservation service.It is also consistent with the conclusion of this study that meteorological drought has the greatest impact on soil conservation service.The influence of drought on soil conservation service involves many aspects, such as climate,hydrology, vegetation, soil, and project management.Nevertheless, the principal aim of this study is to evaluate the effects of drought on soil conservation service under climate change conditions.Therefore, in our simulations for different future scenarios, we solely utilized climate scenario data, neglecting any modifications in underlying surfaces.Consequently, the specific focus of this investigation centered on analyzing changes in soil conservation service and the implications of drought under various climate scenarios.To comprehensively understand the intricate mechanisms driving these impacts, it becomes imperative to establish a more holistic land-atmosphere feedback model and conduct further field observations and experiments.
4.3 Limitations and prospects
The parameters of the VIC model in this study were solely calibrated using publicly measured runoff data from relatively short years (2006-2015), which introduces certain limitations.Short calibration period may fail to capture the long-term hydrological trend, leading to overly optimistic or pessimistic assessments under future scenarios.Additionally, short period may not cover rare extreme events.If the model does not calibrate enough extreme events, it may not be able to accurately simulate the occurrence and impact of these events under future scenarios.Therefore, in the areas with abundant hydrological data, it is necessary to calibrate parameters based on longer time series data, use parameter tuning methods based on time-varying parameters (Li et al., 2019),or introduce data obtained through other means for parameter calibration (Gou et al., 2021).
The RUSLE model adopted in this study is an empirical model that lacks the ability to depict the physical process involved.This also limits the further analysis of the effect mechanism of drought on soil conservation service.Therefore, it is necessary to introduce a process-based SWAT model and Water Erosion Prediction Project (WEPP) model to fully consider the process of soil particles from stripping, transport to deposition, and refine the impact of drought on soil conservation service.Moreover, in future research, it is crucial to integrate precise quantification of soil erosion through techniques such as runoff plot experiments and isotopic tracing methods.These approaches facilitate the calibration of simulated outcomes in soil conservation service models.
In addition, the reliability of simulation outcomes is directly influenced by the quality of the climate model results.Using output results from the GCMs as meteorological forcing data for hydrological models under different scenarios can lead to the accumulation of errors.Because of variations in mechanisms, initial conditions, and parameterization schemes, different GCMs exhibit significant variations in their performance at the regional level.Currently, the Coupled Model Intercomparison Project Phase 6 (CMIP6) is in progress, which involves the largest number of models in the CMIP initiative.However, Zhang and Chen (2021) found that the prediction differences among different CMIP6 models are even greater than those in CMIP5 when comparing the uncertainties in precipitation and temperature results from 24 GCMs, and they proposed that more GCMs are needed to ensure the robustness of climate projections.Conversely,the CMIP5 already has a more mature research foundation, especially in verifying GCMs that are more suitable for reproducing the regional climate in the study area.Therefore, this study ultimately selected climate models from the CMIP5.With the development of climate projections,it is necessary to introduce more comprehensive climate models to enhance the credibility of research results based on climate model outputs.This will enable a systematic analysis and management of different modes and scenarios.
4.4 Recommendations
As per the research on the impact of drought on soil conservation service at different time scales,the occurrence of drought in the past has greatly reduced soil conservation, and the drought in the future may further reduce soil conservation.To reduce the deterioration of the ecological environment resulting from the decline of soil conservation, this study puts forward some targeted suggestions.
(1) Establishing a scientific and reasonable drought monitoring system to strengthen early warning and forecasting.By providing timely information on drought conditions, policymakers and stakeholders can make informed decisions to minimize the negative impact on soil conservation.
(2) Developing and utilizing modern advanced water-saving technologies, such as artificial rainfall, drip irrigation, and mulching.They can enhance water efficiency and reduce the vulnerability of soil conservation service to drought conditions, especially in arid and semi-arid areas such as the Jinghe River Basin.
(3) Adjusting vegetation structure and enhancing soil root holding capacity can help mitigate the decline in soil conservation service during the period of drought and contribute to improve the regional climate.These measures can improve water retention in soil, reduce evaporation and soil erosion risks, and create a microclimate that promotes precipitation infiltration.As a result, this leads to improved soil quality and supports ecological restoration efforts.
(4) Strengthening biological, engineering, and farming measures.Implementing measures such as building horizontal terraces, appropriate afforestation and planting, and adopting grass-shrub intercropping and grass tillage rotation practices according to local conditions can effectively enhance soil conservation service.These strategies can promote land management practices that minimize soil erosion, increase water infiltration, and maintain soil fertility.
5 Conclusions
This study examined the temporal and spatial features of drought in the past and future as well as soil conservation service in the Jinghe River Basin, and predicted the impact of drought on soil conservation service.Soil conservation service may be affected by severe drought in the future.The northern and western regions of the Jinghe River Basin exhibit high drought intensity throughout the year.The intensity of meteorological, hydrological, and agricultural droughts varies with seasons.The distribution trend of soil conservation service is high in the southwest and southeast and low in the north of the study area.Soil conservation is found to be the largest in summer and the smallest in winter.Soil conservation declines in severe drought years, and this is more pronounced when meteorological drought occurs than when hydrological or agricultural drought occurs.In addition, the research results from different seasons also show that the more severe the drought, the stronger the restrictions on soil conservation service.This study enhances our comprehension of the interplay between drought and soil conservation service, thus establishing a foundation for developing effective strategies to mitigate the impact of drought on soil conservation service in the future in the Jinghe River Basin.
Conflict of interest
The authors declare that they have no known competing financial interests or personal relationships that could have appeared to influence the work reported in this paper.
Acknowledgements
This work was supported by the National Natural Science Foundation of China (42071285, 42371297), the Key R& D Program Projects in Shaanxi Province of China (2022SF-382), and the Fundamental Research Funds for the Central Universities (GK202302002).
Author contributions
Conceptualization: BAI Jizhou, LI Jing; Methodology: BAI Jizhou, RAN Hui; Formal analysis: BAI Jizhou, RAN Hui; Writing - original draft preparation: RAN Hui; Writing - review and editing: BAI Jizhou, DANG Hui;Funding acquisition: BAI Jizhou, LI Jing; Resources: ZHANG Cheng, YU Yuyang; Supervision: LI Jing, ZHOU Zixiang.All authors approved the manuscript.
Appendix
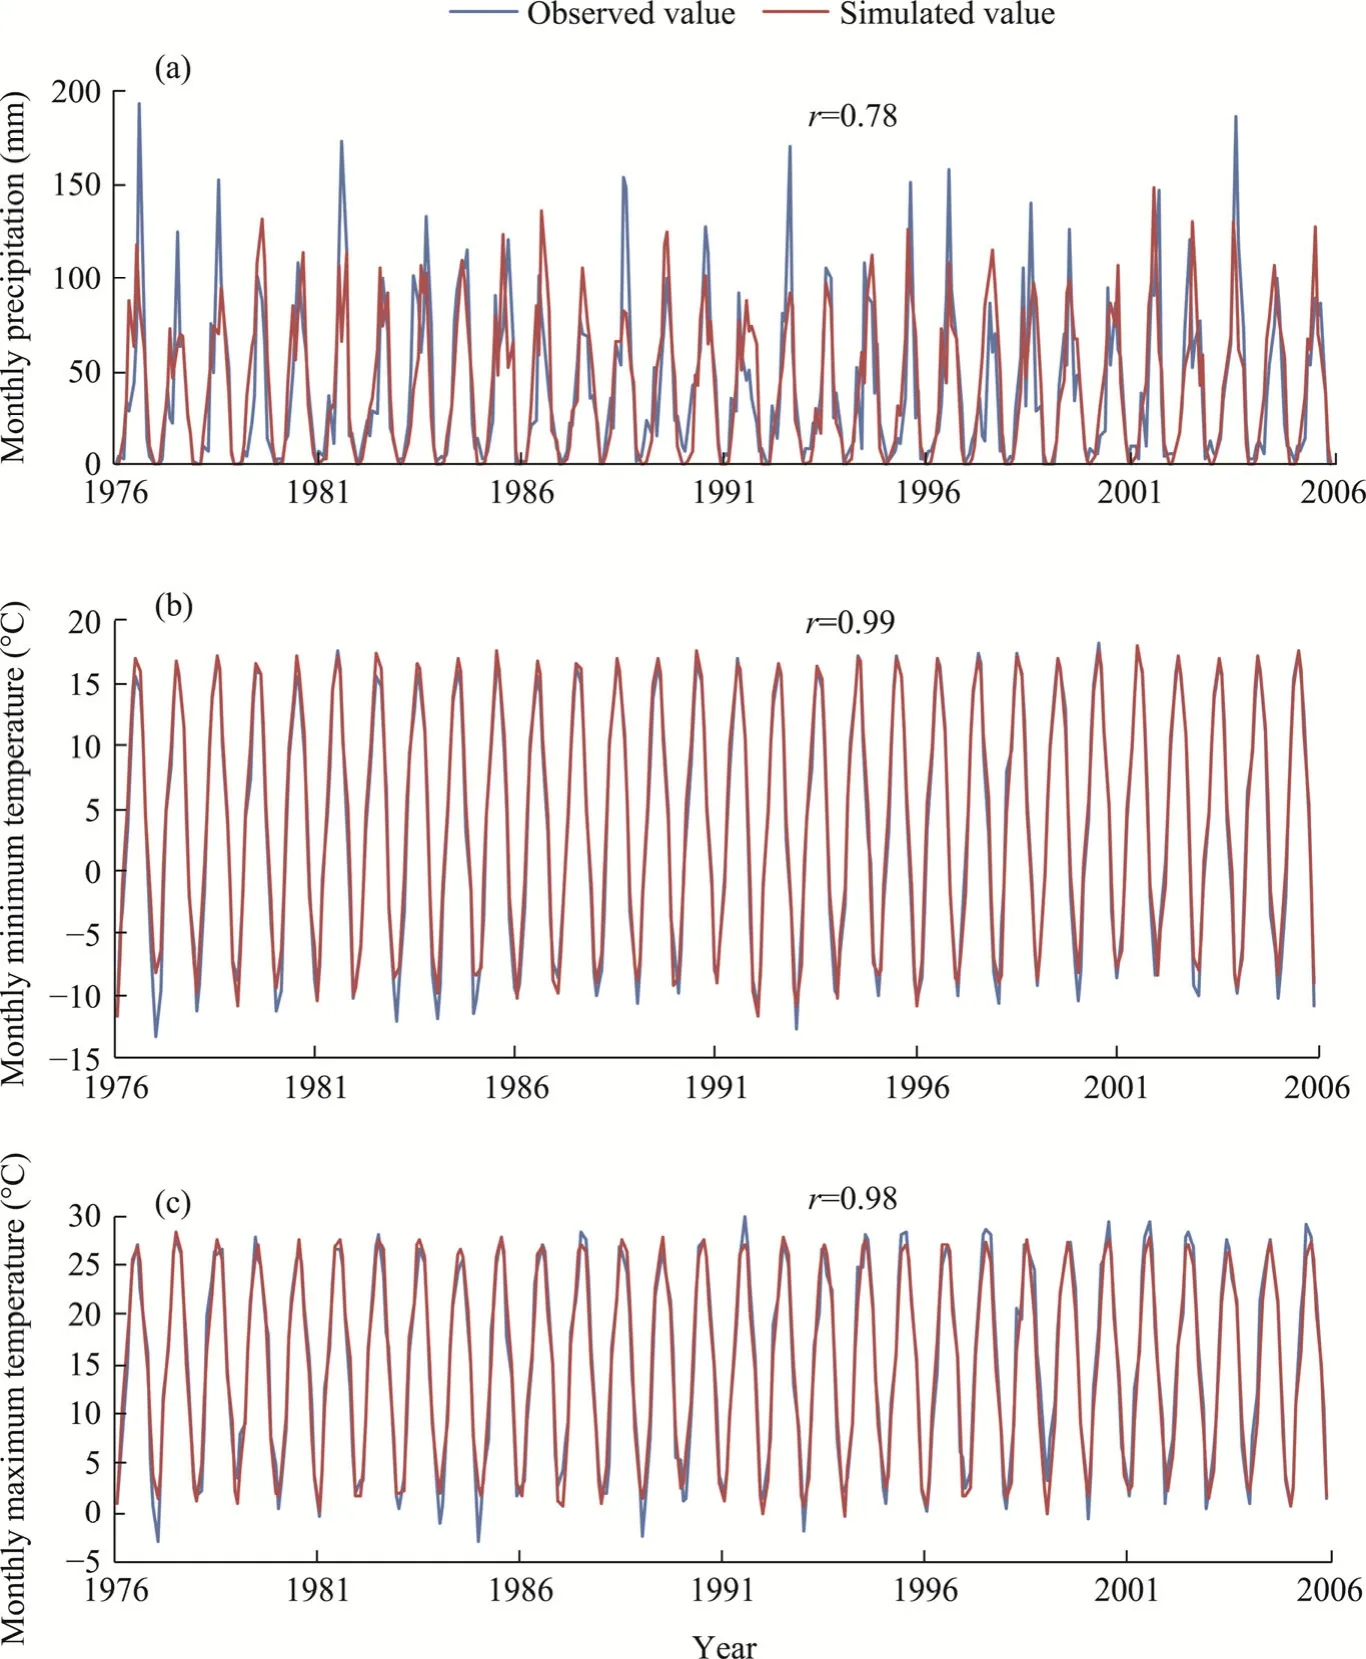
Fig.S1 Verification results of the NEX-GDDP dataset used in the study for monthly precipitation (a), monthly minimum temperature (b), and monthly maximum temperature (c) from 1976 to 2005.NEX-GDDP, NASA Earth Exchange Global Daily Downscaled Projections; r, Pearson's correlation coefficient.
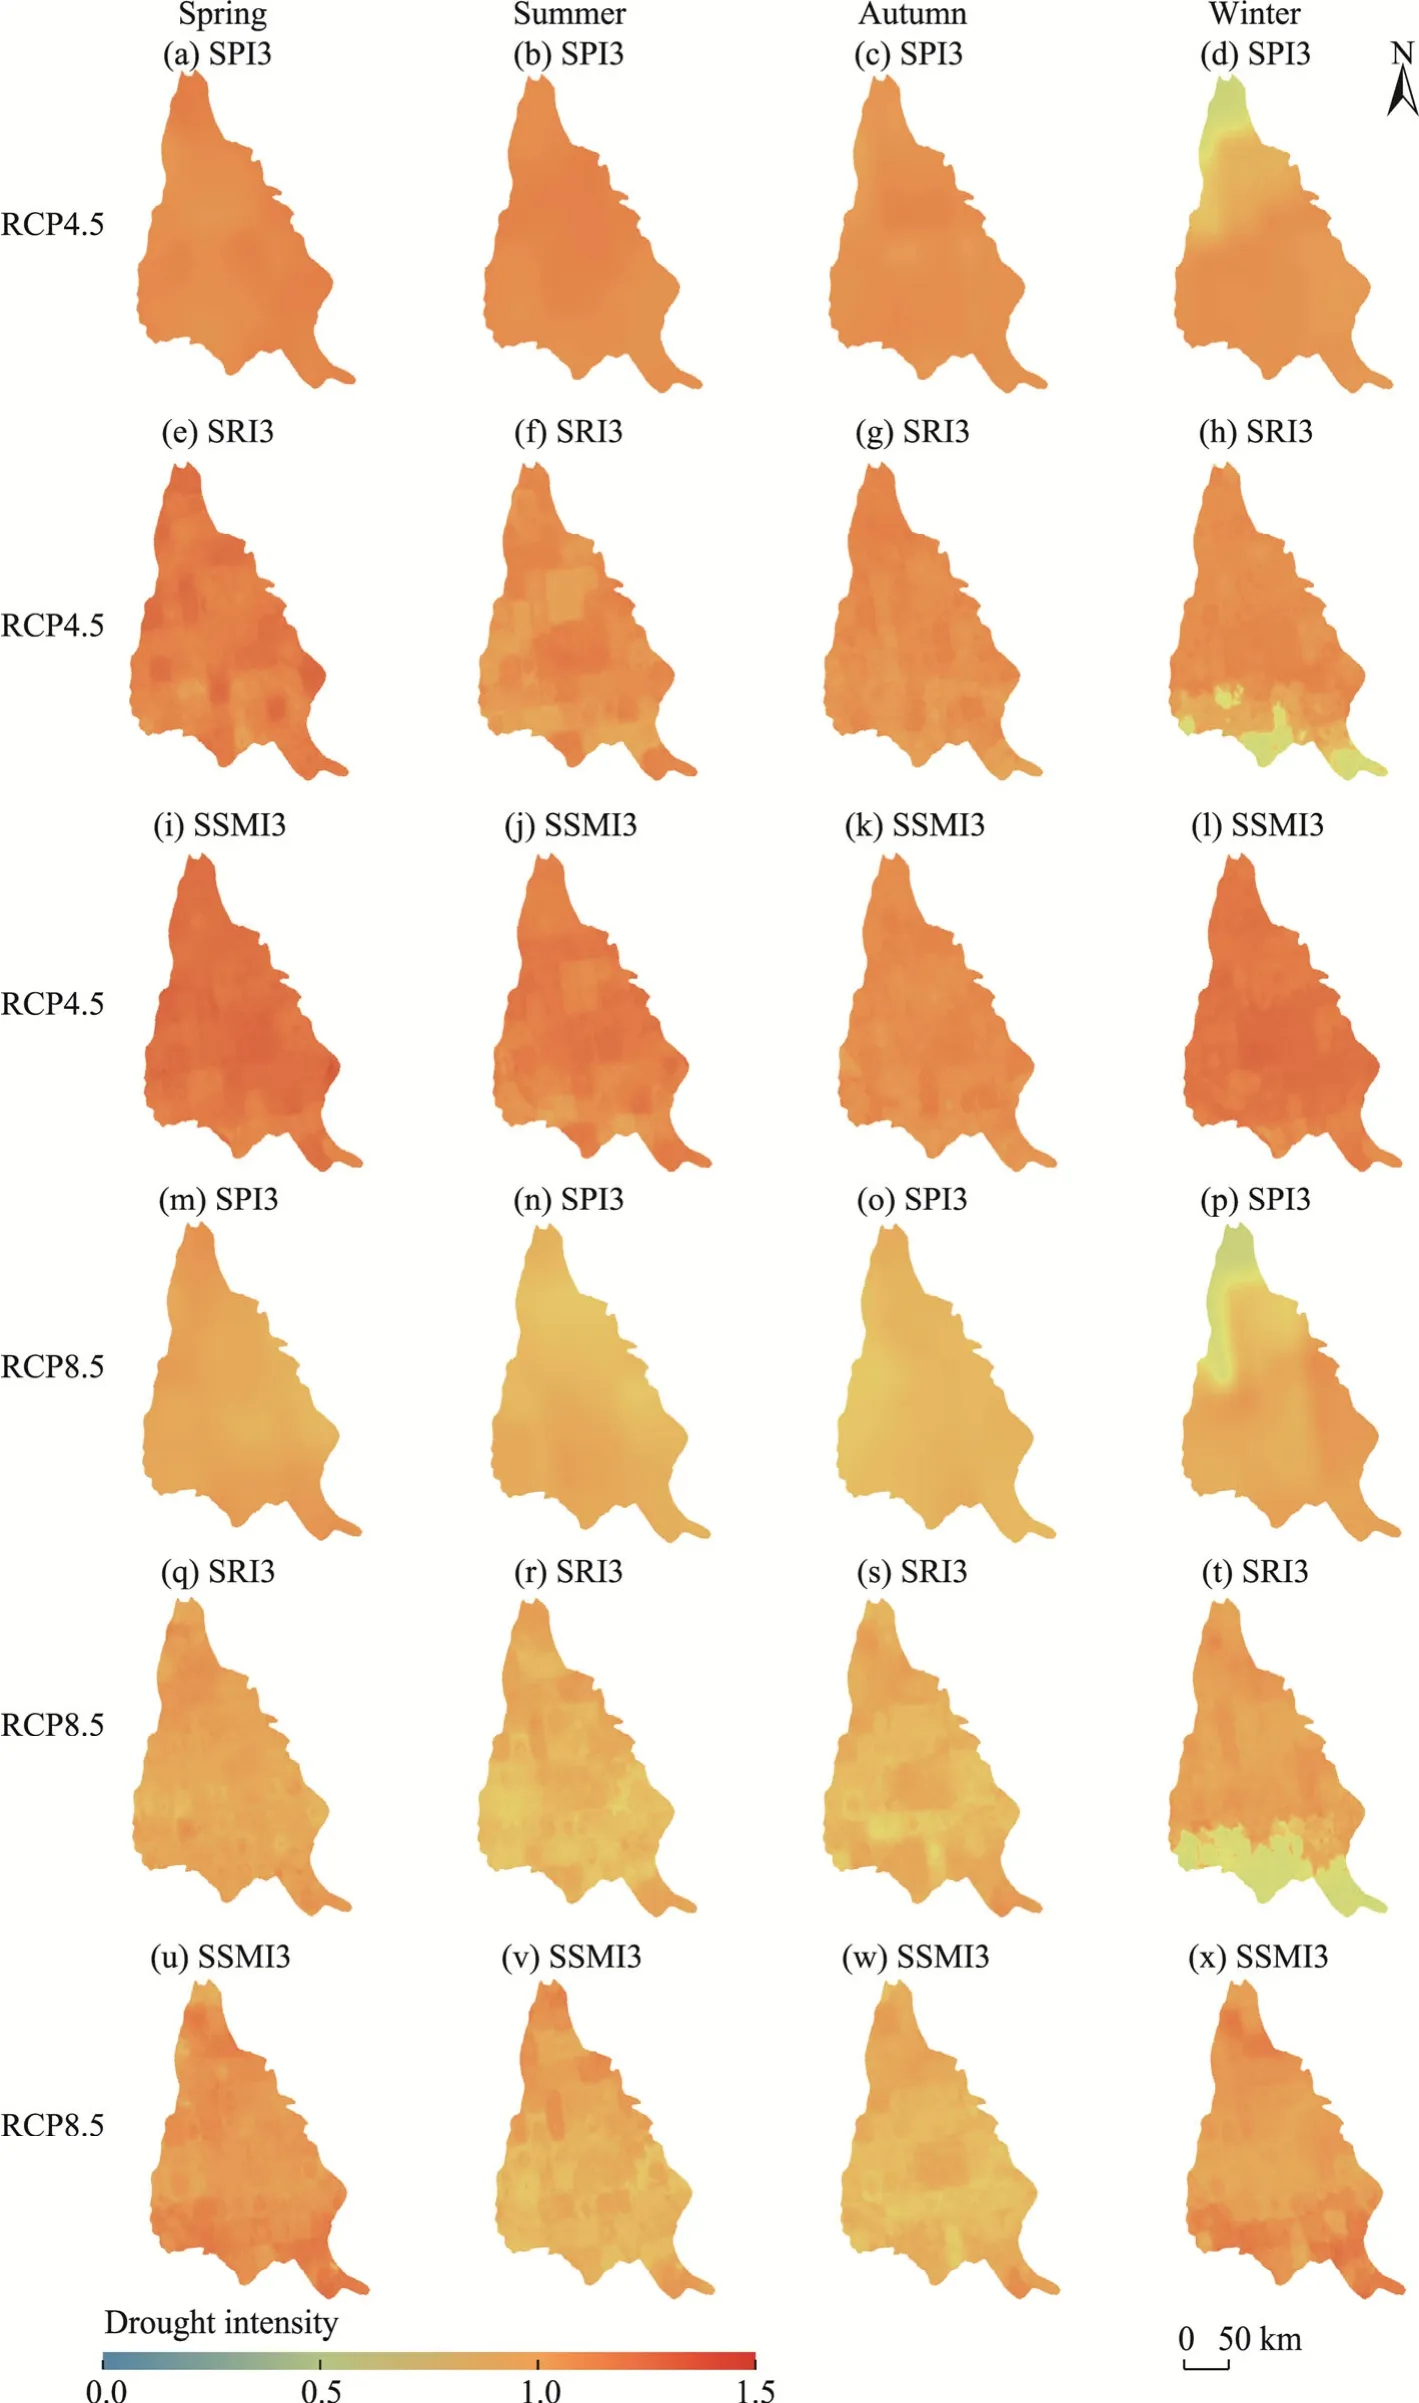
Fig.S2 Spatial distribution of multi-year average of meteorological drought intensity (a-d and m-p),hydrological drought intensity (e-h and q-t), and agricultural drought intensity (i-l and u-x) at the seasonal scale under the RCP4.5 and RCP8.5 scenarios in the future period (2026-2060).RCP, representative concentration pathway.The SPI3, SRI3, and SSMI3 correspond to the seasonal-scale meteorological, hydrological, and agricultural droughts, respectively.
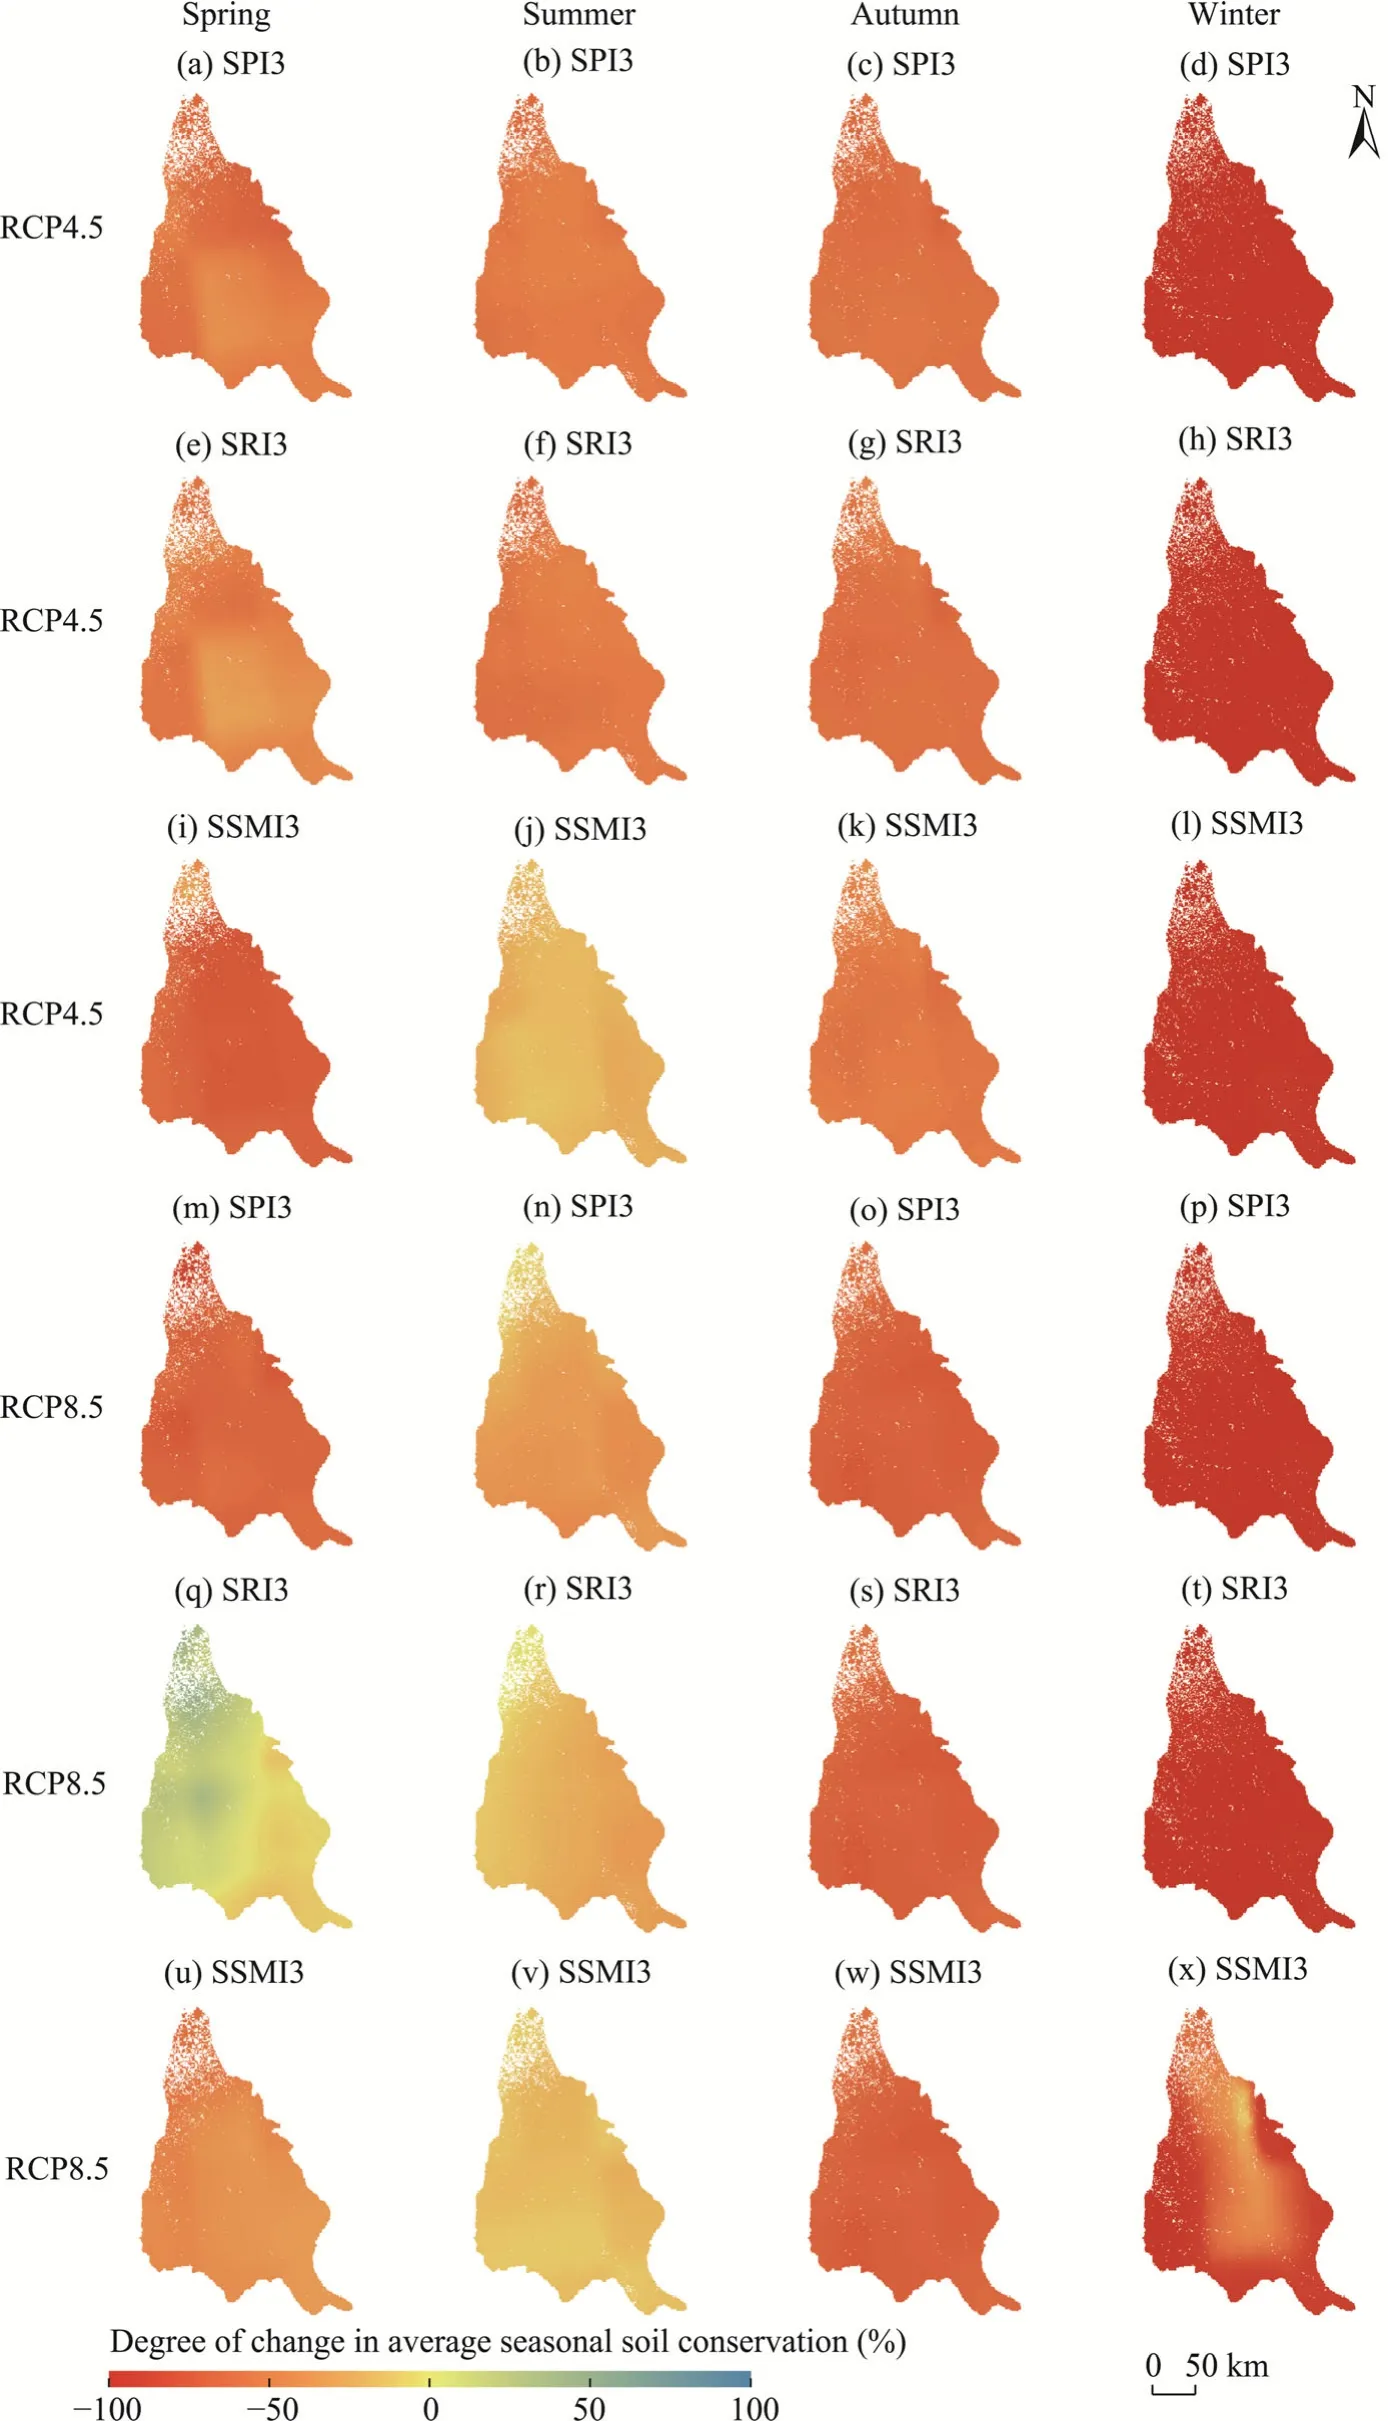
Fig.S3 Degree of change in average seasonal soil conservation in severe drought years relative to the future period (2026-2060) under the RCP4.5 and RCP8.5 scenarios for meteorological drought (a-d and m-p),hydrological drought (e-h and q-t), and agricultural drought (i-l and u-x).The SPI3, SRI3, and SSMI3 correspond to the seasonal-scale meteorological, hydrological, and agricultural droughts, respectively.
- Journal of Arid Land的其它文章
- Exploring groundwater quality in semi-arid areas of Algeria: Impacts on potable water supply and agricultural sustainability
- Runoff change in the Yellow River Basin of China from 1960 to 2020 and its driving factors
- A CMIP6-based assessment of regional climate change in the Chinese Tianshan Mountains
- Land use and cover change and influencing factor analysis in the Shiyang River Basin, China
- Effects of landscape fragmentation of plantation forests on carbon storage in the Loess Plateau, China
- Effects of drip and flood irrigation on carbon dioxide exchange and crop growth in the maize ecosystem in the Hetao Irrigation District, China