
Formation and ecological response of sand patches in the protection system of Shapotou section of the Baotou-Lanzhou railway, China
2024-02-26 09:11DUNYaoquanQUJianjunKANGWenyanLIMinlanLIUBinWANGTaoSHAOMei
Journal of Arid Land 2024年2期
DUN Yaoquan, QU Jianjun, KANG Wenyan, LI Minlan, LIU Bin, WANG Tao,SHAO Mei
1 Key Laboratory of Desert and Desertification, Northwest Institute of Eco-Environment and Resources, Chinese Academy of Sciences, Lanzhou 730000, China;
2 University of Chinese Academy of Sciences, Beijing 100049, China;
3 College of Urban and Environmental Sciences, Northwest University, Xi'an 710100, China;
4 Zhongwei Works Section of China Railway Lanzhou Bureau Group Company Limited, Zhongwei 755000, China
Abstract: The development of bare patches typically signifies a process of ecosystem degradation.Within the protection system of Shapotou section of the Baotou-Lanzhou railway, the extensive emergence of bare sand patches poses a threat to both stability and sustainability.However, there is limited knowledge regarding the morphology, dynamic changes, and ecological responses associated with these sand patches.Therefore, we analyzed the formation and development process of sand patches within the protection system and its effects on herbaceous vegetation growth and soil nutrients through field observation,survey, and indoor analysis methods.The results showed that sand patch development can be divided into three stages, i.e., formation, expansion, and stabilization, which correspond to the initial, actively developing, and semi-fixed sand patches, respectively.The average dimensions of all sand patch erosional areas were found to be 7.72 m in length, 3.91 m in width, and 0.32 m in depth.The actively developing sand patches were the largest, and the initial sand patches were the smallest.Throughout the stage of formation and expansion, the herbaceous community composition changed, and the plant density decreased by more than 50.95%.Moreover, the coverage and height of herbaceous plants decreased in the erosional area and slightly increased in the depositional lobe; and the fine particles and nutrients of soils in the erosional area and depositional lobe showed a decreasing trend.In the stabilization phases of sand patches, the area from the inlet to the bottom of sand patches becomes initially covered with crusts.Vegetation and 0-2 cm surface soil condition improved in the erosional area, but this improvement was not yet evident in the depositional lobe.Factors such as disturbance, climate change, and surface resistance to erosion exert notable influences on the formation and dynamics of sand patches.The results can provide evidence for the future treatment of sand patches and the management of the protection system of Shapotou section of the Baotou-Lanzhou railway.
Keywords: railway protection system; sand patch; morphology; vegetation characteristic; soil property
1 Introduction
The presence of bare patches within vegetated forests (Sevink et al., 2023), mashes (Wang et al.,2021), grasslands (Liu et al., 2012), and deserts (de Soyza et al., 1998) is sometimes considered a symptom of ecosystem degradation and the subsequent loss of important ecosystem services(Wang et al., 2021).These bare patches lead to fragmentation of the original habitat (Wang et al.,2022a, b) and weaken some positive feedbacks (e.g., positive plant-soil relationships) in the ecosystems (Sloey et al., 2015; Wang et al., 2022a, b), and are often used to assess grassland degradation and desertification (de Soyza et al., 1998; Zhang et al., 2021).Any disturbance, such as drought (Visser et al., 2004), fire (Sevink et al., 2023), soil erosion (Wei et al., 2007), grazing(Visser et al., 2004; Wei et al., 2007), or the activity of burrowing herbivores (Wei et al., 2007;Zhang et al., 2021) can lead to bare patches.The dynamics of bare patches are usually controlled by erosional processes and plant growth (Bochet, 2015; Certini et al., 2015) and show two main trends: (1) tend to gradually disappear under natural vegetation restoration processes via occupation by opportunistic or pioneer plants (Pang et al., 2020); and (2) continuously expand under animal and wind action, eventually leading to extensive degradation or desertification(Zhao et al., 2002; Li et al., 2016).Wind erosion and deposition during dynamic bare-patch change alter surface characteristics and affect plant community and soil property.As bare patches expand, vegetation and soil conditions deteriorate, ecosystem functions are impaired, and the degradation process becomes harder to stop (Visser et al., 2004; Song et al., 2020; Wang et al.,2021).To manage ecosystems sustainably, it is necessary to understand the processes of bare-patch dynamics and their effects on ecosystem function, structure, and composition.
Located at the southeastern edge of Chinese Tengger Desert, where annual precipitation is less than 200.0 mm, Shapotou section in the protection system of the Baotou-Lanzhou railway has been maintained for more than 60 a, not only ensuring the smooth operation of railway, but also promoting ecological restoration (Li et al., 2004; Zhang et al., 2014; He et al., 2019; Hu et al.,2019).However, the ecological environment of the protection system is very fragile, with soil moisture conditions deteriorating and shrub cover decreasing over a long successional period(Xiao et al., 2009; Chen et al., 2018).Under the influence of drought, wind erosion, and sand burial, a large number of sandy bare patches are generated (Fu and Li, 2023).Owing to thin soil layer (Fearnehough et al., 1998), weak crust (Li et al., 2006b), and underlying loose sand, sand patches within railway protection system can expand easily and rapidly after formation (Yu et al.,2002; Wu et al., 2018).For example, Yu et al.(2002) found that the area of 8.2 m2sand patch in the protection system expanded to 24.0 m2after 8 months, and had a strong destructive effect on vegetation and surface soil.Massive sand-patch formation and expansion is a major potential threat to the stability, sustainability, and safety of the ecosystem.At present, most studies on bare patches have focused on grassland or marsh ecosystems (Wang et al., 2021; Zhang et al., 2021;Wang et al., 2022; Yao et al., 2022), with fewer studies on artificially fixed dune where sand patches are most easily expanded.
To address this knowledge gap, we conducted a comprehensive series of field observations and indoor experimental analyses within the Baotou-Lanzhou railway protection system.Our objectives were as follows: (1) to examine the occurrence and dynamic changes of sand patches within the protection system; (2) to investigate the variations in vegetation and soil characteristics among different types of sand patches; and (3) to assess the differential effects of erosion and accumulation on vegetation and soil characteristics during the formation of sand patches.By shedding light on the appearance, dynamics, and ecological implications of sand patches within artificially fixed dunes, our findings will contribute to the development of effective strategies for the management and conservation of these vulnerable ecosystems.
2 Materials and methods
2.1 Study area
The study area is located on the southeastern edge of the Tengger Desert, Ningxia Hui Autonomous Region, China (37°32′N, 105°02′E; Fig.1a).The climate is arid, characterized by an average annual precipitation of 188.2 mm, predominantly occurring from June to September (Huang and Zhang, 2015).The annual potential evaporation is approximately 2900.0 mm, and the annual average temperature is 9.6°C.The average annual wind speed is 2.9 m/s, with prevailing northwesterly and west-northwesterly winds (Zhang et al., 2014).The soil is characterized by loose and barren aeolian sand with low nutrient content, and gravimetric water content ranges from 3% to 4%.Vegetation cover is sparse, encompassing only about 1% of the land surface.Groundwater is deeply buried, exceeding 60 m in depth, posing challenges for vegetation roots to access.Soil moisture recharge primarily relies on natural precipitation, with groundwater playing a minimal role (Li et al., 2004; Li et al., 2014).
In the 1950s, a comprehensive protective system was implemented to ensure the optimal functioning of Shapotou section of the Baotou-Lanzhou railway.The system spans a length of 16 km and has a width of 500 m on the northern side and 200 m on the southern side of the railway.Structurally, the protection system consists of four sequential components, as shown in Figure 1b,extending from the windward edge to the railway.These components include an upright sand blockage belt, approximately 1.2 m in height; a sand-binding vegetation belt with straw checkerboards and unirrigated vegetation; an irrigated vegetation belt; and a gravel platform(Zhang et al., 2014).Our investigation specifically focuses on the sand-binding vegetation belt,which is the largest segment of the protective system and plays a crucial role in safeguarding the railway.Prior to revegetation, we constructed straw checkerboards, approximately 1 m2in size, in the sand-binding vegetation belt, using wheat or rice straw, to stabilize the dune surface and allow the subsequently planted xerophytic shrubs, such asArtemisia ordosicaKrasch.,Caragana microphyllaFisch.et Mey., andHedysarum scopariumKom.to acclimatize to the new environment (Li et al., 2006b).The environment of the area has improved since this vegetation was established more than 60 a.The stabilization of the dune surface has contributed to the improvement of soil properties and has also created conditions suitable for colonization by herbaceous plants, microorganisms, and animals.Formerly barren dune environments have been transformed into a desert ecosystem with a complex structure, composition, and function (Li et al., 2004; Li et al., 2006b; Chen and Li, 2012).Currently, a good microbiotic crust exists within the sand-binding vegetation belt, which enhances the sand fixation effect of the system.However, under the influence of disturbance, this crust is easily damaged and sand patches can form (Fig.1d).To prevent the expansion of sand patches, the railway staff rebuild the straw checkerboard barriers frequently (Fig.1e).
2.2 Methods
2.2.1 Field survey and sampling
One hundred sand patches along the inspection route within the protection system were surveyed in March 2019.On the basis of surface morphology, crust breakage, and vegetation, the sand patches were classified into three categories, i.e., initial sand patches, actively developing sand patches, and semi-fixed sand patches (Fig.2), and their length, width, and depth were measured.Actively developing and semi-fixed sand patches often exhibited sand depositional lobes on their downwind side, which typically extended to the leeward slope of the dune, resulting in a more intricate and challenging morphology that is not easy to measure.As a result, our study primarily focused on erosional areas.Specifically, length was determined as the greatest distance from the inlet to the outlet of the downwind margin of a sand patch, width was measured as the greatest perpendicular distance to the length, and depth was recorded as the largest vertical distance between the bottom of a sand patch and the ground surface.
In September 2021, vegetation and soil surveys were conducted on the western side of the protection system, characterized by densely distributed sand patches.Three sand patches of each type were selected for analysis.Noting distinct differences in morphology and vegetation between actively developing and semi-fixed sand patch erosional areas and depositional lobes, the sampling sites were classified into eight groups (Fig.2), i.e., initial sand patches (IN), initial sand patch control area (IC), actively developing sand patch erosional area (AE), actively developing sand patch depositional lobe (AD), actively developing sand patch control area (AC), semi-fixed sand patch erosional area (SE), semi-fixed sand patch depositional lobe (SD), and semi-fixed sand patch control area (SC).For plant surveys, 3 to 5 random 1 m×1 m quadrats were assessed in each site, with 11 quadrats for erosional areas of the initial and semi-fixed sand patches and 15 for all other areas.Herbaceous species quantity, height, and coverage, along with total quadrat coverage,were recorded in each quadrat.Simultaneously, soil samples were collected at depths of 0-2, 2-5,and 5-10 cm.Five sampling points within each site were utilized, and soil samples were evenly mixed to create composite samples for subsequent analysis.
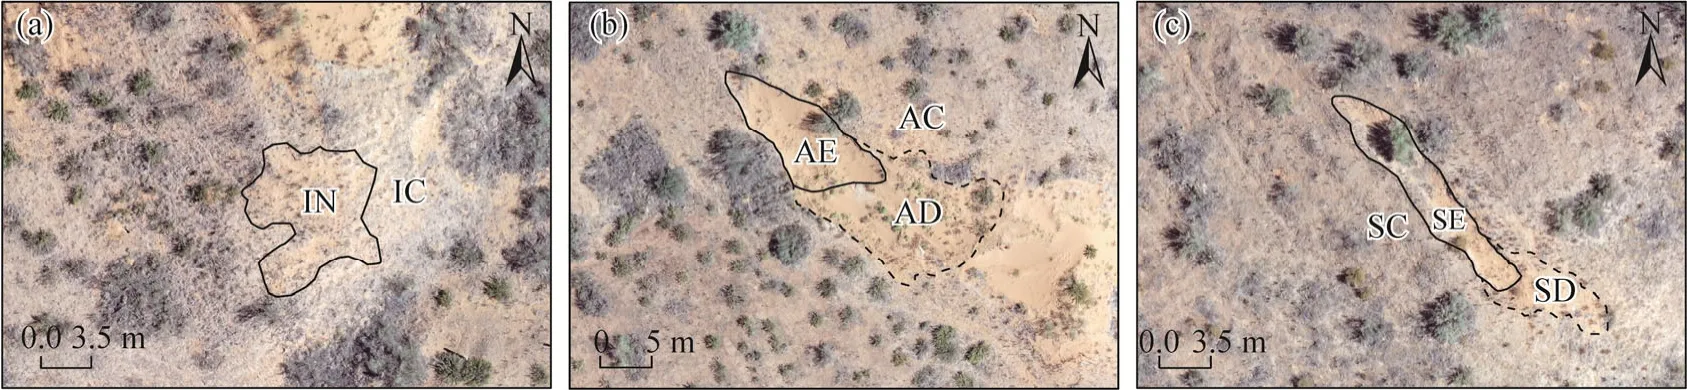
Fig.2 Images of three types of sand patches.(a), initial sand patches; (b), actively developing sand patches; (c),semi-fixed sand patches.The solid black line is the boundary of the sand patch erosional area, and the dotted black line is the boundary of sand patch depositional lobe.IN, initial sand patches; IC, initial sand patch control area; AE, actively developing sand patch erosional area; AD, actively developing sand patch depositional lobe;AC, actively developing sand patch control area; SE, semi-fixed sand patch erosional area; SD, semi-fixed sand patch depositional lobe; SC, semi-fixed sand patch control area.The abbreviations are the same as in the following figures.
2.2.2 Soil component analysis
In the soil analysis process, the air-dried soil samples were divided into two parts.One part underwent sieving through a 2.0-mm sieve to eliminate roots and other debris.The soil particle size distribution was then determined using a Mastersizer 3000 (Malvern Panalytical, Malvern,UK).We classified the particle size into seven categories based on the United States Department of Agriculture (USDA) classification system (Feng et al., 2020).The second part of soil samples was sieved through a 0.5-mm sieve and used for determining soil nutrient content, including soil organic carbon (SOC), total nitrogen (TN), available nitrogen (AN), total potassium (TK),available potassium (AK), total phosphorus (TP), and available phosphorus (AP), and the determination methods are described in detail in Feng et al.(2020).
2.2.3 Vegetation indices calculation
The important value (IV) was used as the dominant index for various species in the community,indicating the functional status of different plants.The Richness index (R), Shannon-wiener diversity index (H), and Pielou evenness index (E) were used to measure the diversity characteristics of communities in different sites.The equations are as follows (Li et al., 2009;Feng et al., 2023):
where RA is the relative abundance (%); RH is the relative height (%); RC is the relative coverage (%);Sis the total number of species observed, andPiis the relative importance value of theithspecies.
2.2.4 Measurement of surface erosion and deposition
From 28 November, 2020 to 25 December, 2021, an independent and typical actively developing sand patches was selected to observe surface erosion and depositional change using the erosion pins.The sand patches are 14.5 m in length and 6.1 m in width, and 23 erosion pins (45 cm in length and 2 mm in diameter) were placed along the long and short axes of the sand patches at approximately 1.0 m intervals, with 14 pins in the erosional area and 8 pins in the depositional lobe.The surface erosion and deposition were determined by the difference in height of the erosion pins over time.
2.2.5 Statistical analysis
We calculated all indices in this study in Excel according to the above formulae.One-way analysis of variance (ANOVA) followed by least significant difference (LSD) were used to examine and compare the differences in morphology, vegetation, and soil indicators among different plots at a significance level ofP<0.05.These statistical analyses were conducted using SPSS v.25.0, and all figures except for Figures 1, 2, and 8 were produced using Origin 2022.
3 Results
3.1 Morphology and development of sand patches
Distinct differences were observed in the external characteristics of the three types of sand patches within the study area, as shown in Figure 2.Initial sand patches were characterized by a small area, irregular shape, a surface crust that was damaged but not completely removed, and the presence of poorly growing herbaceous vegetation.Actively developing sand patches consisted of an erosional area and a depositional lobe, with virtually no surface crust.The erosional areas exhibited wind-deflated concave structures with clear boundaries, often taking on an oval or long strip-like shape, and featured sparse and dwarf-like vegetation.The sand accumulation area, located downwind of the erosion area, comprised accumulated sand grains that extended mostly to the leeward slopes of the dunes.The morphology of the depositional lobe was influenced by the underlying topography.The morphological characteristics of the semi-fixed sand patches closely resembled those of the actively developing sand patches.Nonetheless, a significant proportion of these patches, particularly the section extending from the wind inlet to the base of the erosional area, exhibited an overlaying presence of newly formed microbiotic crusts.
The average dimensions of all sand patch erosional areas were found to be 7.72 m in length,3.91 m in width, and 0.32 m in depth (Table 1).Analysis revealed a trend of actively developing sand patches>semi-fixed sand patches>initial sand patches for length, width, and depth.Additionally, a robust correlation between sand patch length, width, and depth was observed (Fig.3), with minimal variation among the three types of sand patches.The length:width ratio of the sand patches ranged from 1.16 to 4.41, with an average of 2.03.Furthermore, the average length:depth and width:depth ratios for all sand patches were 25.83 and 12.88, respectively.This discrepancy is likely attributed to the thickness and hardness of the topsoil.Given that the study area is an artificially fixed dune with a relatively thin surface soil due to a short restoration time,the sidewalls are more prone to collapse, leading to rapid lateral expansion.
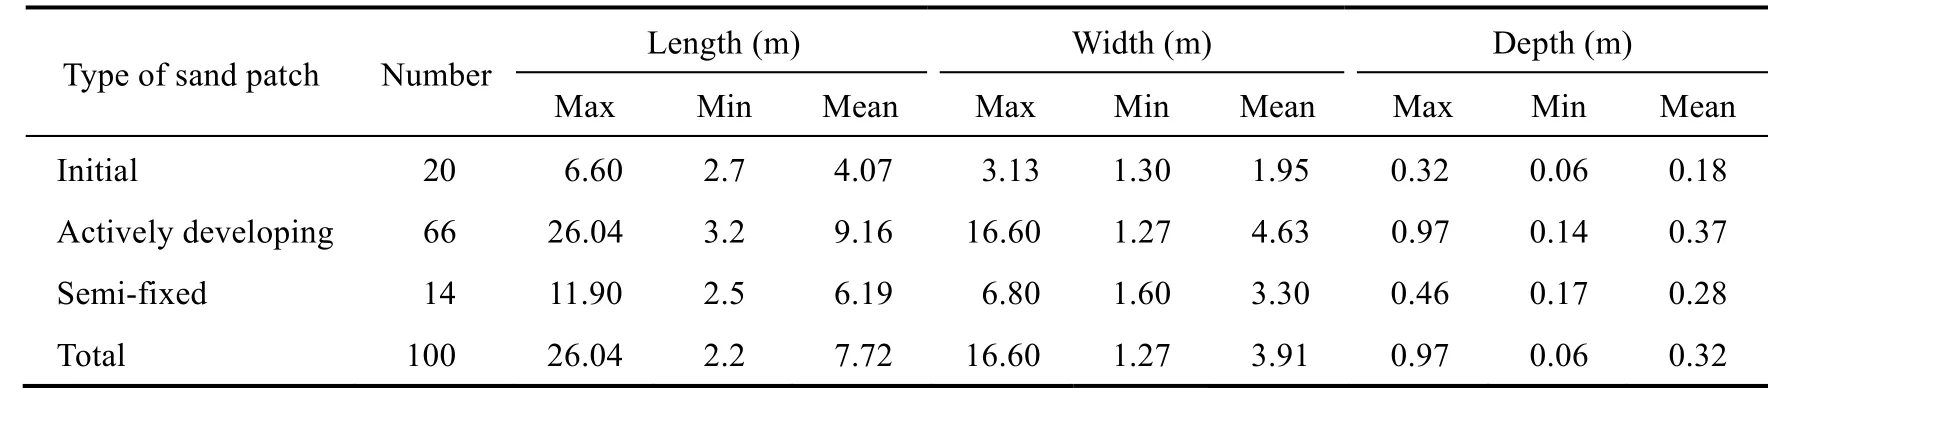
Table 1 Morphological parameters of different types of sand patches
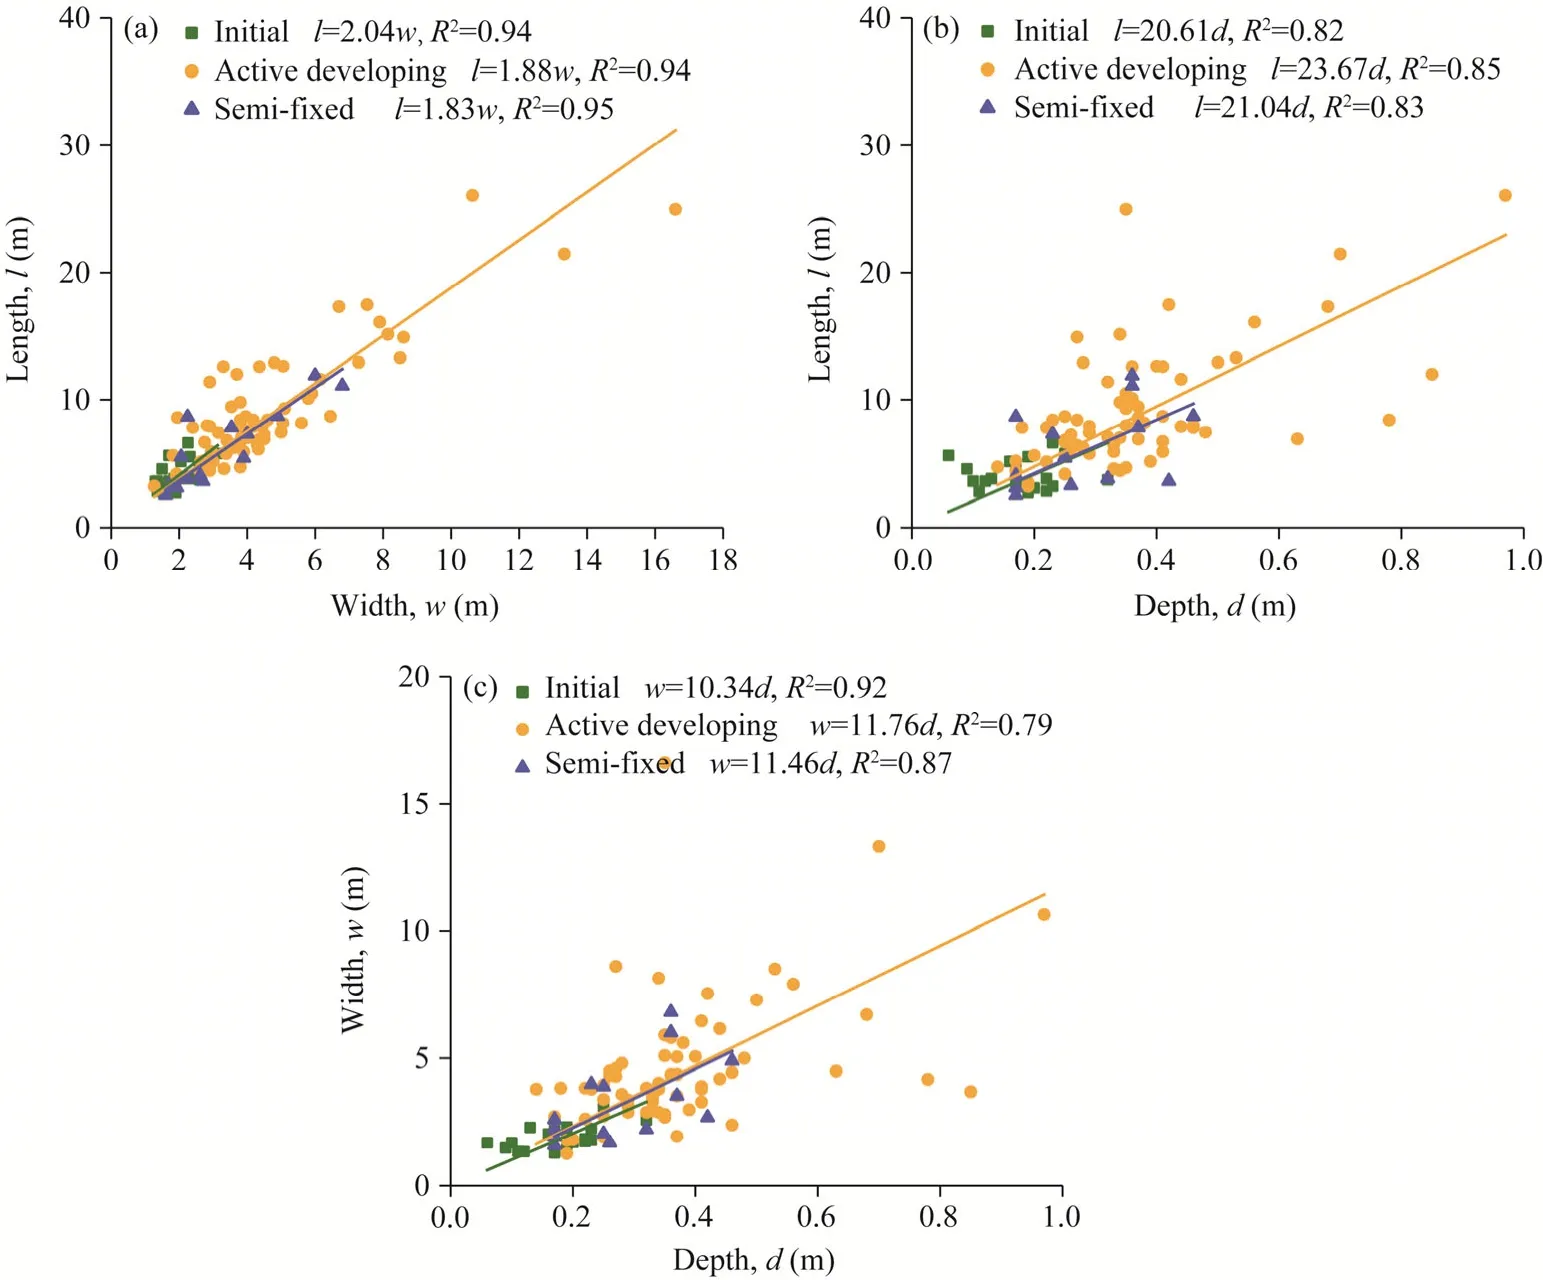
Fig.3 Relationships among length, width, and depth of the erosion zones of different types of sand patches
3.2 Vegetation characteristics of sand patches
Compared with the surrounding control area, all three types of sand patches resulted in a significant reduction in plant density (P<0.05; Fig.4a), with reductions ranging from 47.29% to 91.85%.However, the effects of sand patches on height and cover varied depending on the type and location of sand patches.In comparison with the control area, there were no significant changes observed in vegetation height and coverage within the initial sand patches (Fig.4b and c).Conversely, the depositional lobe experienced an increase in vegetation height and coverage,while significant decreases in vegetation coverage were observed within the erosional area(P<0.05).In the actively developing sand patch erosional area, there was no significant change in vegetation height.However, a significant increase was observed in the semi-fixed sand patch erosional area (P<0.05).
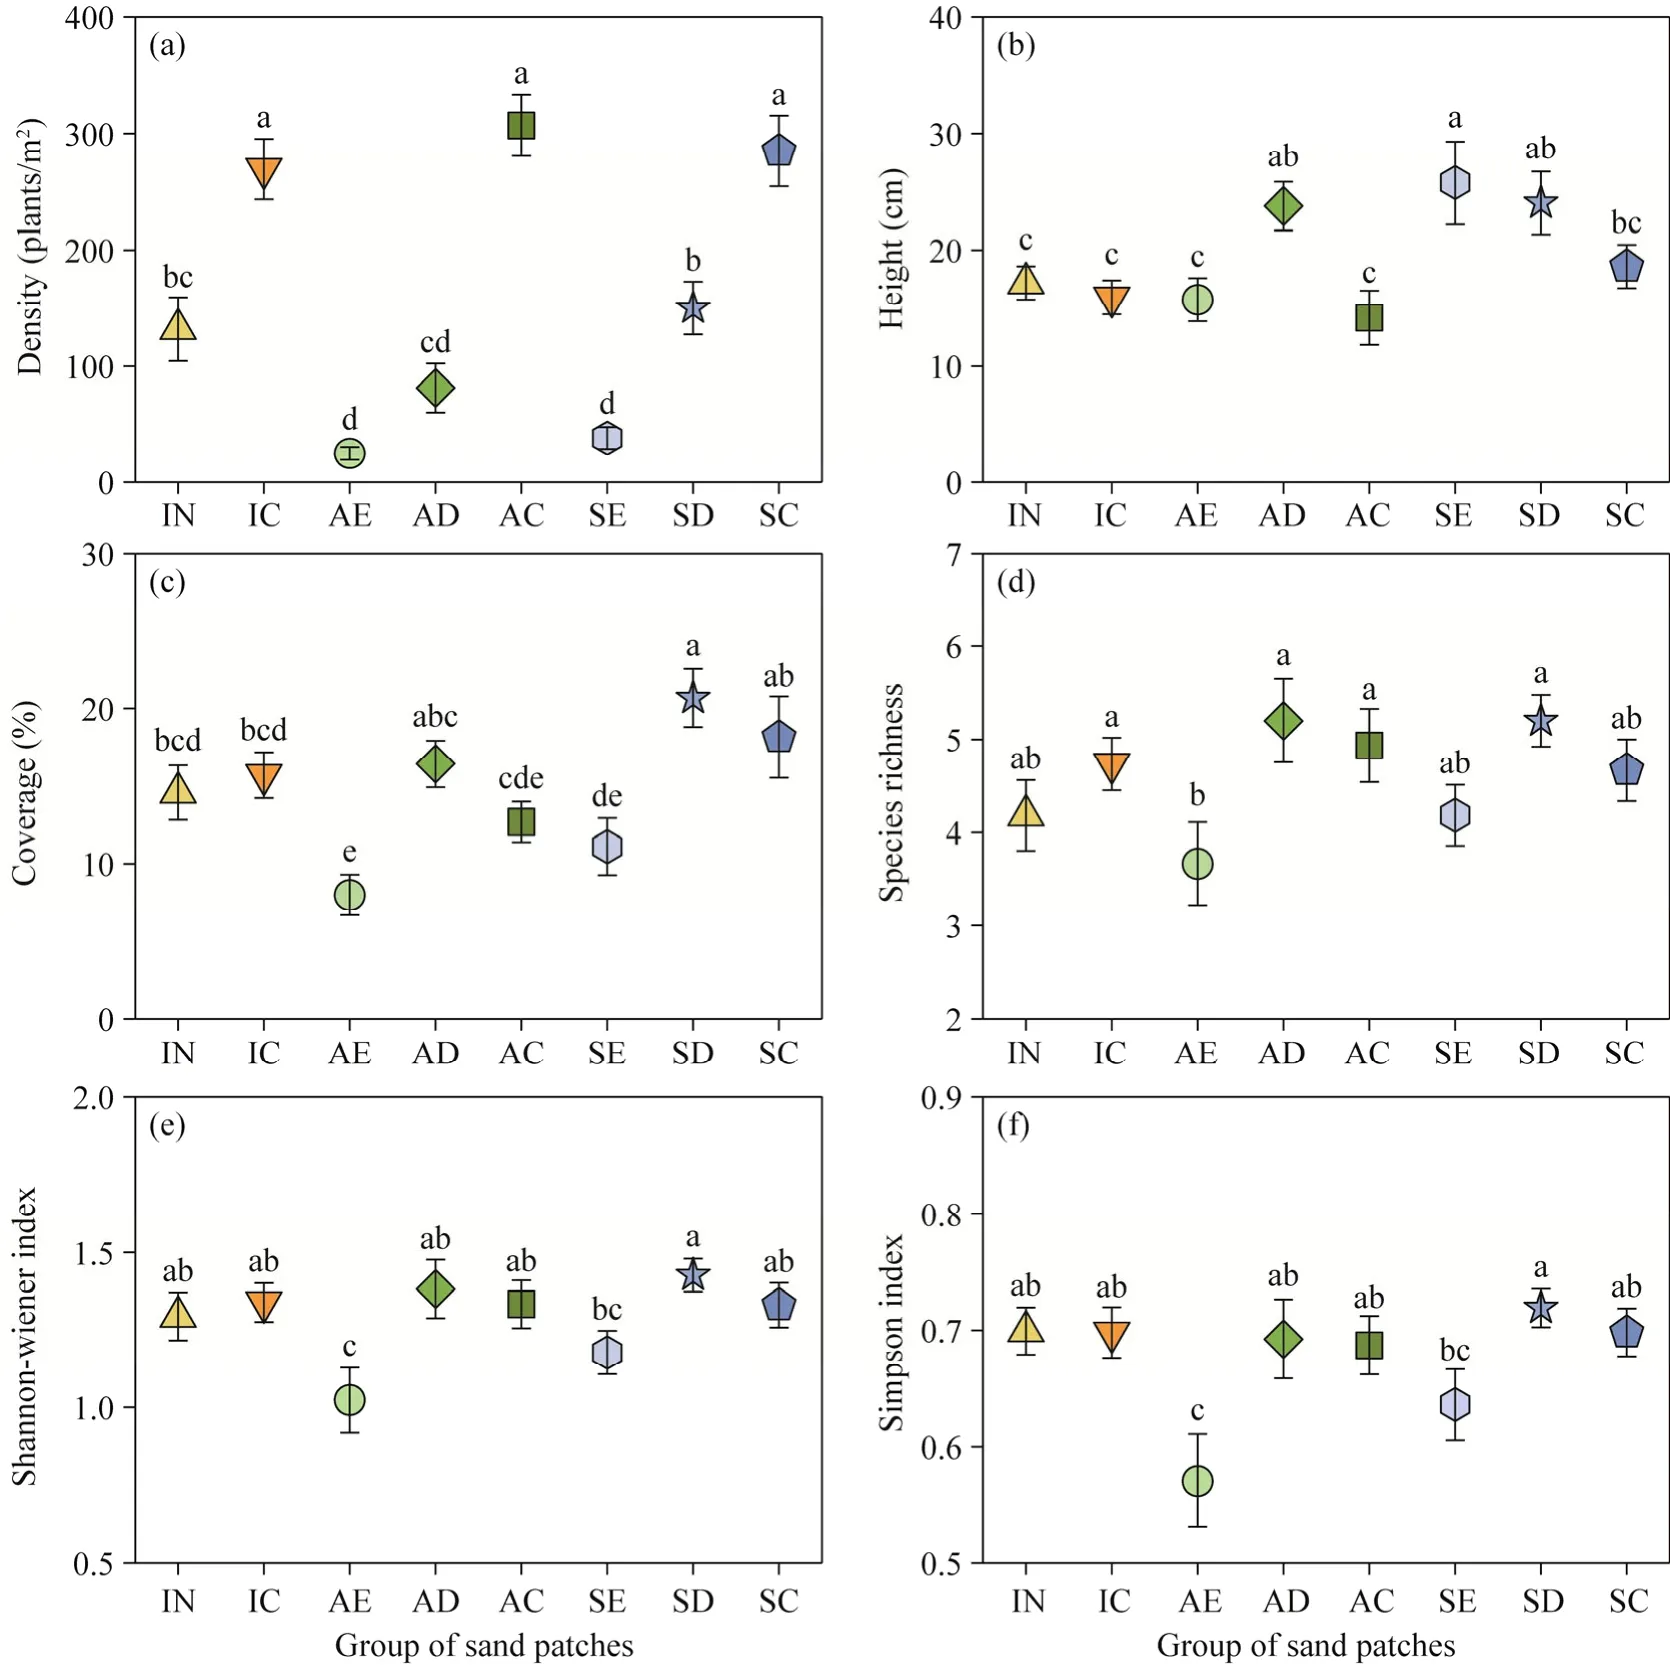
Fig.4 Plant community density (a), height (b), coverage (c), and diversity (d-f) in different groups of sand patches.Bars represent standard errors.Different lowercase letters indicate significant difference among different groups of sand patches at P<0.05 level.
The formation of sand patches led to a notable shift in vegetation community composition,characterized by a reduction in the dominance ofChloris virgataSw.andEragrostis minorHost,and an increase in the dominance ofCorispermum patelliformeIljin,Echinops gmelinaTurcz.,Agriophyllum squarrosum(Linn.) Moq., andArtemisia blepharolepisBge.The most significant changes in vegetation community composition occurred in the actively developing sand patches,followed by semi-fixed sand patches, with the weakest changes observed in the initial sand patches.Moreover, within the same sand patches, the alterations were more pronounced in the erosional area than in the depositional lobe (Table 2).However, the changes in species richness and diversity were limited, likely due to the relatively low number of plant species in the study area.Notably, only the actively developing sand patches erosional areas exhibited a significant decrease in species richness and diversity indices compared with the control areas (Fig.4d-f,P<0.05).
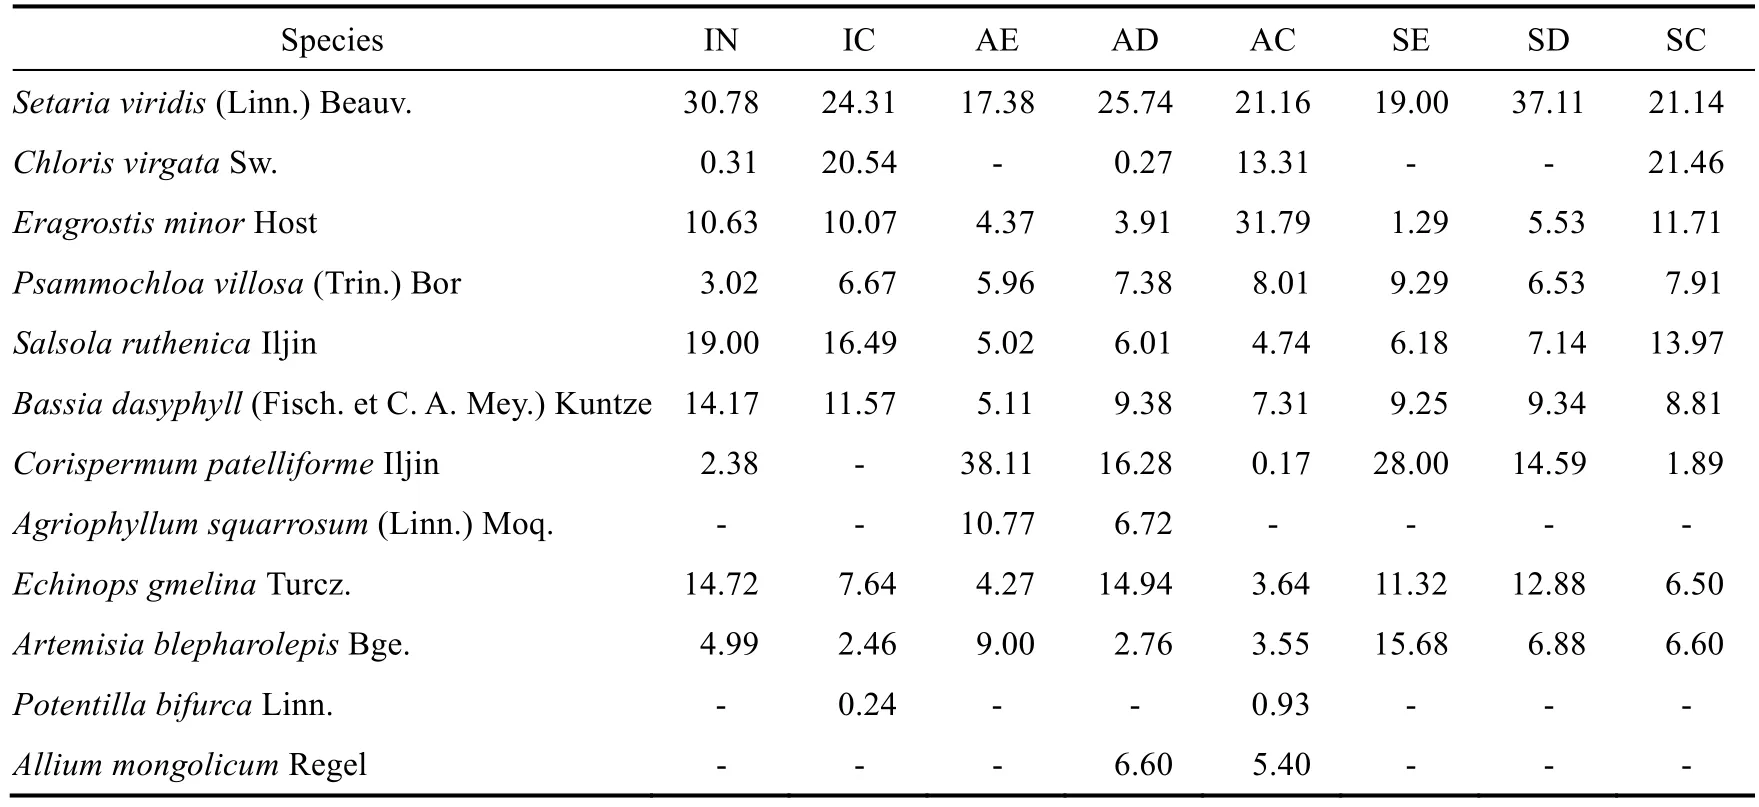
Table 2 Importance values of each species in different groups of sand patches
3.3 Soil properties of sand patches
Fine sand was the predominant soil particle size across all soil layers, ranging from 62.51% to 80.37% (Fig.5).The medium sand content in the surface soil of the initial sand patches was significantly lower than that of the actively developing and semi-fixed sand patches.Compared with control area, sand patch areas exhibited a decrease in the content of fine particles (very fine sand, silt, and clay) and an increase in coarse particles (fine and medium sand).The disparities in soil particle composition tended to diminish with increasing soil depth.
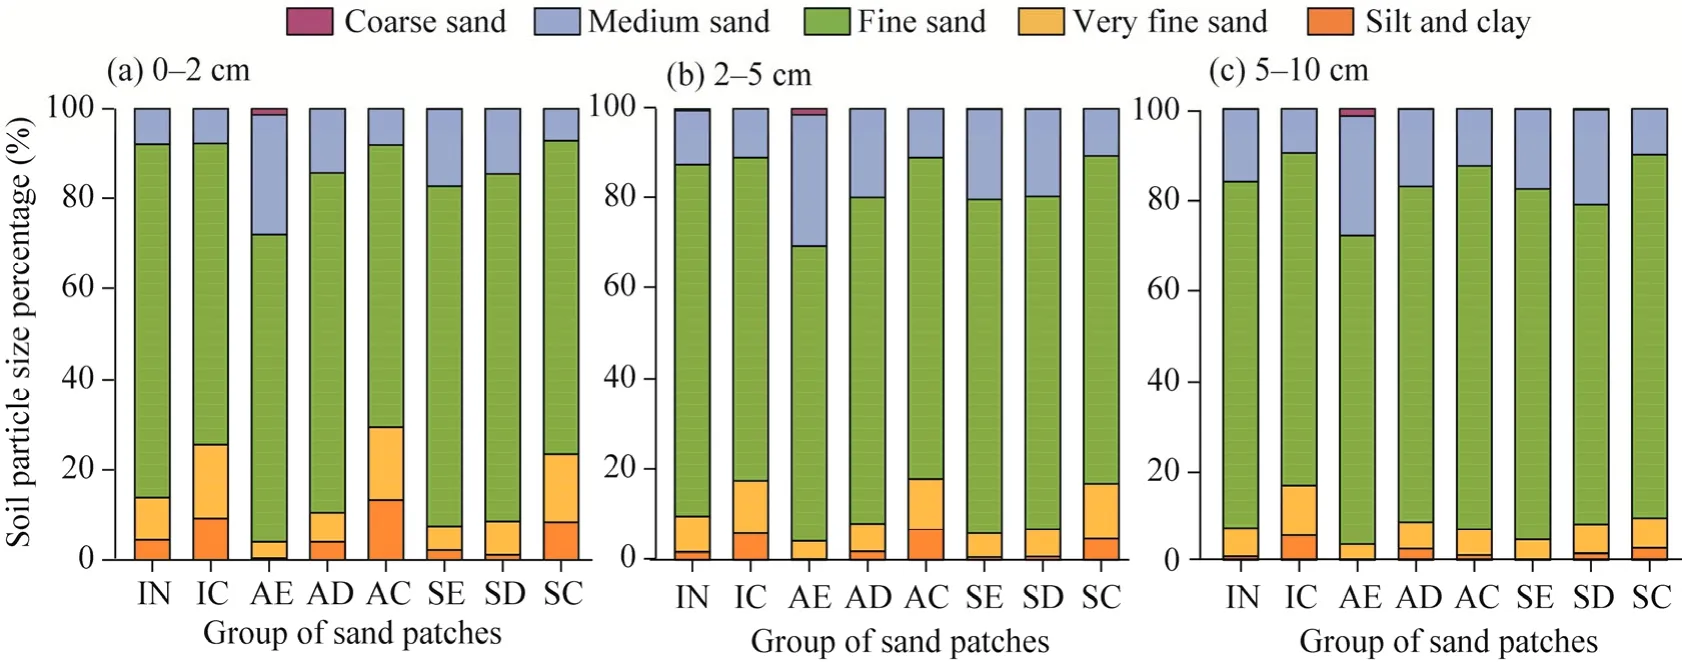
Fig.5 Soil particle size distribution at 0-2 (a), 2-5 (b), and 5-10 (c) cm depths in different groups of sand patches

Fig.6 Soil nutrient content in different groups of sand patches at 0-2, 2-5, and 5-10 cm depths.(a), SOC (soil organic carbon); (b), TN (total nitrogen); (c), TP (total phosphorus); (d), TK, (total potassium); (e), AN (available nitrogen); (f), AP (available phosphorus); (g), (d), AK, (available potassium).Bars represent standard errors.Different lowercase letters within the same soil depth indicate significant differences among different groups of sand patches at P<0.05 level.
Differences in soil particle composition often coincide with differences in soil nutrient content.As shown in Figure 6, SOC, TP, AN, and AP contents in the initial sand patches were higher than those in the actively developing and semi-fixed sand patches, while TP, TK, and AK contents in the initial and semi-fixed sand patches were greater than those in the actively developing sand patches.For the actively developing sand patches, SOC, TP, and AK contents were higher in the control area than in the depositional lobe and erosional area, whereas TN, AN, and TK contents were higher in the control area relative to the erosional area and depositional lobe.Concerning the semi-fixed sand patches, SOC, TN, TP, and AN contents were higher in the control areas compared with the erosional area and depositional lobe, and AK content in the control area and sand depositional lobe were higher than that in the erosion area.In addition, sand patches also affect soil moisture content.In the control area, precipitation can effectively increase soil water content at a depth of 5 cm, but the recharge effect on deep soil (such as 40 cm) in the sand patches was significantly stronger than that in the crust area (Fig.7a and b).Soil water content in the 5-10 and 10-20 cm depths of sand patches was higher than that in the control area in September 2019(Fig.7c).
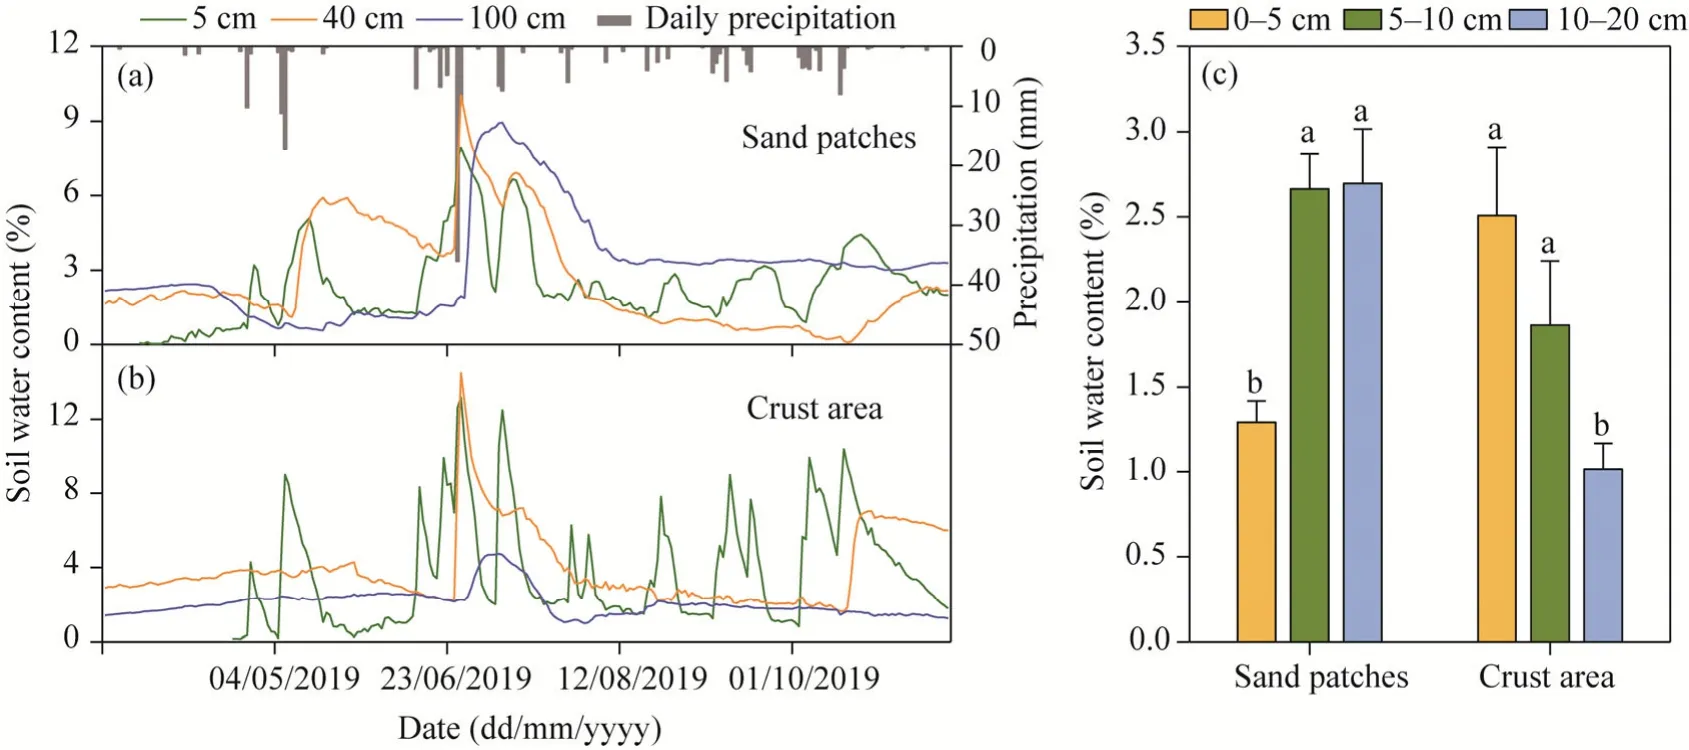
Fig.7 Comparison of soil water content between actively developing sand patches and crust area.(a), soil water content in the actively developing sand patches and daily precipitation; (b), soil water content under crust area; (c),soil water content at 0-5, 5-10, and 10-20 cm depths in the actively developing sand patches and crust area in September 2019.Different lowercase letters within the same soil depth indicate significant difference between sand patches and crust area at P<0.05 level.
4 Discussion
4.1 Sand patch development and controlling factors
4.1.1 Sand patch development process During our field study, we observed three types of sand patches (initial, actively developing, and semi-fixed) with diverse characteristics, which represent the growth and stabilization processes of sand patches.This result is similar to the conceptual model of blowout evolution proposed by Schwarz et al.(2019), who found three stages, i.e., physical, bio-geomorphological, and ecological, corresponding to blowout growth, stabilization, and decay, respectively.During the transition from the initial phase to the actively developing phase, the size and depth of sand patches undergo rapid increases primarily due to the dominance of an abiotic process (aeolian activity), aligning with the characteristics of physical stage.The transition from the actively developing phase to the recovery phase occurs as flora and microbiotic crusts infiltrate the inlet and pit-bottom regions, effectively preventing further erosion and expansion of sand patches,consequently initiating the bio-geomorphological stage.The size of sand patches may play a role in this transition.Within the railway protection system in Shapotou section, the length, width, and depth of the semi-fixed sand patches are smaller than those of the actively developing sand patches (Table 1).Specifically, the former had a maximum length, width, and depth of 11.90,6.80, and 0.46 m, respectively, while the latter had 26.04, 16.60, and 0.97 m, respectively.This disparity may be attributed to the transformation of sand patch surface during actively developing stage, transitioning from the original crust and flora to the underlying loose sand, leading to a significant decrease in roughness and a progressive increase in wind speed (Pluis and van Boxel,1993).Consequently, as the size of sand patch increases, the challenge of surface stabilization and natural sand patch recovery also intensifies.Under favorable climatic conditions, microbiotic crusts and flora spread across sand patches, ultimately covering and closing them, marking the onset of ecological stage dominated by biological processes.Nonetheless, only a few sand patches in the study area exhibit characteristics of ecological sand patches, likely due to two factors, i.e., the harsh climatic conditions, making it arduous for crusts and vegetation to colonize the sidewalls, resulting in a scarcity of fully fixed sand patches; and the limited topographic undulation caused by sand patch formation, challenging to identify them once they have been entirely immobilized by crusts and vegetation.
Semi-fixed sand patches are vulnerable to reactivation if climatic conditions worsen, such as strong winds or reduced precipitation, or external disturbance.It is challenging to determine whether a sand patch is undergoing a fixation trend or a reactivation process solely through spatial surveys.The initialization, expansion, stabilization, decay, and reactivation stages are all crucial processes in sand patch development, but not every sand patch undergoes each stage.Due to the nonlinear nature of bio-geomorphological feedback and climatic forcing over time (such as precipitation, wind speed, and wind direction), it is improbable that the development of sand patches will follow a straightforward linear trajectory over time but rather a highly intricate one.Therefore, further long-term observations or analysis using long-term remote sensing images are required to gain a deeper understanding of the developmental processes of sand patches within this protection system.
4.1.2 Controlling factors of sand patches
Surface destruction by disturbance is a crucial step in the formation of sand patches (Li et al.,2016), additional disturbance is visible within the protection system, in addition to vegetation and crust degradation under drought conditions, leading to surface destruction by wind erosion.The disturbance includes: (1) water erosion: surface scouring caused by moderate to heavy rainfall events breaks down the surface crust, creating small gullies (Fig.8a); (2) animal activities:excavation by gophers or rabbits can penetrate the surface crust and topsoil, resulting in the formation of sand particles forming mounds that cover part of the protective layer.High-density activity can easily lead to burrows and underground tunnels collapsing (Fig.8b and c); (3)gravitational effects: gravity causes imbalances in the surface crust and topsoil layers on steeper slopes, resulting in surface fissure (Fig.8d); and (4) anthropogenic activities: the surface is damaged by human trampling, as well as by transport and excavation activities during construction (Fig.8e and f).The magnitude, spatial coverage, and spatial configuration of disturbance play a significant role in disrupting the protective layer and exposing underlying sediments, thereby influencing subsequent surface changes.The likelihood of sand patch formation increases with higher disturbance intensity, larger area, increased connectivity, and adjacency (Schwarz et al., 2019).Within the study area, rat burrows and mounds, as well as one-off trampling disturbance and low-density rabbit burrows, tend to be smaller in size and less likely to result in the formation of sand patches.However, as the number of trampling disturbance and density of rabbit burrows increase, the degree and area of damage, as well as the likelihood of sand patches, also increase.Due to their relatively large area of destroy, gravity, and vehicle transport disturbances are more likely to lead to the formation of sand patches.Furthermore, the superposition of multiple disturbances further amplifies this likelihood.For instance, the presence of biological burrows on slopes can create free faces that exacerbate gravitational erosion (Xu et al., 2015; Hu et al., 2022).
In addition to the initial breach area and spatial distribution, climatic circumstance and surface erosion resistance are significant variables that affect sand patch information and expansion(Zhou et al., 2022).In general, surface erosion resistance is close related to crust type, crust thickness, soil moisture, soil aggregates, vegetation cover, and plant roots (Zhao et al., 2014;Guan et al., 2022).Precipitation and wind regime are the two most important climatic elements.Precipitation usually affects the expansion and restoration of sand patches by altering the surface conditions, affecting vegetation and crust growth, and soil moisture content.The erosional capacity of wind increase as its speed increases.Furthermore, the wind direction is crucial to sand patch expansion, with faster expansion occurring when the wind direction is parallel to the long axis of a sand patch.

Fig.8 Crust breakage under different types of disturbance.(a), crust destruction under heavy precipitation,forming small erosion trench; (b and c), mechanical damage to crusts caused by digging of rabbits and rats; (d),cracks in crust and topsoil layers by gravity; (e), crust destruction by human trampling; (f), surface disturbance by vehicle transportation.
4.2 Effect of sand patches on vegetation and soil properties
During sand patch expansion, continuous wind erosion incrementally destroys the topsoil structure in the erosion area, causing the surface to be gradually covered by underlying loose sand containing little fine-grained material and few nutrients, and the vertical differentiation of soil depths decreases or even disappears.Due to the disappearance of topsoil for storing a large number of seed banks (Bekker et al., 1998; Yan et al., 2005), the plant density decreased significantly.Herbaceous plants then exhibit poor growth, and plant species intolerant to wind erosion are excluded from the community.The exposure of herbaceous plant roots to harsh conditions, such as high temperature and dryness on the sand surface, leads to a decline in plant biomass and diversity.These changes align with the patterns observed in the vegetation and soil during dune activation process (Vogel et al., 2015; Tang et al., 2016).Sand depositional lobe also exhibits coarse soil particles, low soil nutrient content, and low plant density, which is consistent with the erosion area.However, sand depositional lobes display a light increase in vegetation height and coverage (Fig.4), which can be explained by the following aspects.First, sand burial often has a dual effect on plant growth, i.e., the promoting effect of moderate sand burial and the inhibiting effect of excessive sand burial (Vl eeshouwers, 1997; Yu et al., 2001).The overall intensity of blown-sand activity within the protection system is low owing to the weakening effect of frontal sand barrier fences, topography, and vegetation on wind speed (Li et al., 2004).Our field observation results showed that the maximum accumulation depth of an actively developing sand patch from 28 November, 2020 to 25 December, 2021 was 6.2 cm, and the average accumulation depth was 3.2 cm (Table 3).Second, the sand patch depositional lobes were dominated by plant species with lager canopies (e.g.,A.squarrosumandC.patelliforme), which were able to contribute a relatively high cover with few plants, as opposed to the control areas,which were dominated by plant species with smaller canopies (e.g.,C.virgata,E.minor, andS.viridis).Finally, and most importantly, the sand patches improved the efficient water storage of the soil in herbaceous root zone (Fig.7).This was attributed to the significant interception of precipitation by the crust in the control area and the increased water-holding capacity of the topsoil, which limited infiltration of soil moisture (Li et al., 2006a; Wang et al., 2007).Due to the concentration of soil moisture in the crust layer, the growth and development of herbaceous plants in the control area was inhibited and the plants became dwarfed, and this inhibition was more pronounced in drought years (Xiao et al., 2009).In the semi-fixed sand patches, vegetation density, height, cover, soil particulate matter, and nutrient content in the 0-2 cm soil depth in erosional areas increased compared with those in the actively developing sand patches, while these parameters remained similar in depositional lobes to the actively developing sand patches.The result indicated that soil and vegetation recovered more quickly in the erosional areas compared with the sand depositional lobes.In the process of sand patch fixation and restoration, algae are the first colonists (Pluis and van Boxel, 1993; Zhao and Wang, 2019).Small and initial sand patches are more likely to enter the stationary restoration stage than large actively developing sand patches when factors such as outer crust expansion,residual algal crust content, and the balance between algal colonization and erosion are considered.Meanwhile, the overall algal colonization rate was faster at the erosional areas compared with the deposition lobes.This disparity could be attributed to the topography at the wind inlet and flat bottom, which not only reduced wind speed but also promoted the inward expansion of the outer crust.Additionally, the collapse of the sidewall carried organic matter and algal crust debris to the patch bottom, further accelerating the colonization of algal crust in these areas.The formation of microbial crusts improves soil conditions and decreases susceptibility to wind erosion, facilitating subsequent colonization by annual plants (Liu et al., 2017).Thus, plant growth and 0-2 cm soil in the erosional areas were improved, but the prior large loss of soil seed bank density led to a limited increase in plant density, with plant density remaining much lower than that in the control areas.

Table 3 Surface changes in an actively developing sand patch
4.3 Suggestion and perspective
Moderate crust breakage is beneficial for water infiltration, promoting deep soil water storage in the protection system and facilitating the growth of annual herbaceous plants.However, the potential risk of sand patch formation increases with the growing area and degree of crust breakage.To define the threshold of crust breakage within the protective system, long-term field observations and indoor simulation experiments will be necessary in the future.Sand patches struggle to recover naturally due to substantial alterations in abiotic conditions, especially for large sand patches.Even when the stationary restoration phase is reached, any disturbance or climatic change may easily stimulate reactivation, and it takes a considerable long time for a sand patch to return to its initial state.Therefore, a combination of various manual input measures, in addition to enclosure, seems necessary to expedite the fixation and restoration of sand patches.Artificial inoculation is an effective way to restore habitat and accelerate ecosystem renewal(Wang et al., 2020).After algal crust inoculation, biological crust cover in the Tengger Desert increased rapidly from 6% to over 20% within two months (Zhao et al., 2019).For small initial sand patches where the topsoil is not completely eroded, artificial inoculation of algal crusts during the rainy season can be employed.In areas with strong sand activity and scarce topsoil seeds in the actively developing stage, stabilization of sand surface using straw checkerboard barriers, artificial inoculation of algal crust, and appropriate sowing of seeds for pioneer plants can collectively accelerate the ecological restoration of sand patches.This approach can also reduce the frequency of rebuilding straw checkerboard barriers.In the case of semi-fixed sand patches, this measure can primarily be applied to areas not yet covered by new algal crust.
5 Conclusions
A comprehensive analysis of sand patches within the protection system of the Baotou-Lanzhou railway was conducted through a series of field observations and indoor experiments.The study identified three distinct types of sand patches, i.e., initial sand patches, actively developing sand patches, and semi-fixed sand patches, each representing different developmental processes.Crust breakage induced by wind erosion, water erosion, gravitational erosion, animal digging, or anthropogenic disturbance appears to be a key factor in the formation of sand patches.Due to the weaker surface soils, sand patches tend to expand rather than deepen, with the rate of expansion influenced by dynamic conditions such as wind and erosion resistance of surface.Throughout the process of sand patch formation and expansion, there was a continuous loss of fine soil particles and nutrients, resulting in significant inhibition of vegetation growth in the erosional areas.However, the positive aspect of sand patches lies in the fact that crust breakage promotes water infiltration, enhancing deep soil water storage and facilitating the growth of annual herbaceous plants, particularly in depositional lobes.Under favorable climatic conditions, activated patches can transition to the restored phase, leading to improved vegetation and soil conditions in the erosional areas.Nevertheless, the likelihood of natural restoration decreases as sand patches expand.Despite these observations, further research is needed to determine the threshold at which sand patches can naturally recover, aiding in effective sand patch management.Additionally,continued field investigations and long-term remote sensing image analysis are essential for a more comprehensive understanding of sand patch development process and its relationship with climate change.
Conflict of interest
The authors declare that they have no known competing financial interests or personal relationships that could have appeared to influence the work reported in this paper.
Acknowledgements
This research was supported by the Key Research and Development Program of Ningxia Hui Autonomous Region, China (2022BEG02003), the Excellent Member of Youth Innovation Promotion Association, Chinese Academy of Sciences (Y202085), and the Youth Innovation Promotion Association, Chinese Academy of Sciences (2023448).
Author contributions
Conceptualization: DUN Yaoquan, QU Jianjun; Methodology: DUN Yaoquan, KANG Wenyan; Formal analysis:DUN Yaoquan, LIU Bin, LI Minlan; Writing - original draft preparation: DUN Yaoquan; Writing - review and editing: WANG Tao, SHAO Mei; Funding acquisition: WANG Tao, KANG Wenyan.All authors approved the manuscript.

- Journal of Arid Land的其它文章
- Exploring groundwater quality in semi-arid areas of Algeria: Impacts on potable water supply and agricultural sustainability
- Runoff change in the Yellow River Basin of China from 1960 to 2020 and its driving factors
- A CMIP6-based assessment of regional climate change in the Chinese Tianshan Mountains
- Influence of varied drought types on soil conservation service within the framework of climate change:insights from the Jinghe River Basin, China
- Land use and cover change and influencing factor analysis in the Shiyang River Basin, China
- Effects of landscape fragmentation of plantation forests on carbon storage in the Loess Plateau, China